 RSS Feed
 by Calculated Risk on 8/08/2022 08:49:00 AM
Monday, August 08, 2022
August 8th Update: Housing Inventory Increases Slow
Inventory is still increasing, but the inventory build has slowed. Here are the same week inventory changes for the last four years:
2022: 5.0K
2021: 4.5K
2020: -14.0K
2019: -6.4K
Inventory bottomed seasonally at the beginning of March 2022 and is now up 126% since then. Altos reports inventory is up 32.1% year-over-year and is now 24.4% above the peak last year.
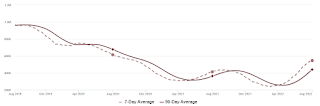 Click on graph for larger image.
This inventory graph is courtesy of Altos Research.
 Click on graph for larger image.
This inventory graph is courtesy of Altos Research.
As of August 5th, inventory was at 544 thousand (7-day average), compared to 539 thousand the prior week. Inventory was up 0.9% from the previous week.
Inventory is still historically low. Compared to the same week in 2021, inventory is up 32.1% from 412 thousand, however compared to the same week in 2020 inventory is down 11.2% from 613 thousand. Compared to 3 years ago, inventory is down 43.7% from 966 thousand.
Here are the inventory milestones I’m watching for with the Altos data:
1. The seasonal bottom (happened on March 4th for Altos) ✅
2. Inventory up year-over-year (happened on May 13th for Altos) ✅
3. Inventory up compared to two years ago (currently down 11.2% according to Altos)
4. Inventory up compared to 2019 (currently down 43.7%).
1. The seasonal bottom (happened on March 4th for Altos) ✅
2. Inventory up year-over-year (happened on May 13th for Altos) ✅
3. Inventory up compared to two years ago (currently down 11.2% according to Altos)
4. Inventory up compared to 2019 (currently down 43.7%).

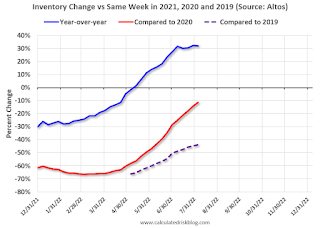
Here is a graph of the inventory change vs 2021, 2020 (milestone 3 above) and 2019 (milestone 4).
The blue line is the year-over-year data, the red line is compared to two years ago, and dashed purple is compared to 2019.
Two years ago (in 2020) inventory was declining all year, so the two-year comparison will get easier all year.
Based on the recent increases in inventory, my current estimate is inventory will be up compared to 2020 in September of this year.
Mike Simonsen discusses this data regularly on Youtube.


