 RSS Feed
 by Calculated Risk on 6/15/2022 08:37:00 AM
Wednesday, June 15, 2022
Retail Sales Decreased 0.3% in May
On a monthly basis, retail sales were decreased 0.3% from April to May (seasonally adjusted), and sales were up 8.1 percent from May 2021.
From the Census Bureau report:
Advance estimates of U.S. retail and food services sales for May 2022, adjusted for seasonal variation and holiday and trading-day differences, but not for price changes, were $672.9 billion, a decrease of 0.3 percent from the previous month, but 8.1 percent above May 2021. ... The March 2022 to April 2022 percent change was revised from up 0.9 percent to up 0.7 percent.
emphasis added
 Click on graph for larger image.
This graph shows retail sales since 1992. This is monthly retail sales and food service, seasonally adjusted (total and ex-gasoline).
Retail sales ex-gasoline were down 0.7% in May.
The second graph shows the year-over-year change in retail sales and food service (ex-gasoline) since 1993.
Retail and Food service sales, ex-gasoline, increased by 5.7% on a YoY basis.
 Sales in May were below expectations, and sales in March and April were revised down, combined.
MBA: Mortgage Applications Increase in Latest Weekly Survey
by Calculated Risk on 6/15/2022 07:00:00 AM
Note: This was before the recent surge in 3-year mortgage rates to over 6%.
From the MBA: Mortgage Applications Increase in Latest MBA Weekly Survey
Mortgage applications increased 6.6 percent from one week earlier, according to data from the Mortgage Bankers Association’s (MBA) Weekly Mortgage Applications Survey for the week ending June 10, 2022. Last week’s results are compared to the prior week, which included an adjustment for the Memorial Day holiday.
... The Refinance Index increased 4 percent from the previous week and was 76 percent lower than the same week one year ago. The seasonally adjusted Purchase Index increased 8 percent from one week earlier. The unadjusted Purchase Index increased 18 percent compared with the previous week and was 16 percent lower than the same week one year ago.
"Mortgage rates increased for all loan types, with the 30-year fixed rate last week jumping 25 basis points to 5.65 percent – the highest level since 2008. Mortgage rates followed Treasury yields up in response to higher-than-expected inflation and anticipation that the Federal Reserve will need to raise rates at a faster pace,” said Joel Kan, MBA’s Associate Vice President of Economic and Industry Forecasting. “Despite the increase in rates, application activity rebounded following the Memorial Day holiday week but remained 0.29 percent below pre-holiday levels. With mortgage rates well above 5 percent, refinance activity continues to run more than 70 percent lower than last year.”
Added Kan, “Purchase applications were down more than 15 percent compared to last year, as ongoing inventory shortages and affordability challenges have cooled demand, coinciding with the rapid jump in mortgage rates.”
...
The average contract interest rate for 30-year fixed-rate mortgages with conforming loan balances ($647,200 or less) increased to 5.65 percent from 5.40 percent, with points increasing to 0.71 from 0.60 (including the origination fee) for 80 percent loan-to-value ratio (LTV) loans.
emphasis added
 Click on graph for larger image.
The first graph shows the refinance index since 1990.
With higher mortgage rates, the refinance index has declined sharply over the last several months.
The refinance index is just above the lowest level since the year 2000.
The second graph shows the MBA mortgage purchase index
 According to the MBA, purchase activity is down 16% year-over-year unadjusted.
Note: Red is a four-week average (blue is weekly).
Tuesday, June 14, 2022
Wednesday: Retail Sales, Homebuilder Confidence, FOMC Statement
by Calculated Risk on 6/14/2022 09:05:00 PM
Note: it seemed that the Fed was going to raise rates 50bp, but now many participants think the Fed will raise rates 75bp.
 From Matthew Graham at Mortgage News Daily: Mortgage Rates Continue Higher Into The 6's
Yes, mortgage rates really moved above 6% yesterday for the first time since 2008. ... The average lender is quoting top tier 30yr fixed rates in the 6.25-6.375% range, but as we discussed yesterday, it's cheaper than normal to buy one's rate down. That means rates in the high 5's are still being quoted, but those quotes imply higher upfront costs (aka "points"). [30 year fixed 6.28%]Wednesday:
emphasis added
• At 7:00 AM ET, The Mortgage Bankers Association (MBA) will release the results for the mortgage purchase applications index.
• At 8:30 AM, Retail sales for May is scheduled to be released. The consensus is for a 0.2% increase in retail sales.
• Also at 8:30 AM, The New York Fed Empire State manufacturing survey for June. The consensus is for a reading of 4.5, up from -11.6.
• At 10:00 AM, The June NAHB homebuilder survey. The consensus is for a reading of 68, down from 69 last month. Any number below 50 indicates that more builders view sales conditions as poor than good.
• At 2:00 PM, FOMC Meeting Announcement. The FOMC is expected to raise the Fed Funds rate by 50bp at this meeting.
• Also at 2:00 PM, FOMC Forecasts This will include the Federal Open Market Committee (FOMC) participants' projections of the appropriate target federal funds rate along with the quarterly economic projections.
• At 2:30 PM, Fed Chair Jerome Powell holds a press briefing following the FOMC announcement.
On COVID (focus on hospitalizations and deaths):
| COVID Metrics | ||||
|---|---|---|---|---|
| Now | Week Ago | Goal | ||
| Percent fully Vaccinated | 66.8% | --- | ≥70.0%1 | |
| Fully Vaccinated (millions) | 221.8 | --- | ≥2321 | |
| New Cases per Day3🚩 | 106,246 | 105,846 | ≤5,0002 | |
| Hospitalized3🚩 | 23,509 | 23,205 | ≤3,0002 | |
| Deaths per Day3 | 283 | 294 | ≤502 | |
| 1 Minimum to achieve "herd immunity" (estimated between 70% and 85%). 2my goals to stop daily posts, 37-day average for Cases, Currently Hospitalized, and Deaths 🚩 Increasing 7-day average week-over-week for Cases, Hospitalized, and Deaths ✅ Goal met. | ||||
 Click on graph for larger image.
This graph shows the daily (columns) and 7-day average (line) of deaths reported.
Average daily deaths bottomed in July 2021 at 214 per day.
LA Port Traffic: Steady in May
by Calculated Risk on 6/14/2022 04:03:00 PM
Notes: The expansion to the Panama Canal was completed in 2016 (As I noted a few years ago), and some of the traffic that used the ports of Los Angeles and Long Beach is probably going through the canal. This might be impacting TEUs on the West Coast.
Container traffic gives us an idea about the volume of goods being exported and imported - and usually some hints about the trade report since LA area ports handle about 40% of the nation's container port traffic.
The following graphs are for inbound and outbound traffic at the ports of Los Angeles and Long Beach in TEUs (TEUs: 20-foot equivalent units or 20-foot-long cargo container).
To remove the strong seasonal component for inbound traffic, the first graph shows the rolling 12-month average.
 Click on graph for larger image.
On a rolling 12-month basis, inbound traffic was declines 0.4% in May compared to the rolling 12 months ending in April. Outbound traffic was down 0.1% compared to the rolling 12 months ending the previous month.
The 2nd graph is the monthly data (with a strong seasonal pattern for imports).
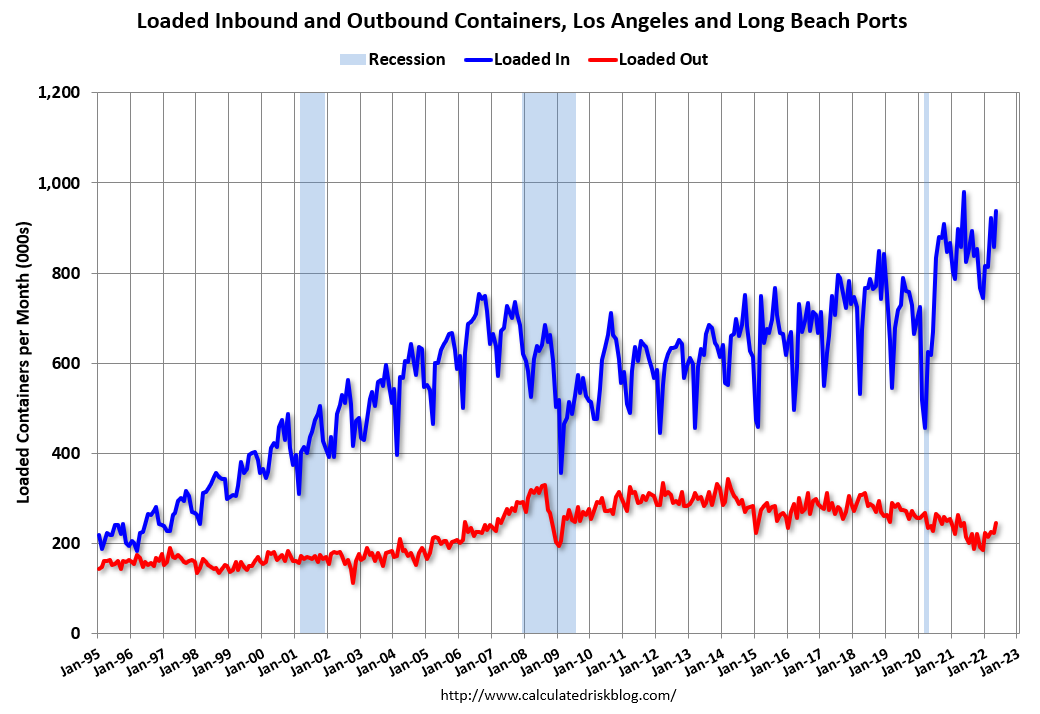 Usually imports peak in the July to October period as retailers import goods for the Christmas holiday, and then decline sharply and bottom in February or March depending on the timing of the Chinese New Year.
Imports were down 4% YoY in May, and exports were down 1% YoY. Note that May 2021 saw the most import traffic ever.
There is no impact - yet - on inbound traffic due to the shutdown in China.
Comparing the Current Housing Market to the 1978 to 1982 period
by Calculated Risk on 6/14/2022 11:34:00 AM
Today, in the Calculated Risk Real Estate Newsletter: Comparing the Current Housing Market to the 1978 to 1982 period
A brief excerpt:
In the 1978 to 1982 period, demographics were very favorable for homebuying as the baby boomers moved into the first-time homebuying age group (similar to the millennials now).There is much more in the article. You can subscribe at https://calculatedrisk.substack.com/
This graph shows the longer-term trend for three key age groups: 20 to 29, 25 to 34, and 30 to 39 (the groups overlap). This graph is from 1960 to 2060 (all data from Census: current to 2060 is projected).
We can see the surge in the 20 to 29 age group last decade (red). Once this group exceeded the peak in earlier periods, there was an increase in apartment construction. This age group peaked in 2018 / 2019 (until the 2030s), and the 25 to 34 age group (orange, dashed) will peak around 2023.
For buying, the 30 to 39 age group (blue) is important. The population in this age group is increasing and will increase further over this decade.
When we look back at the 1978 to 1982 period, the 30 to 39 age group (blue) was increasing even more than today.

A Very Early Look at 2023 Cost-Of-Living Adjustments and Maximum Contribution Base
by Calculated Risk on 6/14/2022 09:55:00 AM
The BLS reported on Friday:
The Consumer Price Index for Urban Wage Earners and Clerical Workers (CPI-W) increased 9.3 percent over the last 12 months to an index level of 288.022 (1982-84=100). For the month, the index rose 1.2 percent prior to seasonal adjustment.CPI-W is the index that is used to calculate the Cost-Of-Living Adjustments (COLA). The calculation dates have changed over time (see Cost-of-Living Adjustments), but the current calculation uses the average CPI-W for the three months in Q3 (July, August, September) and compares to the average for the highest previous average of Q3 months. Note: this is not the headline CPI-U and is not seasonally adjusted (NSA).
• In 2021, the Q3 average of CPI-W was 268.421.
The 2021 Q3 average was the highest Q3 average, so we only have to compare Q3 this year to last year.
 Click on graph for larger image.
This graph shows CPI-W since January 2000. The red lines are the Q3 average of CPI-W for each year.
Note: The year labeled is for the calculation, and the adjustment is effective for December of that year (received by beneficiaries in January of the following year).
CPI-W was up 9.3% year-over-year in May, and although this is very early - we need the data for July, August and September - my very early guess is COLA will probably be close to 9% this year, the largest increase since 11.2% in 1981.
Contribution and Benefit Base
The contribution base will be adjusted using the National Average Wage Index. This is based on a one-year lag. The National Average Wage Index is not available for 2021 yet, but wages probably increased again in 2021. If wages increased 4% in 2021, then the contribution base next year will increase to around $153,000 in 2023, from the current $147,000.
Remember - this is a very early look. What matters is average CPI-W, NSA, for all three months in Q3 (July, August and September).
BLS: PPI increased 0.8% in May; Core PPI increased 0.5%
by Calculated Risk on 6/14/2022 08:33:00 AM
The Producer Price Index for final demand increased 0.8 percent in May, seasonally adjusted, the U.S. Bureau of Labor Statistics reported today. ... On an unadjusted basis, final demand prices moved up 10.8 percent for the 12 months ended in May.The consensus was for 0.8% increase in PPI, and a 0.6% increase in core PPI. PPI was at expectations, and core PPI was slightly below expectations.
...
Prices for final demand less foods, energy, and trade services moved up 0.5 percent in May after increasing 0.4 percent in April. For the 12 months ended in May, the index for final demand less foods, energy, and trade services rose 6.8 percent.
emphasis added
Monday, June 13, 2022
Goldman Expects 75bp Rate Hike
by Calculated Risk on 6/13/2022 08:48:00 PM
From Goldman Sachs chief economist Jan Hatzius
"We have revised our forecast to include 75bp hikes in June and July. This would quickly reset the level of the funds rate at 2.25-2.5%, the FOMC’s median estimate of the neutral rate."Tuesday:
emphasis added
• At 6:00 AM ET, NFIB Small Business Optimism Index for May.
• At 8:30 AM, The Producer Price Index for May from the BLS. The consensus is for a 0.8% increase in PPI, and a 0.6% increase in core PPI.
On COVID (focus on hospitalizations and deaths):
| COVID Metrics | ||||
|---|---|---|---|---|
| Now | Week Ago | Goal | ||
| Percent fully Vaccinated | 66.8% | --- | ≥70.0%1 | |
| Fully Vaccinated (millions) | 221.7 | --- | ≥2321 | |
| New Cases per Day3🚩 | 103,821 | 99,621 | ≤5,0002 | |
| Hospitalized3 | 21,746 | 22,956 | ≤3,0002 | |
| Deaths per Day3🚩 | 276 | 266 | ≤502 | |
| 1 Minimum to achieve "herd immunity" (estimated between 70% and 85%). 2my goals to stop daily posts, 37-day average for Cases, Currently Hospitalized, and Deaths 🚩 Increasing 7-day average week-over-week for Cases, Hospitalized, and Deaths ✅ Goal met. | ||||
 Click on graph for larger image.
This graph shows the daily (columns) and 7-day average (line) of deaths reported.
Average daily deaths bottomed in July 2021 at 214 per day.
30-Year Mortgage Rates Increase to 6.13%
by Calculated Risk on 6/13/2022 03:21:00 PM
 From Matthew Graham at MortgageNewsDaily: MBS Live Morning: From Bad to Worse as CPI Reaction Continues
Bonds are in the midst of a full-blown capitulation move with 10yr yields currently up over 16bps at 3.32%. MBS are down roughly a full point. These aren't the biggest losses we've ever seen in a day, but they're extraordinarily big losses to be experiencing at the top of trend that has already covered as much ground as the one seen so far in 2022.
...
Long story short, the market is freaked out about what Friday means for the policy outlook. Wednesday continues to be one of the biggest flashpoints for bond volatility we've seen in a long time.
 Click on graph for larger image.
This is a graph from Mortgage News Daily (MND) showing 30-year fixed rates from three sources (MND, MBA, Freddie Mac) over the last year.
The 30-year fixed rate for top tier scenarios was 6.13% today, up from 5.55% last Thursday.
Go to MND and you can adjust the graph for different time periods.
2nd Look at Local Housing Markets in May, New Listings picking up
by Calculated Risk on 6/13/2022 12:10:00 PM
Today, in the Calculated Risk Real Estate Newsletter: 2nd Look at Local Housing Markets in May, New Listings picking up
A brief excerpt:
This is the second look at local markets in May. I’m tracking about 35 local housing markets in the US. Some of the 35 markets are states, and some are metropolitan areas. I’ll update these tables throughout the month as additional data is released.There is much more in the article. You can subscribe at https://calculatedrisk.substack.com/
We are seeing a significant change in inventory, and maybe a pickup in new listings. So far, most of the increase in inventory has been due to softer demand - likely because of higher mortgage rates - but we need to keep an eye on new listings too.
On a national basis, we saw record low inventory levels over the Winter. Last year, inventory didn’t bottom seasonally until early April. This year inventory bottomed in February (normal seasonal timing), and recent data from Altos Research and Realtor.com, indicate active inventory was up year-over-year in May. I expect the local market reports will show inventory up year-over-year in May too.
...
And here is a table for new listings in May. For these areas, new listings were up 5.0% YoY. Last month, new listings in these markets were down 6.2% YoY. This could be a significant change, and the first sign of a pickup in new listings. If new listings increase, combined with less demand, we will see active inventory increase quickly.Notes for all tables:
1) New additions to table in BOLD.
2) Northwest (Seattle), North Texas (Dallas) and Santa Clara (San Jose), Mid-Florida (Tampa, Orlando), Jacksonville, Source: Northeast Florida Association of REALTORS®
3) Totals do not include Denver or Atlanta (included in state totals).


