 RSS Feed
 by Calculated Risk on 5/06/2022 09:21:00 PM
Friday, May 06, 2022
COVID May 6, 2022: New Cases, Hospitalizations and Deaths Increasing
On COVID (focus on hospitalizations and deaths):
| COVID Metrics | ||||
|---|---|---|---|---|
| Now | Week Ago | Goal | ||
| Percent fully Vaccinated | 66.3% | --- | ≥70.0%1 | |
| Fully Vaccinated (millions) | 220.0 | --- | ≥2321 | |
| New Cases per Day3🚩 | 67,263 | 54,883 | ≤5,0002 | |
| Hospitalized3🚩 | 12,602 | 11,162 | ≤3,0002 | |
| Deaths per Day3🚩 | 341 | 315 | ≤502 | |
| 1 Minimum to achieve "herd immunity" (estimated between 70% and 85%). 2my goals to stop daily posts, 37-day average for Cases, Currently Hospitalized, and Deaths 🚩 Increasing 7-day average week-over-week for Cases, Hospitalized, and Deaths ✅ Goal met. | ||||
 Click on graph for larger image.
This graph shows the daily (columns) and 7-day average (line) of deaths reported.
Average daily deaths bottomed in July 2021 at 214 per day.
AAR: April Rail Carloads and Intermodal Down Year-over-year
by Calculated Risk on 5/06/2022 03:46:00 PM
From the Association of American Railroads (AAR) Rail Time Indicators. Graphs and excerpts reprinted with permission.
U.S. rail traffic in April 2022 was like a box of assorted chocolates: it had something for everyone. Optimists can point to several commodities that had solid traffic gains. For example, April 2022 was the third best month ever for carloads of chemicals, with carloads up 3.4% over last year. April’s carloads of iron and steel scrap were the highest since August 2013, while carloads of autos and auto parts were up 12.0% over last year. Carloads of food products and crushed stone and sand were also up.
Pessimists can point to several traffic categories with lower volumes in April. For example, carloads of grain in April were the fewest in seven months, coal carloads were the lowest in more than a year, and carloads of petroleum products were their second lowest since September 2017.
emphasis added
 Click on graph for larger image.
This graph from the Rail Time Indicators report shows the six-week average of U.S. Carloads in 2020, 2021 and 2022:
Total carloads on U.S. railroads fell 3.4% in April 2022 from April 2021, their second monthly decline so far this year following 10 straight monthly gains from March to December 2021. For 2022 through April, total carloads were up 1.1% over the same period in 2021.
 The second graph shows the six-week average (not monthly) of U.S. intermodal in 2020, 2021 and 2022: (using intermodal or shipping containers):
U.S. railroads originated an average of 270,788 intermodal containers and trailers per week in April 2022. That’s the most since August 2021, but down 7.7% from April 2021. For context, April 2021 was the best intermodal month in history for U.S. railroads.
1st Look at Local Housing Markets in April; Realtor.com shows active inventory down only 3% year-over-year
by Calculated Risk on 5/06/2022 11:31:00 AM
Today, in the Calculated Risk Real Estate Newsletter: 1st Look at Local Housing Markets in April
A brief excerpt:
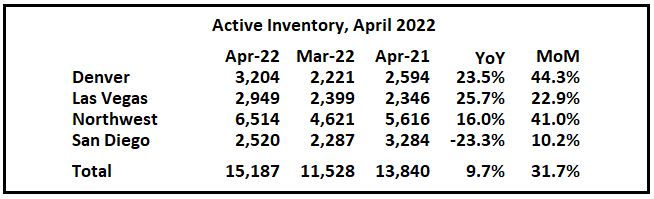
Here is a summary of active listings for these housing markets in April. Note: Inventory usually increases seasonally in April, so some month-over-month (MoM) increase is not surprising.There is much more in the article. You can subscribe at https://calculatedrisk.substack.com/
Inventory was up 31.7% in April MoM from March, and up 9.7% year-over-year (YoY). The YoY increase in inventory in these markets was impacted by San Diego (a very tight market). The other markets were up YoY.
These markets were down 26% YoY in February, and unchanged YoY in March, so this is a significant change from February and March. This is another step towards a more balanced market, but inventory levels are still very low.
Notes for all tables:
1) New additions to table in BOLD.
2) Northwest (Seattle)
Used Vehicle Wholesale Prices Decline Seasonally Adjusted in April
by Calculated Risk on 5/06/2022 11:05:00 AM
From Manheim Consulting today: Wholesale Used-Vehicle Prices Decline in April From Seasonal Adjustment
Wholesale used-vehicle prices (on a mix-, mileage- and seasonally adjusted basis) declined 1.0% in April from March. The Manheim Used Vehicle Value Index declined to 221.2, which was up 14.0% from a year ago. The non-adjusted price change in April was an increase of 2.9% compared to March, leaving the unadjusted average price up 16.4% year over year.
Manheim Market Report (MMR) values saw weekly price increases that were strongest to start April and slowed as the month progressed.
emphasis added
 Click on graph for larger image.
This index from Manheim Consulting is based on all completed sales transactions at Manheim’s U.S. auctions.
The Manheim index suggests used car prices declined in April seasonally adjusted but are still up 14.0% year-over-year.
Note: This index was up 25% YoY last month, and up 45% YoY in January - so it appears prices will be down YoY soon.
According to the BLS, "Used cars and trucks" were down 3.8% in March compared to February and up 35% year-over-year in March. It seems likely that "Used cars and trucks" will be down again in the April CPI report.
Comments on April Employment Report
by Calculated Risk on 5/06/2022 09:11:00 AM
This was another solid report.
The headline jobs number in the April employment report was slightly above expectations, however employment for the previous two months was revised down by 39,000. The participation rate and the employment-population ratio both decreased slightly, and the unemployment rate was unchanged at 3.6%.
Excluding leisure and hospitality, the economy has added back all the jobs lost at the beginning of the pandemic. Leisure and hospitality gained 78 thousand jobs in April. At the beginning of the pandemic, in March and April of 2020, leisure and hospitality lost 8.20 million jobs, and are now down 1.44 million jobs since February 2020. So, leisure and hospitality has now added back about 83% all of the jobs lost in March and April 2020.
Construction employment increased 2 thousand and is now 4 thousand above the pre-pandemic level.
Manufacturing added 55 thousand jobs and is still 56 thousand below the pre-pandemic level.
Earlier: April Employment Report: 428 thousand Jobs, 3.6% Unemployment Rate
In April, the year-over-year employment change was 6.6 million jobs.
Permanent Job Losers
 Click on graph for larger image.
This graph shows permanent job losers as a percent of the pre-recession peak in employment through the report today.
In April, the year-over-year employment change was 6.6 million jobs.
Permanent Job Losers
 Click on graph for larger image.
This graph shows permanent job losers as a percent of the pre-recession peak in employment through the report today.
This data is only available back to 1994, so there is only data for three recessions.
In April, the number of permanent job losers decreased to 1.386 million from 1.392 million in the previous month.
In April, the number of permanent job losers decreased to 1.386 million from 1.392 million in the previous month.
These jobs were likely the hardest to recover, so it is a positive that the number of permanent job losers is almost back to pre-recession levels.
Prime (25 to 54 Years Old) Participation
 Since the overall participation rate has declined due to cyclical (recession) and demographic (aging population, younger people staying in school) reasons, here is the employment-population ratio for the key working age group: 25 to 54 years old.
The 25 to 54 participation rate decreased in April to 82.4% from 82.5% in March, and the 25 to 54 employment population ratio decreased to 79.9% from 80.0% the previous month.
Both are slightly below the pre-pandemic levels and indicate almost all of the prime age workers have returned to the labor force.
Part Time for Economic Reasons
 From the BLS report:
These workers are included in the alternate measure of labor underutilization (U-6) that increased to 7.0% from 6.9% in the previous month. This is down from the record high in April 22.9% for this measure since 1994. This measure at the 7.0% in February 2020 (pre-pandemic).
Unemployed over 26 Weeks
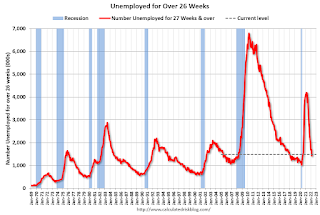 This graph shows the number of workers unemployed for 27 weeks or more.
According to the BLS, there are 1.483 million workers who have been unemployed for more than 26 weeks and still want a job, up from 1.428 million the previous month.
This does not include all the people that left the labor force.
Summary:
The headline monthly jobs number was slightly above expectations; however, the previous two months were revised down by 39,000 combined.
Part Time for Economic Reasons
 From the BLS report:
"The number of persons employed part time for economic reasons was little changed at 4.0 million in April and is down by 357,000 from its February 2020 level. These individuals, who would have preferred full-time employment, were working part time because their hours had been reduced or they were unable to find full-time jobs."The number of persons working part time for economic reasons decreased in April to 4.033 million from 4.170 million in March. This is below pre-recession levels.
These workers are included in the alternate measure of labor underutilization (U-6) that increased to 7.0% from 6.9% in the previous month. This is down from the record high in April 22.9% for this measure since 1994. This measure at the 7.0% in February 2020 (pre-pandemic).
Unemployed over 26 Weeks
 This graph shows the number of workers unemployed for 27 weeks or more.
 According to the BLS, there are 1.483 million workers who have been unemployed for more than 26 weeks and still want a job, up from 1.428 million the previous month.
This does not include all the people that left the labor force.
Summary:
The headline monthly jobs number was slightly above expectations; however, the previous two months were revised down by 39,000 combined.
The headline unemployment rate was unchanged at 3.6%.
There are still 1.2 million fewer jobs than prior to the recession.
Overall, this was another solid report.
April Employment Report: 428 thousand Jobs, 3.6% Unemployment Rate
by Calculated Risk on 5/06/2022 08:41:00 AM
From the BLS:
Total nonfarm payroll employment increased by 428,000 in April, and the unemployment rate was unchanged at 3.6 percent, the U.S. Bureau of Labor Statistics reported today. Job growth was widespread, led by gains in leisure and hospitality, in manufacturing, and in transportation and warehousing.
The change in total nonfarm payroll employment for February was revised down by 36,000, from +750,000 to +714,000, and the change for March was revised down by 3,000, from +431,000 to +428,000. With these revisions, employment in February and March combined is 39,000 lower than previously reported.
emphasis added
 Click on graph for larger image.
The first graph shows the job losses from the start of the employment recession, in percentage terms.
The current employment recession was by far the worst recession since WWII in percentage terms.
However, 26 months after the onset of the current employment recession, almost all of the jobs have returned.
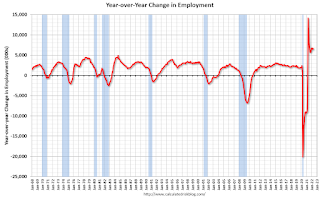 The second graph shows the year-over-year change in total non-farm employment since 1968.
In April, the year-over-year change was 6.6 million jobs. This was up significantly year-over-year.
Total payrolls increased by 428 thousand in April. Private payrolls increased by 406 thousand, and public payrolls increased 22 thousand.
Payrolls for February and March were revised down 39 thousand, combined.
The third graph shows the employment population ratio and the participation rate.
 The Labor Force Participation Rate decreased to 62.2% in April, from 62.4% in March. This is the percentage of the working age population in the labor force.
The Employment-Population ratio decreased to 60.1% from 60.0% (blue line).
I'll post the 25 to 54 age group employment-population ratio graph later.
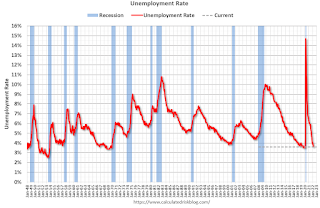 The fourth graph shows the unemployment rate.
The unemployment rate was unchanged in April at 3.6% from 3.6% in March.
This was slightly above consensus expectations; however, February and March payrolls were revised down by 39,000 combined.
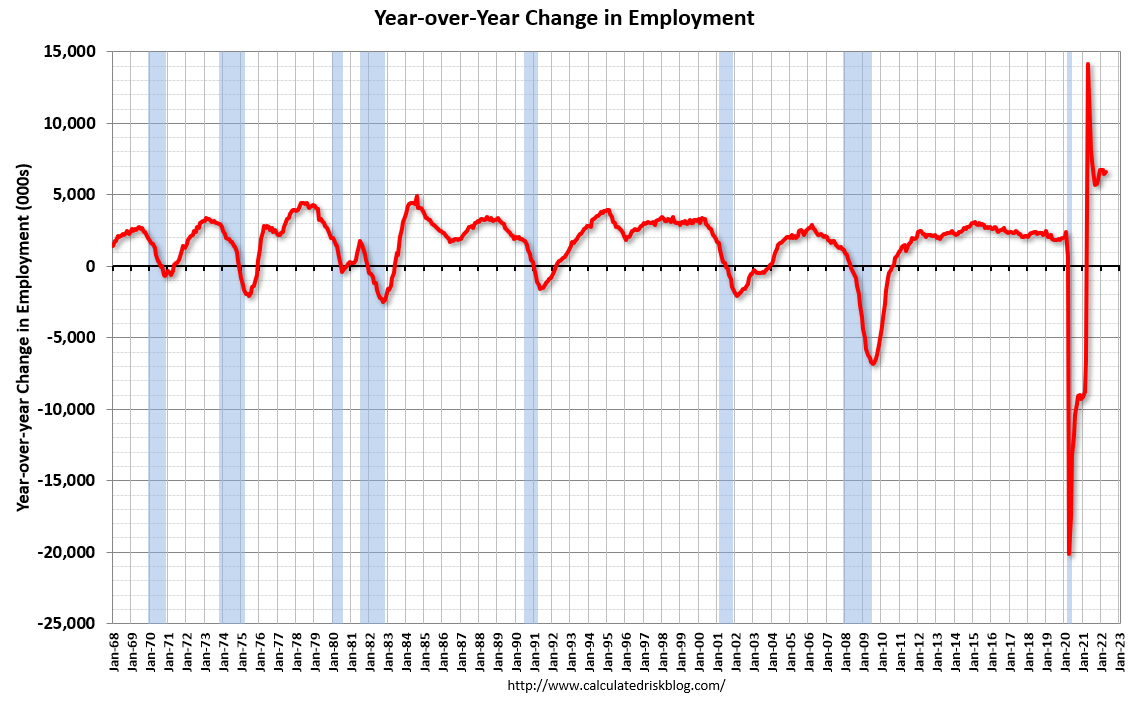 The second graph shows the year-over-year change in total non-farm employment since 1968.
In April, the year-over-year change was 6.6 million jobs. This was up significantly year-over-year.
Total payrolls increased by 428 thousand in April. Private payrolls increased by 406 thousand, and public payrolls increased 22 thousand.
Payrolls for February and March were revised down 39 thousand, combined.
The third graph shows the employment population ratio and the participation rate.
 The Labor Force Participation Rate decreased to 62.2% in April, from 62.4% in March. This is the percentage of the working age population in the labor force.
 The Employment-Population ratio decreased to 60.1% from 60.0% (blue line).
I'll post the 25 to 54 age group employment-population ratio graph later.
 The fourth graph shows the unemployment rate.
 The unemployment rate was unchanged in April at 3.6% from 3.6% in March.
This was slightly above consensus expectations; however, February and March payrolls were revised down by 39,000 combined.
I'll have more later ...
Thursday, May 05, 2022
Friday: Employment Report
by Calculated Risk on 5/05/2022 08:45:00 PM
My April Employment Preview
Goldman April Payrolls Preview
Friday:
• At 8:30 AM ET, Employment Report for April. The consensus is for 400,000 jobs added, and for the unemployment rate to be unchanged at 3.6%.
On COVID (focus on hospitalizations and deaths):
| COVID Metrics | ||||
|---|---|---|---|---|
| Now | Week Ago | Goal | ||
| Percent fully Vaccinated | 66.2% | --- | ≥70.0%1 | |
| Fully Vaccinated (millions) | 219.9 | --- | ≥2321 | |
| New Cases per Day3🚩 | 61,712 | 50,531 | ≤5,0002 | |
| Hospitalized3🚩 | 12,437 | 10,931 | ≤3,0002 | |
| Deaths per Day3🚩 | 325 | 311 | ≤502 | |
| 1 Minimum to achieve "herd immunity" (estimated between 70% and 85%). 2my goals to stop daily posts, 37-day average for Cases, Currently Hospitalized, and Deaths 🚩 Increasing 7-day average week-over-week for Cases, Hospitalized, and Deaths ✅ Goal met. | ||||
 Click on graph for larger image.
This graph shows the daily (columns) and 7-day average (line) of deaths reported.
Average daily deaths bottomed in July 2021 at 214 per day.
Goldman April Payrolls Preview
by Calculated Risk on 5/05/2022 04:39:00 PM
A few brief excerpts from a note by Goldman Sachs economist Spencer Hill:
We estimate nonfarm payrolls rose by 300k in April (mom sa), below consensus of +385k and our original forecast of +350k. While labor demand remains at elevated levels and dining activity has returned to normal, seasonally-adjusted job growth tends to slow during the spring hiring season when the labor market is tight. ...We estimate a one-tenth drop in the unemployment rate to 3.5%, reflecting a solid or strong rise in household employment partially offset by another 0.1pp rise in labor force participation to 62.5%CR Note: The consensus is for 400 thousand jobs added, and for the unemployment rate to be unchanged at 3.6%.
emphasis added
Hotels: Occupancy Rate Down 3.4% Compared to Same Week in 2019
by Calculated Risk on 5/05/2022 03:27:00 PM
From CoStar: STR: US Hotel Occupancy Increases From Previous Week
U.S. hotel occupancy improved from the previous week, while average daily rate (ADR) decreased slightly, according to STR‘s latest data through April 30.The following graph shows the seasonal pattern for the hotel occupancy rate using the four-week average.
April 24-30, 2022 (percentage change from comparable week in 2019*):
• Occupancy: 66.6% (-3.4%)
• Average daily rate (ADR): $146.67 (+10.2%)
• Revenue per available room (RevPAR): $97.72 (+6.4%)
*Due to the pandemic impact, STR is measuring recovery against comparable time periods from 2019.
emphasis added
 Click on graph for larger image.
The red line is for 2022, black is 2020, blue is the median, and dashed light blue is for 2021. Dashed purple is 2019 (STR is comparing to a strong year for hotels).
The 4-week average of the occupancy rate is at the median rate for the previous 20 years (Blue).
Note: Y-axis doesn't start at zero to better show the seasonal change.
The 4-week average of the occupancy rate will now mostly move sideways seasonally until the summer.
Lawler: Mortgage/Treasury Spreads, Part I
by Calculated Risk on 5/05/2022 12:12:00 PM
Today, in the Calculated Risk Real Estate Newsletter: Lawler: Mortgage/Treasury Spreads, Part I
A brief excerpt:
From housing economist Tom Lawler:There is much more in the article. You can subscribe at https://calculatedrisk.substack.com/
...
The most widely quoted statistic from the PMMS is the 30-year mortgage rate from the survey. Yet the survey also shows the typical/average fees/points associated with this interest rate, and these fees/points have changed dramatically over time. Below is a historical chart showing the fees/points charged along with the PMMS rate.
Click on graph for larger image.
As the chart shows, from the late 70’s to the late 90’s the average fees/points associated with the PMMS mortgage rate were substantially higher than has been the case over the last two decades. As such, the spread between the “effective” mortgage rate and the PMMS mortgage rate was considerably wider from the late 70’s to the late 90’s than has been than in the more recent decades.
...
More on this topic later. However, the fact that nominal mortgage to 10-year Treasury spreads have widened considerably this year is not surprising given other developments in fixed-income markets, and there is no reason to expect that they will revert back to some “mean” level.


