 RSS Feed
 by Calculated Risk on 4/27/2022 10:07:00 AM
Wednesday, April 27, 2022
NAR: Pending Home Sales Decreased 1.2% in March
From the NAR: Pending Home Sales Sag 1.2% in March
Pending home sales dropped in March, signifying five straight months that contract activity has declined, according to the National Association of Realtors®. Month-over-month, only the Northeast saw an increase in contract signings, while the three other major U.S. regions experienced declines in transactions. All four regions reported decreases in year-over-year contract activity.This was above expectations of a 1.8% decrease for this index. Note: Contract signings usually lead sales by about 45 to 60 days, so this would usually be for closed sales in April and May.
The Pending Home Sales Index (PHSI), a forward-looking indicator of home sales based on contract signings, fell 1.2% to 103.7 in March. Year-over-year, transactions sank 8.2%. An index of 100 is equal to the level of contract activity in 2001.
...
Month-over-month, the Northeast PHSI grew 4.0% to 89.3 in March, a 9.2% fall from a year ago. In the Midwest, the index dropped 6.1% to 94.7 last month, down 4.8% from March 2021.
Pending home sales transactions in the South decreased 0.9% to an index of 125.8 in March, down 9.5% from March 2021. The index in the West declined 0.2% in March to 89.8, down 8.4% from a year prior.
emphasis added
MBA: Mortgage Applications Decrease in Latest Weekly Survey
by Calculated Risk on 4/27/2022 07:00:00 AM
From the MBA: Mortgage Applications Decrease in Latest MBA Weekly Survey
Mortgage applications decreased 8.3 percent from one week earlier, according to data from the Mortgage Bankers Association’s (MBA) Weekly Mortgage Applications Survey for the week ending April 22, 2022.
... The Refinance Index decreased 9 percent from the previous week and was 71 percent lower than the same week one year ago. The seasonally adjusted Purchase Index decreased 8 percent from one week earlier. The unadjusted Purchase Index decreased 7 percent compared with the previous week and was 17 percent lower than the same week one year ago.
“With mortgage rates increasing last week to the highest level since 2009, applications continued to decline. Overall application activity fell to the lowest level since 2018, with both purchase and refinance applications posting declines. Refinance applications were 70 percent below the same week a year ago, when the 30-year fixed rate was in the 3-percent range,” said Joel Kan, MBA’s Associate Vice President of Economic and Industry Forecasting. “The drop in purchase applications was evident across all loan types. Prospective homebuyers have pulled back this spring, as they continue to face limited options of homes for sale along with higher costs from increasing mortgage rates and prices. The recent decrease in purchase applications is an indication of potential weakness in home sales in the coming months.”
Added Kan, “In a period of high home-price growth and rapidly increasing mortgage rates, borrowers continued to mitigate higher monthly payments by applying for ARM loans. The ARM share of applications last week was over 9 percent by loan count and 17 percent based on dollar volume. At 9 percent, the ARM share was double what it was three months ago, which also coincides with the 1.5 percentage point increase in the 30-year fixed rate.”
...
The average contract interest rate for 30-year fixed-rate mortgages with conforming loan balances ($647,200 or less) increased to 5.37 percent from 5.20 percent, with points increasing to 0.67 from 0.66 (including the origination fee) for 80 percent loan-to-value ratio (LTV) loans.
emphasis added
 Click on graph for larger image.
The first graph shows the refinance index since 1990.
With higher mortgage rates, the refinance index has declined sharply over the last several months.
The refinance index is at the lowest level since December 2018.
The second graph shows the MBA mortgage purchase index
 According to the MBA, purchase activity is down 17% year-over-year unadjusted.
Note: Red is a four-week average (blue is weekly).
Tuesday, April 26, 2022
Wednesday: Pending Home Sales, Q1 Housing Vacancies and Homeownership
by Calculated Risk on 4/26/2022 09:19:00 PM
Wednesday:
• At 7:00 AM ET, The Mortgage Bankers Association (MBA) will release the results for the mortgage purchase applications index.
• At 10:00 AM, Pending Home Sales Index for March. The consensus is for a 1.8% decrease in the index.
• Also, at 10:00 AM, the Q1 2022 Housing Vacancies and Homeownership from the Census Bureau.
On COVID (focus on hospitalizations and deaths):
| COVID Metrics | ||||
|---|---|---|---|---|
| Now | Week Ago | Goal | ||
| Percent fully Vaccinated | 66.1% | --- | ≥70.0%1 | |
| Fully Vaccinated (millions) | 219.4 | --- | ≥2321 | |
| New Cases per Day3🚩 | 47,407 | 37,471 | ≤5,0002 | |
| Hospitalized3🚩 | 10,300 | 9,791 | ≤3,0002 | |
| Deaths per Day3 | 330 | 372 | ≤502 | |
| 1 Minimum to achieve "herd immunity" (estimated between 70% and 85%). 2my goals to stop daily posts, 37-day average for Cases, Currently Hospitalized, and Deaths 🚩 Increasing 7-day average week-over-week for Cases, Hospitalized, and Deaths ✅ Goal met. | ||||
 Click on graph for larger image.
This graph shows the daily (columns) and 7-day average (line) of deaths reported.
Average daily deaths bottomed in July 2021 at 214 per day.
Lawler: More on Demographics
by Calculated Risk on 4/26/2022 04:44:00 PM
CR Note: This is from housing economist Tom Lawler. He argues that demographics are not as favorable for housing as many have argued (including myself). He also says that we shouldn't use the 2017 Vintage projections (too out of data, and too wrong).
Deaths:
The CDC recently released provisional US death data for 2021 by age group. Below is a table showing deaths by age for the past three years. The data speak for themselves.
 CR Note: The data may "speak for themselves", but look at the percentage increase in deaths for the prime age population.
A 50% increase in deaths for the 35 to 44 age group.
And almost 39% increase in deaths for the 25 to 34 age group.
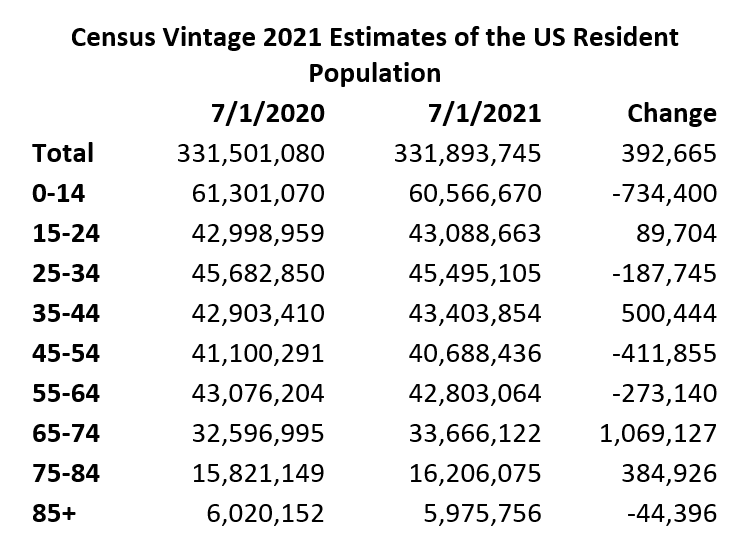
Census Vintage 2021 Population Estimates by Age
Census recently released it “Vintage 2021” estimates of the US resident population by single year of age for April 1, 2020 (Decennial Census results), July 1, 2020, and July 1, 2021. Below is a table showing the estimates for selected age groups for July 1 of the past two years.
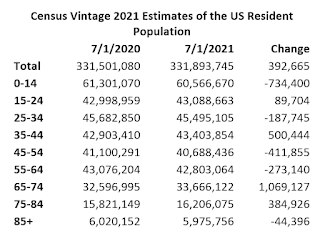
The population changes by age from July 2020 to July 2021 would, if there had been no pandemic, no plunge in mortgage rates, and no “ultra” accommodative monetary and fiscal policy, not have suggested “strong” housing demand over that period. Stated another way, if pre-pandemic headship rates by age were applied to the latest population estimates, one would have expected a very modest increase in total US households last year (for which, unfortunately, there are no timely data available, and Census has not yet released Census 2020 household data by age.)
Census previously released 2021 total population estimates showing that the US population grew at the slowest pace in over a century late last year, with the reasons for the slow growth reflecting historically low births, historically high deaths, and historically low net international migration.
It should be noted that Census has not yet released updated estimates of the US resident population for 2011 through 2019 that would reflect the results of Census 2020. These estimates will probably be higher than the currently available estimates, as Census 2020 showed a population that was about 1.8 million higher than the Vintage 2020 estimate for 4/1/2020.
It should also be noted that Census has not updated its long-term population projections to reflect both recent trends in key demographic drivers and the Census 2020 results, and the last population projections were released in 2017. Over the last four years births were significantly lower, deaths were significantly higher, and net international migration was significantly lower than the assumptions in the “Census 2017” projections. As such, those projections are of little or no value, and should not be used for any purposes.
Below is a table showing Census’ Vintage 2021 estimates of the US resident population for July 1, 2021 compared to the Census 2017 projections by 5-year age groups.
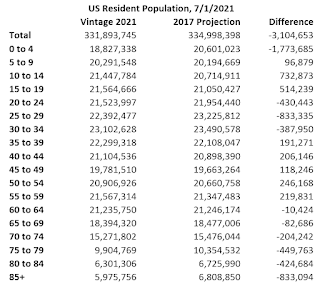
The Vintage 2021 estimate of the US resident population for July 1, 2021 was a whopping 3.1 million lower than the Census 2017 projection. While over half of this “miss” reflected massively lower than projected births, there were also significantly higher than projected deaths (even before Covid) and significantly lower net international migration. (I can’t do a full reconciliation because the Census 2017 starting point will almost certainly be higher than was assumed.)
The age distribution of the adult population in the latest population estimates is also substantially different from that projected in Census 2017 for July 1 of last year, as the table suggests, with substantially fewer 20 to 34 year olds, somewhat higher 35-59 year olds, and significantly fewer 65+ year olds.
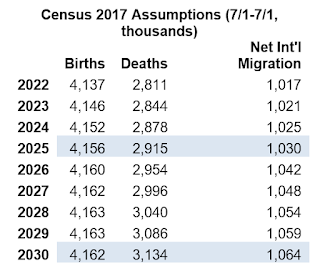 The gap between updated population estimates and the latest, extremely outdated population estimates will almost certainly widen significantly over the rest of this decade. Below are the Census 2017 assumptions for births, deaths, and net international migration for 2022 through 2030.
Obviously these assumptions are way too optimistic, especially over the next several years.
All of this, of course, is just a long-winded way of say that it is totally inappropriate to use the Census 2017 population projections for any analysis whatsoever. Hopefully Census will release a new set of population projections sometime soon, so just trying to get a handle on likely deaths over the next few years is a daunting challenge.
CR Note: I used the 2017 projections recently since those are the only ones available, although I added a caution. Hopefully Census will release better projections soon (and all the 2020 data!)
Census Vintage 2021 Population Estimates by Age
Census recently released it “Vintage 2021” estimates of the US resident population by single year of age for April 1, 2020 (Decennial Census results), July 1, 2020, and July 1, 2021. Below is a table showing the estimates for selected age groups for July 1 of the past two years.
The population changes by age from July 2020 to July 2021 would, if there had been no pandemic, no plunge in mortgage rates, and no “ultra” accommodative monetary and fiscal policy, not have suggested “strong” housing demand over that period. Stated another way, if pre-pandemic headship rates by age were applied to the latest population estimates, one would have expected a very modest increase in total US households last year (for which, unfortunately, there are no timely data available, and Census has not yet released Census 2020 household data by age.)
Census previously released 2021 total population estimates showing that the US population grew at the slowest pace in over a century late last year, with the reasons for the slow growth reflecting historically low births, historically high deaths, and historically low net international migration.
It should be noted that Census has not yet released updated estimates of the US resident population for 2011 through 2019 that would reflect the results of Census 2020. These estimates will probably be higher than the currently available estimates, as Census 2020 showed a population that was about 1.8 million higher than the Vintage 2020 estimate for 4/1/2020.
It should also be noted that Census has not updated its long-term population projections to reflect both recent trends in key demographic drivers and the Census 2020 results, and the last population projections were released in 2017. Over the last four years births were significantly lower, deaths were significantly higher, and net international migration was significantly lower than the assumptions in the “Census 2017” projections. As such, those projections are of little or no value, and should not be used for any purposes.
Below is a table showing Census’ Vintage 2021 estimates of the US resident population for July 1, 2021 compared to the Census 2017 projections by 5-year age groups.

The Vintage 2021 estimate of the US resident population for July 1, 2021 was a whopping 3.1 million lower than the Census 2017 projection. While over half of this “miss” reflected massively lower than projected births, there were also significantly higher than projected deaths (even before Covid) and significantly lower net international migration. (I can’t do a full reconciliation because the Census 2017 starting point will almost certainly be higher than was assumed.)
The age distribution of the adult population in the latest population estimates is also substantially different from that projected in Census 2017 for July 1 of last year, as the table suggests, with substantially fewer 20 to 34 year olds, somewhat higher 35-59 year olds, and significantly fewer 65+ year olds.
 The gap between updated population estimates and the latest, extremely outdated population estimates will almost certainly widen significantly over the rest of this decade. Below are the Census 2017 assumptions for births, deaths, and net international migration for 2022 through 2030.
Obviously these assumptions are way too optimistic, especially over the next several years.
All of this, of course, is just a long-winded way of say that it is totally inappropriate to use the Census 2017 population projections for any analysis whatsoever. Hopefully Census will release a new set of population projections sometime soon, so just trying to get a handle on likely deaths over the next few years is a daunting challenge.
CR Note: I used the 2017 projections recently since those are the only ones available, although I added a caution. Hopefully Census will release better projections soon (and all the 2020 data!)
March New Home Sales: Little Completed Inventory, High Number of Homes Under Construction
by Calculated Risk on 4/26/2022 12:16:00 PM
Today, in the Calculated Risk Real Estate Newsletter: March New Home Sales: Little Completed Inventory, High Number of Homes Under Construction
Brief excerpt:
The next graph shows new home sales for 2021 and 2022 by month (Seasonally Adjusted Annual Rate). Sales in March 2022 were down 12.6% from March 2021.You can subscribe at https://calculatedrisk.substack.com/.
The year-over-year comparisons will be easier going forward.
...
And on prices, from the Census Bureau:The median sales price of new houses sold in March 2022 was $436,700. The average sales price was $523,900.The following graph shows the median and average new home prices. Overall home prices are up sharply year-over-year.
During the housing bust, the builders had to build smaller and less expensive homes to compete with all the distressed sales. When housing started to recovery - with limited finished lots in recovering areas - builders moved to higher price points to maximize profits.
Then the average and median house prices mostly moved sideways since 2017 due to home builders offering more lower priced homes. Prices really picked up during the pandemic.
The average price in March 2022 was $523,900 up 26% year-over-year. The median price was $436,700, up 21% year-over-year.


Comments on February Case-Shiller and FHFA House Price Increases; New Record Monthly Increase
by Calculated Risk on 4/26/2022 10:35:00 AM
Today, in the Calculated Risk Real Estate Newsletter: Case-Shiller National Index up 19.8% Year-over-year in February; New Record Monthly Increase
Excerpt:
This graph below shows existing home months-of-supply (inverted, from the NAR) vs. the seasonally adjusted month-to-month price change in the Case-Shiller National Index (both since January 1999 through February 2022).
Note that the months-of-supply is not seasonally adjusted.
There is a clear relationship, and this is no surprise (but interesting to graph). If months-of-supply is high, prices decline. If months-of-supply is very low (like now), prices rise quickly.
In February, the months-of-supply was at 1.7 months, and the Case-Shiller National Index (SA) increased 1.90% month-over-month. The black arrow points to the February 2022 dot. In the March existing home sales report, the NAR reported months-of-supply increased to 2.0 months.
My sense is the Case-Shiller National annual growth rate of 19.99% in August 2021 was probably the peak YoY growth rate, although this was close! Since the normal level of inventory is probably in the 4 to 6 months range - we’d have to see a significant increase in inventory to sharply slow price increases, and that is why I’m focused on inventory!
Since Case-Shiller is a 3-month average, and this report was for February (includes December and January), this included price increases when mortgage rates were significantly lower than today. In December, the Freddie Mac PMMS averaged 3.1% for a 30-year mortgage, and 3.4% in January. Currently mortgage rates are around 5.32%.
Note: I’ll have more on real prices, price-to-rent and affordability tomorrow. emphasis added

There is much more in the article. You can subscribe at https://calculatedrisk.substack.com/
New Home Sales decrease to 763,000 Annual Rate in March
by Calculated Risk on 4/26/2022 10:09:00 AM
The Census Bureau reports New Home Sales in March were at a seasonally adjusted annual rate (SAAR) of 763 thousand.
The previous three months were revised up sharply.
Sales of new single‐family houses in March 2022 were at a seasonally adjusted annual rate of 763,000, according to estimates released jointly today by the U.S. Census Bureau and the Department of Housing and Urban Development. This is 8.6 percent below the revised February rate of 835,000 and is 12.6 percent below the March 2021 estimate of 873,000.
emphasis added
 Click on graph for larger image.
The first graph shows New Home Sales vs. recessions since 1963. The dashed line is the current sales rate.
New home sales are now declining year-over-year since sales soared following the first few months of the pandemic.
The second graph shows New Home Months of Supply.
 The months of supply increased in March to 6.4 months from 5.6 months in February.
 The all-time record high was 12.1 months of supply in January 2009. The all-time record low was 3.5 months, most recently in October 2020.
This is above the top of the normal range (about 4 to 6 months of supply is normal).
"The seasonally‐adjusted estimate of new houses for sale at the end of March was 407,000. This represents a supply of 6.4 months at the current sales rate"
 The last graph shows sales NSA (monthly sales, not seasonally adjusted annual rate).
In March 2022 (red column), 72 thousand new homes were sold (NSA). Last year, 83 thousand homes were sold in March.
The all-time high for March was 127 thousand in 2005, and the all-time low for March was 28 thousand in 2011.
This was below expectations, however sales in the three previous months were revised up sharply. I'll have more later today.
Case-Shiller: National House Price Index increased 19.8% year-over-year in February
by Calculated Risk on 4/26/2022 09:16:00 AM
S&P/Case-Shiller released the monthly Home Price Indices for February ("February" is a 3-month average of December, January and February prices).
This release includes prices for 20 individual cities, two composite indices (for 10 cities and 20 cities) and the monthly National index.
From S&P: S&P Corelogic Case-Shiller Index Shows Annual Home Price Gains Increased To 19.8% In February
The S&P CoreLogic Case-Shiller U.S. National Home Price NSA Index, covering all nine U.S. census divisions, reported a 19.8% annual gain in February, up from 19.1% in the previous month. The 10-City Composite annual increase came in at 18.6%, up from 17.3% in the previous month. The 20-City Composite posted a 20.2% year-over-year gain, up from 18.9% in the previous month.
Phoenix, Tampa, and Miami reported the highest year-over-year gains among the 20 cities in February. Phoenix led the way with a 32.9% year-over-year price increase, followed by Tampa with a 32.6% increase and Miami with a 29.7% increase. All 20 cities reported higher price increases in the year ending February 2022 versus the year ending January 2022.
...
Before seasonal adjustment, the U.S. National Index posted a 1.7% month-over-month increase in February, while the 10-City and 20-City Composites both posted increases of 2.4%.
After seasonal adjustment, the U.S. National Index posted a month-over-month increase of 1.9%, and the 10-City and 20-City Composites both posted increases of 2.3% and 2.4%, respectively.
In February, all 20 cities reported increases before and after seasonal adjustments.
“U.S. home prices continued to advance at a very rapid pace in February,” says Craig J. Lazzara, Managing Director at S&P DJI. “The National Composite Index recorded a gain of 19.8% for the 12 months ended February 2022; the 10- and 20-City Composites rose 18.6% and 20.2%, respectively.All three composites reflect an acceleration of price growth relative to January’s level.
...
“The macroeconomic environment is evolving rapidly and may not support extraordinary home price growth for much longer. The post-COVID resumption of general economic activity has stoked inflation, and the Federal Reserve has begun to increase interest rates in response. We may soon begin to see the impact of increasing mortgage rates on home prices.”
emphasis added
 Click on graph for larger image.
 The first graph shows the nominal seasonally adjusted Composite 10, Composite 20 and National indices (the Composite 20 was started in January 2000).
The Composite 10 index is up 2.3% in February (SA).
The Composite 20 index is up 2.4% (SA) in February.
The National index is 57% above the bubble peak (SA), and up 1.9% (SA) in February. The National index is up 112% from the post-bubble low set in February 2012 (SA).
 The second graph shows the year-over-year change in all three indices.
The Composite 10 SA is up 18.6% year-over-year. The Composite 20 SA is up 20.2% year-over-year.
The National index SA is up 19.8% year-over-year.
Price increases were above expectations. I'll have more later.
Monday, April 25, 2022
Tuesday: New Home Sales, Case-Shiller House Prices, Durable Goods, Richmond Fed Mfg
by Calculated Risk on 4/25/2022 09:15:00 PM
From Matthew Graham at Mortgage News Daily: Mortgage Rates Regain Most of What They Lost Late Last Week
Thursday and Friday weren't great days for the mortgage market last week. ... One business day later, and lenders are closer to territory from the first 3 days of last week. This is roughly an eighth of a percentage point lower than Friday's rates fore most lenders (i.e. 5.375% instead of 5.5%). As always, these rates may not apply to every scenario and the best way to use this data is for the purpose of tracking day-over-day changes. [30 year fixed 5.32%]Tuesday:
emphasis added
• At 8:30 AM ET, Durable Goods Orders for March from the Census Bureau. The consensus is for a 1.0% increase in durable goods orders.
• At 9:00 AM, S&P/Case-Shiller House Price Index for February. The consensus is for a 18.4% year-over-year increase in the Comp 20 index for February.
• Also at 9:00 AM, FHFA House Price Index for February. This was originally a GSE only repeat sales, however there is also an expanded index.
• At 10:00 AM, New Home Sales for March from the Census Bureau. The consensus is for 762 thousand SAAR, down from 772 thousand in February.
• Also at 10:00 AM, Richmond Fed Survey of Manufacturing Activity for April.
On COVID (focus on hospitalizations and deaths):
| COVID Metrics | ||||
|---|---|---|---|---|
| Now | Week Ago | Goal | ||
| Percent fully Vaccinated | 66.1% | --- | ≥70.0%1 | |
| Fully Vaccinated (millions) | 219.4 | --- | ≥2321 | |
| New Cases per Day3🚩 | 44,416 | 36,209 | ≤5,0002 | |
| Hospitalized3 | 9,518 | 9,754 | ≤3,0002 | |
| Deaths per Day3 | 314 | 362 | ≤502 | |
| 1 Minimum to achieve "herd immunity" (estimated between 70% and 85%). 2my goals to stop daily posts, 37-day average for Cases, Currently Hospitalized, and Deaths 🚩 Increasing 7-day average week-over-week for Cases, Hospitalized, and Deaths ✅ Goal met. | ||||
 Click on graph for larger image.
This graph shows the daily (columns) and 7-day average (line) of deaths reported.
Average daily deaths bottomed in July 2021 at 214 per day.
Freddie Mac: Mortgage Serious Delinquency Rate decreased in March
by Calculated Risk on 4/25/2022 04:35:00 PM
Freddie Mac reported that the Single-Family serious delinquency rate in March was 0.92%, down from 0.99% February. Freddie's rate is down year-over-year from 2.34% in March 2021.
Freddie's serious delinquency rate peaked in February 2010 at 4.20% following the housing bubble and peaked at 3.17% in August 2020 during the pandemic.
These are mortgage loans that are "three monthly payments or more past due or in foreclosure".
 Click on graph for larger image
Mortgages in forbearance are being counted as delinquent in this monthly report but are not reported to the credit bureaus.
This is very different from the increase in delinquencies following the housing bubble. Lending standards have been fairly solid over the last decade, and most of these homeowners have equity in their homes - and they will be able to restructure their loans once (if) they are employed.
The serious delinquency rate was at 0.60% just prior to the pandemic - almost back.


