 RSS Feed
 by Calculated Risk on 4/26/2022 04:44:00 PM
Tuesday, April 26, 2022
Lawler: More on Demographics
CR Note: This is from housing economist Tom Lawler. He argues that demographics are not as favorable for housing as many have argued (including myself). He also says that we shouldn't use the 2017 Vintage projections (too out of data, and too wrong).
Deaths:
The CDC recently released provisional US death data for 2021 by age group. Below is a table showing deaths by age for the past three years. The data speak for themselves.
 CR Note: The data may "speak for themselves", but look at the percentage increase in deaths for the prime age population.
A 50% increase in deaths for the 35 to 44 age group.
And almost 39% increase in deaths for the 25 to 34 age group.
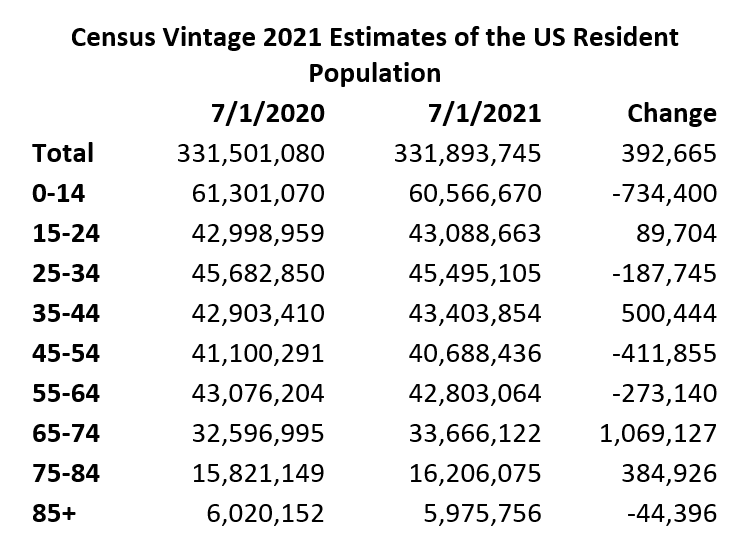
Census Vintage 2021 Population Estimates by Age
Census recently released it “Vintage 2021” estimates of the US resident population by single year of age for April 1, 2020 (Decennial Census results), July 1, 2020, and July 1, 2021. Below is a table showing the estimates for selected age groups for July 1 of the past two years.
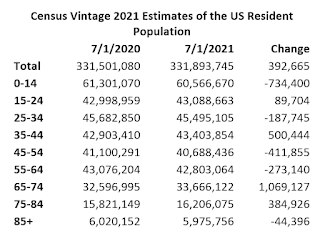
The population changes by age from July 2020 to July 2021 would, if there had been no pandemic, no plunge in mortgage rates, and no “ultra” accommodative monetary and fiscal policy, not have suggested “strong” housing demand over that period. Stated another way, if pre-pandemic headship rates by age were applied to the latest population estimates, one would have expected a very modest increase in total US households last year (for which, unfortunately, there are no timely data available, and Census has not yet released Census 2020 household data by age.)
Census previously released 2021 total population estimates showing that the US population grew at the slowest pace in over a century late last year, with the reasons for the slow growth reflecting historically low births, historically high deaths, and historically low net international migration.
It should be noted that Census has not yet released updated estimates of the US resident population for 2011 through 2019 that would reflect the results of Census 2020. These estimates will probably be higher than the currently available estimates, as Census 2020 showed a population that was about 1.8 million higher than the Vintage 2020 estimate for 4/1/2020.
It should also be noted that Census has not updated its long-term population projections to reflect both recent trends in key demographic drivers and the Census 2020 results, and the last population projections were released in 2017. Over the last four years births were significantly lower, deaths were significantly higher, and net international migration was significantly lower than the assumptions in the “Census 2017” projections. As such, those projections are of little or no value, and should not be used for any purposes.
Below is a table showing Census’ Vintage 2021 estimates of the US resident population for July 1, 2021 compared to the Census 2017 projections by 5-year age groups.
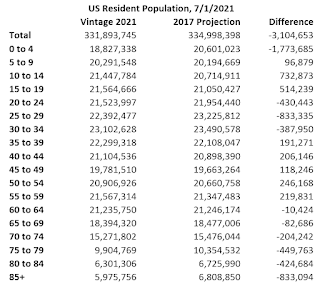
The Vintage 2021 estimate of the US resident population for July 1, 2021 was a whopping 3.1 million lower than the Census 2017 projection. While over half of this “miss” reflected massively lower than projected births, there were also significantly higher than projected deaths (even before Covid) and significantly lower net international migration. (I can’t do a full reconciliation because the Census 2017 starting point will almost certainly be higher than was assumed.)
The age distribution of the adult population in the latest population estimates is also substantially different from that projected in Census 2017 for July 1 of last year, as the table suggests, with substantially fewer 20 to 34 year olds, somewhat higher 35-59 year olds, and significantly fewer 65+ year olds.
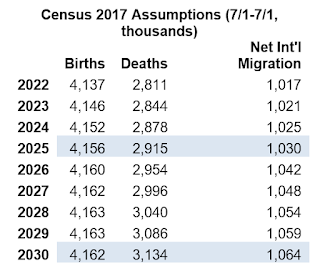 The gap between updated population estimates and the latest, extremely outdated population estimates will almost certainly widen significantly over the rest of this decade. Below are the Census 2017 assumptions for births, deaths, and net international migration for 2022 through 2030.
Obviously these assumptions are way too optimistic, especially over the next several years.
All of this, of course, is just a long-winded way of say that it is totally inappropriate to use the Census 2017 population projections for any analysis whatsoever. Hopefully Census will release a new set of population projections sometime soon, so just trying to get a handle on likely deaths over the next few years is a daunting challenge.
CR Note: I used the 2017 projections recently since those are the only ones available, although I added a caution. Hopefully Census will release better projections soon (and all the 2020 data!)
Census Vintage 2021 Population Estimates by Age
Census recently released it “Vintage 2021” estimates of the US resident population by single year of age for April 1, 2020 (Decennial Census results), July 1, 2020, and July 1, 2021. Below is a table showing the estimates for selected age groups for July 1 of the past two years.
The population changes by age from July 2020 to July 2021 would, if there had been no pandemic, no plunge in mortgage rates, and no “ultra” accommodative monetary and fiscal policy, not have suggested “strong” housing demand over that period. Stated another way, if pre-pandemic headship rates by age were applied to the latest population estimates, one would have expected a very modest increase in total US households last year (for which, unfortunately, there are no timely data available, and Census has not yet released Census 2020 household data by age.)
Census previously released 2021 total population estimates showing that the US population grew at the slowest pace in over a century late last year, with the reasons for the slow growth reflecting historically low births, historically high deaths, and historically low net international migration.
It should be noted that Census has not yet released updated estimates of the US resident population for 2011 through 2019 that would reflect the results of Census 2020. These estimates will probably be higher than the currently available estimates, as Census 2020 showed a population that was about 1.8 million higher than the Vintage 2020 estimate for 4/1/2020.
It should also be noted that Census has not updated its long-term population projections to reflect both recent trends in key demographic drivers and the Census 2020 results, and the last population projections were released in 2017. Over the last four years births were significantly lower, deaths were significantly higher, and net international migration was significantly lower than the assumptions in the “Census 2017” projections. As such, those projections are of little or no value, and should not be used for any purposes.
Below is a table showing Census’ Vintage 2021 estimates of the US resident population for July 1, 2021 compared to the Census 2017 projections by 5-year age groups.

The Vintage 2021 estimate of the US resident population for July 1, 2021 was a whopping 3.1 million lower than the Census 2017 projection. While over half of this “miss” reflected massively lower than projected births, there were also significantly higher than projected deaths (even before Covid) and significantly lower net international migration. (I can’t do a full reconciliation because the Census 2017 starting point will almost certainly be higher than was assumed.)
The age distribution of the adult population in the latest population estimates is also substantially different from that projected in Census 2017 for July 1 of last year, as the table suggests, with substantially fewer 20 to 34 year olds, somewhat higher 35-59 year olds, and significantly fewer 65+ year olds.
 The gap between updated population estimates and the latest, extremely outdated population estimates will almost certainly widen significantly over the rest of this decade. Below are the Census 2017 assumptions for births, deaths, and net international migration for 2022 through 2030.
Obviously these assumptions are way too optimistic, especially over the next several years.
All of this, of course, is just a long-winded way of say that it is totally inappropriate to use the Census 2017 population projections for any analysis whatsoever. Hopefully Census will release a new set of population projections sometime soon, so just trying to get a handle on likely deaths over the next few years is a daunting challenge.
CR Note: I used the 2017 projections recently since those are the only ones available, although I added a caution. Hopefully Census will release better projections soon (and all the 2020 data!)


