 RSS Feed
 by Calculated Risk on 6/11/2021 02:07:00 PM
Friday, June 11, 2021
Minnesota Real Estate in May: Sales Up 15% YoY, Inventory Down 51% YoY
Note: I'm tracking data for many local markets around the U.S. I think it is especially important to watch inventory this year.
From the Minnesota Realtors®:
Total Residential Units Sold in May 2021 were 7,982, up 14.5% from 6,971 in May 2020.
Active Residential Listings in May 2021 were 8,953, down 50.5% from 18,074 in May 2020.
Months of Supply was 1.1 Months in May 2021, compared to 2.6 Months in May 2020.
 Click on graph for larger image.
This graph from the Minnesota Realtors® shows inventory in Minnesota since 2012. Inventory had been trending down, and then was somewhat flat for a few years, and then declined significantly during the pandemic.
Colorado Real Estate in May: Sales Up 58% YoY, Inventory Down 69% YoY
by Calculated Risk on 6/11/2021 01:32:00 PM
Note: Remember sales were weak in April and May 2020 due to the pandemic, so the YoY comparison is easy. I'm tracking data for many local markets around the U.S. I think it is especially important to watch inventory this year.
From the Colorado Association of REALTORS® for the entire state:
Closed sales for Single Family and Townhouse-Condo in May 2021 were 11,128, up 58.3% from 7,029 in May 2020.
Active Listings for Single Family and Townhouse-Condo in May 2021 were 7,034, down 69.4% from 23,060 in May 2020.
Inventory in May was down 10.6% from last month.
Months of Supply was 0.6 Months in May 2021, compared to 2.5 Months in May 2020.
Charlotte Region Real Estate in May: Sales Up 26% YoY, Inventory Down 62% YoY
by Calculated Risk on 6/11/2021 11:29:00 AM
Note: Remember sales were weak in April and May 2020 due to the pandemic. I'm tracking data for many local markets around the U.S. I think it is especially important to watch inventory this year.
For the Charlotte Region:
Closed sales in May 2021 were 4,784, up 26.4% from 3,785 in May 2020.
Active Listings in May 2021 were 3,104, down 62.0% from 8,177 in May 2020.
Inventory in May was up 2.8% from last month.
Months of Supply was 0.6 Months in May 2021, compared to 1.9 Months in May 2020.
Q2 GDP Forecasts: Around 9.5%
by Calculated Risk on 6/11/2021 11:22:00 AM
From Merrill Lynch:
2Q GDP tracking has fallen to 9.5% qoq saar from 11% as we incorporate our forecast for retail sales. 1Q GDP is also tracking slightly lower at 6.2% following trade data this week. [June 11 estimate]From Goldman Sachs:
emphasis added
We left our Q2 GDP tracking estimate unchanged at +9.5% (qoq ar). [June 9 estimate]From the NY Fed Nowcasting Report
The New York Fed Staff Nowcast stands at 4.2% for 2021:Q2 and 5.3% for 2021:Q3. [June 11 estimate]And from the Altanta Fed: GDPNow
The GDPNow model estimate for real GDP growth (seasonally adjusted annual rate) in the second quarter of 2021 is 9.3 percent on June 9, down from 9.4 percent on June 8. [June 9 estimate]
Atlanta Real Estate in May: Sales Up 36% YoY, Inventory Down 61% YoY
by Calculated Risk on 6/11/2021 10:33:00 AM
Note: Remember, sales were weak in April and May last year, so the year-over-year comparison is especially strong this month. I'm tracking data for many local markets around the U.S. I think it is especially important to watch inventory this year.
From the GAMLS for Atlanta:
Total Residential Units Sold in May 2021 were 9,066, up 36.1% from 6,662 in May 2020.
Active Residential Listings in May 2021 were 7,530, down 61.1% from 19,352 in May 2020. Inventory was up 8.1% from 6,964 last month.
Months of Supply was 0.86 Months in May 2021, compared to 2.53 Months in May 2020.
 Click on graph for larger image.
This graph from the Georgia MLS shows inventory in Atlanta over the last several years - and the sharp decline in inventory at the start of the pandemic.
Inventory in Atlanta was above the record low in April 2021.
Black Knight: Number of Homeowners in COVID-19-Related Forbearance Plans Decreased
by Calculated Risk on 6/11/2021 08:47:00 AM
Note: Both Black Knight and the MBA (Mortgage Bankers Association) are putting out weekly estimates of mortgages in forbearance.
This data is as of June 8th.
From Andy Walden at Black Knight: Share of Borrowers in Forbearance Falls Below 4%, Lowest Since Onset of Pandemic
Forbearance volumes fell by 61,000 (-2.9%) from last week to this week, continuing the trend of early month declines in forbearance volumes. Declines were seen across all investor classes, with portfolio/PLS loans seeing the largest improvement (-33K), while FHA/VA (-19K) and GSE (-9k) forbearances also saw meaningful declines.
Plan starts did rise this week, following the Memorial Day-shortened week, but remain relatively low, considering. For the second week in a row, more than 100,000 homeowners left their forbearance plans, with roughly one-third of loan reviews for extension or removal resulting in removals.
Some 530,000 plans are still scheduled for quarterly reviews for extension/removal over the next three weeks, which could lead to additional plan exits as we near the July 4 holiday.
Click on graph for larger image.
Fewer than 4% of all mortgage-holders are now in forbearance, the first time since the onset of the pandemic this number has fallen so low.
As of June 8, 2.06 million (3.9% of) homeowners remain in COVID-19-related forbearance plans, including 2.3% of GSE, 6.9% of FHA/VA and 4.4% of portfolio/PLS loans.
emphasis added

Portland Real Estate in May: Sales Up 62% YoY, Inventory Down 49% YoY
by Calculated Risk on 6/11/2021 08:11:00 AM
Note: Remember sales were weak in April and May 2020 due to the pandemic. I'm tracking data for many local markets around the U.S. I think it is especially important to watch inventory this year.
For Portland, OR:
Closed sales in May 2021 were 3,183, up 62.1% from 1,963 in May 2020.
Active Listings in May 2021 were 2,339, down 48.6% from 4,551 in May 2020.
Inventory in May was up 5.3% from last month.
Months of Supply was 0.7 Months in May 2021, compared to 2.3 Months in May 2020.
Thursday, June 10, 2021
June 10th COVID-19 New Cases, Vaccinations, Hospitalizations
by Calculated Risk on 6/10/2021 06:09:00 PM
This data is from the CDC.
According to the CDC, on Vaccinations.
Total doses administered: 305,687,618, as of yesterday 304,753,476. Daily: 0.93 million.
| COVID Metrics | |||
|---|---|---|---|
| Current | Yesterday | Goal | |
| Percent over 18, One Dose | 64.0% | 63.9% | ≥70.0%1,2 |
| Fully Vaccinated (millions) | 141.6 | 141.0 | ≥1601 |
| New Cases per Day3 | 13,996 | 14,311 | ≤5,0002 |
| Hospitalized3 | 16,142 | 16,532 | ≤3,0002 |
| Deaths per Day3 | 347 | 354 | ≤502 |
| 1 America's Goal by July 4th, 2my goals to stop daily posts, 37 day average for Cases, Hospitalized, and Deaths | |||
KUDOS to the residents of the 13 states that have already achieved the 70% goal: Vermont, Hawaii and Massachusetts are at 80%+, and Connecticut, Maine, New Jersey, Rhode Island, Pennsylvania, New Mexico, New Hampshire, California, Maryland, and Washington are all over 70%.
Next up are D.C. at 69.4%, New York at 69.2%, Illinois at 68.9%, Virginia at 68.6%, Minnesota at 68.3%, Delaware at 67.7%, Colorado at 67.4% and Oregon at 67.2%.
 Click on graph for larger image.
This graph shows the daily (columns) and 7 day average (line) of positive tests reported.
This data is from the CDC.
Hotels: Occupancy Rate Down 14% Compared to Same Week in 2019
by Calculated Risk on 6/10/2021 02:25:00 PM
Note: The year-over-year occupancy comparisons are easy, since occupancy declined sharply at the onset of the pandemic. So STR is comparing to the same week in 2019.
The occupancy rate is down 14.0% compared to the same week in 2019.
U.S. weekly hotel performance remained relatively flat from the previous week but still reached pandemic-era highs, according to STR‘s latest data through June 5.The following graph shows the seasonal pattern for the hotel occupancy rate using the four week average.
May 30 through June 5, 2021 (percentage change from comparable week in 2019*):
• Occupancy: 61.9% (-14.0%)
• Average daily rate (ADR): US$123.49 (-6.7%)
• Revenue per available room (RevPAR): US$76.44 (-19.7%)
Each of the three key performance metrics were the highest of the pandemic era.
emphasis added
 Click on graph for larger image.
The red line is for 2021, black is 2020, blue is the median, dashed purple is 2019, and dashed light blue is for 2009 (the worst year on record for hotels prior to 2020).
Occupancy is now above the horrible 2009 levels and weekend occupancy (leisure) has leisure has been solid.
Note: Y-axis doesn't start at zero to better show the seasonal change.
Note: Y-axis doesn't start at zero to better show the seasonal change.
Fed's Flow of Funds: Household Net Worth Increased $5.0 Trillion in Q1
by Calculated Risk on 6/10/2021 12:31:00 PM
The Federal Reserve released the Q1 2021 Flow of Funds report today: Financial Accounts of the United States.
The net worth of households and nonprofits rose to $136.9 trillion during the first quarter of 2021. The value of directly and indirectly held corporate equities increased $3.2 trillion and the value of real estate increased $1.0 trillion.
Household debt increased 6.5 percent at an annual rate in the first quarter of 2021. Consumer credit grew at an annual rate of 3 percent, while mortgage debt (excluding charge-offs) grew at an annual rate of 5.4 percent.
 Click on graph for larger image.
The first graph shows Households and Nonprofit net worth as a percent of GDP.
With the sharp decline in GDP in Q2, net worth as a percent of GDP increased sharply. This reversed somewhat in Q3 as GDP bounced back (even as net worth increased). But now net worth as a percent of GDP is at an all time high.
This includes real estate and financial assets (stocks, bonds, pension reserves, deposits, etc) net of liabilities (mostly mortgages). Note that this does NOT include public debt obligations.
 This graph shows homeowner percent equity since 1952.
Household percent equity (as measured by the Fed) collapsed when house prices fell sharply in 2007 and 2008.
In Q1 2021, household percent equity (of household real estate) was at 67.3% - up from 66.7% in Q4.
Note: about 30.3% of owner occupied households had no mortgage debt as of April 2010. So the approximately 50+ million households with mortgages have less than 67.3% equity - and about 1.4 million homeowners still have negative equity.
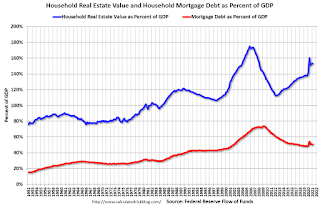 The third graph shows household real estate assets and mortgage debt as a percent of GDP. Note this graph was impacted by the sharp decline in Q2 GDP.
Mortgage debt increased by $117 billion in Q1.
Mortgage debt is still down from the peak during the housing bubble, and, as a percent of GDP is at 50.0% - down from Q4 - and down from a peak of 73.5% of GDP during the housing bubble.
The value of real estate, as a percent of GDP, increased in Q1, and is above the average of the last 30 years.
 This graph shows homeowner percent equity since 1952.
 Household percent equity (as measured by the Fed) collapsed when house prices fell sharply in 2007 and 2008.
In Q1 2021, household percent equity (of household real estate) was at 67.3% - up from 66.7% in Q4.
Note: about 30.3% of owner occupied households had no mortgage debt as of April 2010. So the approximately 50+ million households with mortgages have less than 67.3% equity - and about 1.4 million homeowners still have negative equity.
 The third graph shows household real estate assets and mortgage debt as a percent of GDP. Note this graph was impacted by the sharp decline in Q2 GDP.
Mortgage debt increased by $117 billion in Q1.
Mortgage debt is still down from the peak during the housing bubble, and, as a percent of GDP is at 50.0% - down from Q4 - and down from a peak of 73.5% of GDP during the housing bubble.
The value of real estate, as a percent of GDP, increased in Q1, and is above the average of the last 30 years.


