 RSS Feed
 by Calculated Risk on 4/23/2021 05:03:00 PM
Friday, April 23, 2021
April 23rd COVID-19 Vaccinations, New Cases, Hospitalizations
Note: I'm looking forward to not posting this daily! I've been posting this data daily for over a year, and I'll stop once all three of these criteria are met:
1) 70% of the population over 18 has had at least one dose of vaccine,
2) new cases are under 5,000 per day, and
3) hospitalizations are below 3,000.
According to the CDC, 222.3 million doses have been administered. 35.2% of the population over 18 is fully vaccinated, and 52.6% of the population over 18 has had at least one dose (135.7 million people over 18 have had at least one dose).
And check out COVID Act Now to see how each state is doing.
Over 15,000 US deaths were reported so far in April due to COVID.
 Click on graph for larger image.
This graph shows the daily (columns) 7 day average (line) of positive tests reported.
Note: The ups and downs during the Winter surge were related to reporting delays due to the Thanksgiving and Christmas holidays.
This data is from the CDC.
 Click on graph for larger image.
This graph shows the daily (columns) 7 day average (line) of positive tests reported.
Note: The ups and downs during the Winter surge were related to reporting delays due to the Thanksgiving and Christmas holidays.
This data is from the CDC.
The 7-day average is 61,303, down from 62,596 yesterday, and down from the recent peak of 69,878 on April 13, 2021. This is also below the summer surge peak of 67,337 on July 23, 2020.
The second graph shows the number of people hospitalized.
 This data is also from the CDC.
The CDC cautions that due to reporting delays, the area in grey will probably increase.
The second graph shows the number of people hospitalized.
 This data is also from the CDC.
The CDC cautions that due to reporting delays, the area in grey will probably increase.
The current 7-day average is 38,683, up from 38,541 reported yesterday, and well above the post-summer surge low of 23,000.
April Vehicle Sales Forecast: "Remain Strong"
by Calculated Risk on 4/23/2021 04:46:00 PM
From WardsAuto: April U.S. Light-Vehicle Sales Steadfastly Remain Strong (pay content)
 Click on graph for larger image.
This graph shows actual sales from the BEA (Blue), and Wards forecast for April (Red).
The Wards forecast of 17.9 million SAAR, would be up less than 1% from last month, and up 105% from a year ago (sales collapsed in March 2020).
Q1 GDP Forecasts: Around 7%
by Calculated Risk on 4/23/2021 11:56:00 AM
Q1 GDP will be released this coming Thursday. The consensus is for real GDP to increase 6.5%, quarter-over-quarter, on a Seasonally Adjusted Annual Rate (SAAR) basis.
Note that the forecasts of the automated systems (based on released data), have caught up with the forecasts of economists, as data for March is released.
From Merrill Lynch:
From Merrill Lynch:
We expect the advance estimate of 1Q 2021 GDP to show an acceleration in growth to an eye-popping 6.5% qoq saar from 4.1% in 4Q 2020 [Apr 23 estimate]From Goldman Sachs:
emphasis added
We left our Q1 GDP tracking estimate unchanged at +7.5% (qoq ar). [Apr 23 estimate]From the NY Fed Nowcasting Report
The New York Fed Staff Nowcast stands at 6.9% for 2021:Q1 and 4.6% for 2021:Q2. [Apr 23 estimate]And from the Altanta Fed: GDPNow
The GDPNow model estimate for real GDP growth (seasonally adjusted annual rate) in the first quarter of 2021 is 8.3 percent on April 16 [Apr 16 estimate]
A few Comments on March New Home Sales
by Calculated Risk on 4/23/2021 10:40:00 AM
New home sales for March were reported at 1,021,000 on a seasonally adjusted annual rate basis (SAAR). Sales for the previous three months were revised up significantly.
This was well above consensus expectations for March and the highest sales rate since 2006.
Clearly low mortgages rates, low existing home supply, and favorable demographics have boosted sales. A surging stock market has probably helped new home sales too.
Earlier: New Home Sales Increase to 1,021,000 Annual Rate in March; Highest Since 2006.
 Click on graph for larger image.
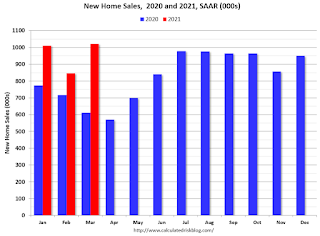
This graph shows new home sales for 2020 and 2021 by month (Seasonally Adjusted Annual Rate).
The year-over-year comparisons are easy in the first half of 2021 - especially in March and April.
However, sales will likely be down year-over-year in August through October - since the selling season was delayed in 2020.
And on inventory: note that completed inventory (3rd graph in previous post) is at record lows, but inventory under construction is closer to normal.
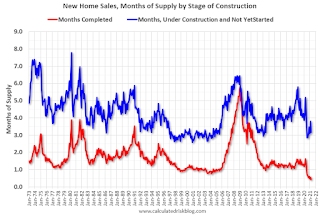 This graph shows the months of supply by stage of construction.
The inventory of completed homes for sale was at 37 thousand in March tying the record low of 37 thousand in 2013 (when sales were much lower). That is about 0.4 months of completed supply (record low).
Earlier: New Home Sales Increase to 1,021,000 Annual Rate in March; Highest Since 2006.
 Click on graph for larger image.
This graph shows new home sales for 2020 and 2021 by month (Seasonally Adjusted Annual Rate).
The year-over-year comparisons are easy in the first half of 2021 - especially in March and April.
However, sales will likely be down year-over-year in August through October - since the selling season was delayed in 2020.
And on inventory: note that completed inventory (3rd graph in previous post) is at record lows, but inventory under construction is closer to normal.
 This graph shows the months of supply by stage of construction.
The inventory of completed homes for sale was at 37 thousand in March tying the record low of 37 thousand in 2013 (when sales were much lower). That is about 0.4 months of completed supply (record low).
The inventory of new homes under construction, and not started, is about 3.2 months - at the low end of normal.
New Home Sales Increase to 1,021,000 Annual Rate in March; Highest Since 2006
by Calculated Risk on 4/23/2021 10:16:00 AM
The Census Bureau reports New Home Sales in March were at a seasonally adjusted annual rate (SAAR) of 1.021 million.
The previous three months were revised up sharply.
Sales of new single-family houses in March 2021 were at a seasonally adjusted annual rate of 1,021,000, according to estimates released jointly today by the U.S. Census Bureau and the Department of Housing and Urban Development. This is 20.7 percent above the revised February rate of 846,000 and is 66.8 percent above the March 2020 estimate of 612,000.
emphasis added
 Click on graph for larger image.
The first graph shows New Home Sales vs. recessions since 1963. The dashed line is the current sales rate.
This was the highest sales rate since 2006.
The second graph shows New Home Months of Supply.
 The months of supply decreased in March to 3.6 months from 4.4 months in February.
 The all time record high was 12.1 months of supply in January 2009. The all time record low is 3.5 months, most recently in October 2020.
This is below the low end of the normal range (about 4 to 6 months supply is normal).
"The seasonally-adjusted estimate of new houses for sale at the end of March was 307,000. This represents a supply of 3.6 months at the current sales rate."
 On inventory, according to the Census Bureau:
 "A house is considered for sale when a permit to build has been issued in permit-issuing places or work has begun on the footings or foundation in nonpermit areas and a sales contract has not been signed nor a deposit accepted."Starting in 1973 the Census Bureau broke this down into three categories: Not Started, Under Construction, and Completed.
The third graph shows the three categories of inventory starting in 1973.
The inventory of completed homes for sale is at a record low, and the combined total of completed and under construction is a little lower than normal.
 The last graph shows sales NSA (monthly sales, not seasonally adjusted annual rate).
In March 2021 (red column), 97 thousand new homes were sold (NSA). Last year, 59 thousand homes were sold in March.
The all time high for March was 127 thousand in 2005, and the all time low for March was 28 thousand in 2011.
This was well above expectations, and sales in the three previous months were revised up sharply. I'll have more later today.
Black Knight: Number of Homeowners in COVID-19-Related Forbearance Plans Decreased Slightly
by Calculated Risk on 4/23/2021 08:24:00 AM
Note: Both Black Knight and the MBA (Mortgage Bankers Association) are putting out weekly estimates of mortgages in forbearance.
This data is as of April 20th.
From Black Knight: Another Week of Forbearance Improvement; 4.4% Of Homeowners Remain in Pandemic-Related Plans
Forbearance volumes improved this week, edging slightly lower since last week. This is typical of the mid-month lulls in improvement we’ve seen throughout the recovery.The number of loans in forbearance continues to decline.
Weekly reductions of GSE loans (-6,000) and FHA/VA loans (-5,000) were partially offset by an increase of 9,000 portfolio and privately securitized mortgages in forbearance.
Despite the week’s modest improvement, the number of outstanding plans is down by 298,000 (-11.4%) from the same time last month. As of April 20, there are 2.3 million (4.4% of) mortgage-holders in COVID-19-related forbearance plans, including 2.7% of GSE, 7.8% of FHA/VA and 4.8% of portfolio/PLS loans.
Click on graph for larger image.
Both inflow and outflow were muted this week, with fewer than 160,000 extensions/removals, the lowest such number in two months.
280,000 expirations remain on the books for April, an opportunity for additional improvement through the rest of this month and going into May. There are also 435,000 expirations due in May, and then a big jump to 890,000 due in June. This will mark the last big month for review activity before the first wave of plans reach their 18-month expirations.
Overall start activity continues to trend downward. It will be worth keeping an eye on the numbers going into May as servicers continue to work through their reviews. We’ll have another report published here next Friday, April 30.
emphasis added

Thursday, April 22, 2021
Friday: New Home Sales
by Calculated Risk on 4/22/2021 09:00:00 PM
Friday:
• At 10:00 AM: New Home Sales for March from the Census Bureau. The consensus is for 885 thousand SAAR, up from 775 thousand in February.
April 22nd COVID-19 Vaccinations, New Cases, Hospitalizations
by Calculated Risk on 4/22/2021 04:02:00 PM
Note: I'm looking forward to not posting this daily! I've been posting this data daily for over a year, and I'll stop once all three of these criteria are met:
1) 70% of the population over 18 has had at least one dose of vaccine,
2) new cases are under 5,000 per day, and
3) hospitalizations are below 3,000.
According to the CDC, 218.9 million doses have been administered. 34.4% of the population over 18 is fully vaccinated, and 52.0% of the population over 18 has had at least one dose (134.3 million people over 18 have had at least one dose).
And check out COVID Act Now to see how each state is doing.
Almost 14,500 US deaths were reported so far in April due to COVID.
 Click on graph for larger image.
This graph shows the daily (columns) 7 day average (line) of positive tests reported.
Note: The ups and downs during the Winter surge were related to reporting delays due to the Thanksgiving and Christmas holidays.
This data is from the CDC.
 Click on graph for larger image.
This graph shows the daily (columns) 7 day average (line) of positive tests reported.
Note: The ups and downs during the Winter surge were related to reporting delays due to the Thanksgiving and Christmas holidays.
This data is from the CDC.
The 7-day average is 62,595, down from 64,243 yesterday, and down from the recent peak of 69,878 on April 13, 2021. This is also below the summer surge peak of 67,337 on July 23, 2020.
The second graph shows the number of people hospitalized.
 This data is also from the CDC.
The CDC cautions that due to reporting delays, the area in grey will probably increase.
The second graph shows the number of people hospitalized.
 This data is also from the CDC.
The CDC cautions that due to reporting delays, the area in grey will probably increase.
The current 7-day average is 38,541, up from 38,414 reported yesterday, and well above the post-summer surge low of 23,000.
Hotels: Occupancy Rate Down 13% Compared to Same Week in 2019
by Calculated Risk on 4/22/2021 01:12:00 PM
Note: The year-over-year occupancy comparisons are easy, since occupancy declined sharply at the onset of the pandemic. However, occupancy is still down significantly from normal levels.
The occupancy rate is down 13% compared to the same week in 2019.
From CoStar: STR: US Hotel Occupancy Dips From Previous Week
U.S. weekly hotel occupancy fell 2.6 percentage points from the previous week, according to STR‘s latest data through April 17.For more, see STR's U.S. Market Recovery Monitor
April 11-17, 2021:
• Occupancy: 57.3%
• Average daily rate (ADR): US$107.16
• Revenue per available room (RevPAR): US$61.37
Following the end of spring break, weekly demand fell back below the 22 million mark, and occupancy dipped to its lowest level since mid-March. The ADR level was also US$5 less after two straight weeks above US$112.
emphasis added
The following graph shows the seasonal pattern for the hotel occupancy rate using the four week average.
 Click on graph for larger image.
The red line is for 2021, black is 2020, blue is the median, and dashed light blue is for 2009 (the worst year since the Great Depression for hotels prior to 2020).
Occupancy is now above the horrible 2009 levels.
Note: Y-axis doesn't start at zero to better show the seasonal change.
Note: Y-axis doesn't start at zero to better show the seasonal change.
Comments on March Existing Home Sales
by Calculated Risk on 4/22/2021 11:36:00 AM
Earlier: NAR: Existing-Home Sales Decreased to 6.01 million in March
A few key points:
1) This was the highest sales rate for March since 2006, and the 4th highest sales rate for March on record (behind 2004, 2005, and 2006). Some of the increase over the last nine months was probably related to record low mortgage rates, a move away from multi-family rentals, strong second home buying (to escape the high-density cities), a strong stock market and favorable demographics.
Also, the delay in the 2020 buying season pushed the seasonally adjusted number to very high levels over the winter. This means there are going to be some difficult comparisons in the second half of 2021!
2) Inventory is very low, and was down 28.2% year-over-year (YoY) in March. Also, as housing economist Tom Lawler has noted, the local MLS data shows even a larger decline in active inventory (the NAR appears to include some pending sales in inventory). Lawler noted:
"As I’ve noted before, the inventory measure in most publicly-released local realtor/MLS reports excludes listings with pending contracts, but that is not the case for many of the reports sent to the NAR (referred to as the “NAR Report!”), Since the middle of last Spring inventory measures excluding pending listings have fallen much more sharply than inventory measures including such listings, and this latter inventory measure understates the decline in the effective inventory of homes for sale over the last several months."
It seems likely that active inventory is down close to 50% year-over-year.
3) As usual, housing economist Tom Lawler's forecast was closer to the NAR report than the Consensus. The NAR reported 6.01 million SAAR, Lawler estimated the NAR would report 6.02 million SAAR, and the consensus was 6.17 million SAAR.
 Click on graph for larger image.
This graph shows existing home sales by month for 2020 and 2021.
The year-over-year comparisons will be easy in Q2, and then difficult in the second half of the year.
The second graph shows existing home sales for each month, Not Seasonally Adjusted (NSA), since 2005.
 Sales NSA in March (484,000) were 16.3% above sales last year in March (416,000).
This was the highest sales for March (NSA) since 2006.


