 RSS Feed
 by Calculated Risk on 4/22/2021 10:12:00 AM
Thursday, April 22, 2021
NAR: Existing-Home Sales Decreased to 6.01 million in March
From the NAR: Housing Market Reaches Record-High Home Price and Gains in March
Existing-home sales fell in March, marking two consecutive months of declines, according to the National Association of Realtors®. The month of March saw record-high home prices and gains. While each of the four major U.S. regions experienced month-over-month drops, all four areas welcomed year-over-year gains in home sales.Note: February was revised up from 6.22 million to 6.24 million SAAR.
Total existing-home sales, completed transactions that include single-family homes, townhomes, condominiums and co-ops, decreased 3.7% from February to a seasonally-adjusted annual rate of 6.01 million in March. Sales overall climbed year-over-year, up 12.3% from a year ago (5.35 million in March 2020).
...
Total housing inventory at the end of March amounted to 1.07 million units, up 3.9% from February's inventory and down 28.2% from one year ago (1.49 million). Unsold inventory sits at a 2.1-month supply at the current sales pace, marginally up from February's 2.0-month supply and down from the 3.3-month supply recorded in March 2020. Inventory numbers continue to represent near-historic lows; NAR first began tracking the single-family home supply in 1982.
emphasis added
 Click on graph for larger image.
This graph shows existing home sales, on a Seasonally Adjusted Annual Rate (SAAR) basis since 1993.
Sales in March (6.01 million SAAR) were down 3.7% from last month, and were 12.3% above the March 2020 sales rate.
The second graph shows nationwide inventory for existing homes.
 According to the NAR, inventory increased to 1.07 million in March from 1.03 million in February. Headline inventory is not seasonally adjusted, and inventory usually decreases to the seasonal lows in December and January, and peaks in mid-to-late summer.
The last graph shows the year-over-year (YoY) change in reported existing home inventory and months-of-supply. Since inventory is not seasonally adjusted, it really helps to look at the YoY change. Note: Months-of-supply is based on the seasonally adjusted sales and not seasonally adjusted inventory.
 Inventory was down 28.2% year-over-year in March compared to March 2020.
 Months of supply increased to 2.1 months in March from 2.0 months in February.
This was below the consensus forecast. I'll have more later.
Black Knight: National Mortgage Delinquency Rate Decreased Sharply in March
by Calculated Risk on 4/22/2021 08:41:00 AM
Note: Loans in forbearance are counted as delinquent in this survey, but those loans are not reported as delinquent to the credit bureaus.
From Black Knight: Black Knight’s First Look: National Mortgage Delinquency Rate Plunges Nearly a Full Percentage Point in March as Calendar and Economy Drive Improvement
• The national delinquency rate fell to 5.02% from 6.00% in February – a 16.4% decline – driven by a combination of economic and calendar-related tailwindsAccording to Black Knight's First Look report, the percent of loans delinquent decreased 16.4% in March compared to February, and increased 48% year-over-year.
• Over the past 20 years, delinquencies have fallen by nearly 10% on average in March due to tax return and other seasonal funds being used by homeowners to pay down past-due mortgage debt
• The decline was stronger than usual due to both January and February ending on Sunday – which tends to dampen performance and lead to following-month gains – as well as broader economic improvements
• Despite March’s strong performance, some 1.9 million mortgage-holders – including those in active forbearance – are at least 90 days past due on payments
• There are 1.5 million more such serious delinquencies than at the onset of the pandemic, nearly five times pre-pandemic levels
• Active foreclosures fell to yet another record low in March due to widespread moratoriums and forbearance utilization limiting both foreclosure inflow and outflow
• Prepayments rose by 17% in March to the highest level in more than 17 years driven by a seasonal rise in home sales alongside a rise in refinance activity locked in before rates began to rise in mid-February
emphasis added
The percent of loans in the foreclosure process decreased 3.6% in March and were down 27% over the last year.
Black Knight reported the U.S. mortgage delinquency rate (loans 30 or more days past due, but not in foreclosure) was 5.02% in March, down from 6.00% in February.
The percent of loans in the foreclosure process decreased in March to 0.30%, from 0.32% in February.
The number of delinquent properties, but not in foreclosure, is up 880,000 properties year-over-year, and the number of properties in the foreclosure process is down 58,000 properties year-over-year.
| Black Knight: Percent Loans Delinquent and in Foreclosure Process | ||||
|---|---|---|---|---|
| Mar 2021 | Feb 2021 | Mar 2020 | Mar 2019 | |
| Delinquent | 5.02% | 6.00% | 3.39% | 3.65% |
| In Foreclosure | 0.30% | 0.32% | 0.42% | 0.51% |
| Number of properties: | ||||
| Number of properties that are delinquent, but not in foreclosure: | 2,672,000 | 3,186,000 | 1,792,000 | 1,903,000 |
| Number of properties in foreclosure pre-sale inventory: | 162,000 | 168,000 | 220,000 | 264,000 |
| Total Properties | 2,834,000 | 3,354,000 | 2,013,000 | 2,167,000 |
Weekly Initial Unemployment Claims decreased to 547,000
by Calculated Risk on 4/22/2021 08:37:00 AM
The DOL reported:
In the week ending April 17, the advance figure for seasonally adjusted initial claims was 547,000, a decrease of 39,000 from the previous week's revised level. This is the lowest level for initial claims since March 14, 2020 when it was 256,000. The previous week's level was revised up by 10,000 from 576,000 to 586,000. The 4-week moving average was 651,000, a decrease of 27,750 from the previous week's revised average. This is the lowest level for this average since March 14, 2020 when it was 225,500. The previous week's average was revised down by 4,250 from 683,000 to 678,750.This does not include the 133,319 initial claims for Pandemic Unemployment Assistance (PUA) that was up from 131,721 the previous week.
emphasis added
The following graph shows the 4-week moving average of weekly claims since 1971.
 Click on graph for larger image.
The dashed line on the graph is the current 4-week average. The four-week average of weekly unemployment claims decreased to 651,000.
The previous week was revised up.
Regular state continued claims decreased to 3,674,000 (SA) from 3,708,000 (SA) the previous week.
Note: There are an additional 7,309,604 receiving Pandemic Unemployment Assistance (PUA) that increased from 7,044,376 the previous week (there are questions about these numbers). This is a special program for business owners, self-employed, independent contractors or gig workers not receiving other unemployment insurance. And an additional 5,605,935 receiving Pandemic Emergency Unemployment Compensation (PEUC) up from 5,158,231.
Weekly claims were much lower than the consensus forecast.
Wednesday, April 21, 2021
Thursday: Unemployment Claims, Existing Home Sales
by Calculated Risk on 4/21/2021 09:00:00 PM
Thursday:
• At 8:30 AM ET, The initial weekly unemployment claims report will be released. The consensus is for a increase to 625 thousand from 576 thousand last week.
• Also at 8:30 AM, Chicago Fed National Activity Index for March. This is a composite index of other data.
• At 10:00 AM, Existing Home Sales for March from the National Association of Realtors (NAR). The consensus is for 6.17 million SAAR, down from 6.22 million. Housing economist Tom Lawler expects the NAR to report sales of 6.02 million SAAR for March.
• At 11:00 AM, the Kansas City Fed manufacturing survey for April.
Homebuilder Comments in Mid-April: Crazy Price Increases, Offers Way Over Ask, Costs Increasing Quickly
by Calculated Risk on 4/21/2021 06:07:00 PM
Some twitter comments from Rick Palacios Jr., Director of Research at John Burns Real Estate Consulting
Some interesting housing color from mid-April around the country home builder channel check. Bunch of market commentary to follow...will try to hit most top markets.
#SaltLakeCity home builder mid-April color: “Still have 10x buyers to available homes to buy. Went to 'highest/ best' offer system March 1st & offers over asking price are shocking. Most offers are 10+% over ask, that's after raised base prices $10K to $20K+ with each release.”
#Austin home builder mid-April color: “Super high demand. Volume controlled with release process, otherwise would be unbearable. Some price increases are $100K between releases.”
#Dallas home builder mid-April color: “Limiting sales in 100% of communities. Can’t sell ahead as costs are rising too quickly. We may stop selling and become a spec builder until costs stabilize.”
#Houston home builder mid-April color: “Increasing prices 2% to 3% a month to keep up with costs.”
#LasVegas home builder mid-April color: “Only selling homes under construction, no dirt sales due to the variability of construction costs. Waiting lists at pretty much every community and restricting investors.”
#Phoenix home builder mid-April color: “Continue restricting sales but priority lists are increasing and buyers seem accustomed to the rising prices and are still anxious to move forward. Price increases each week/each release.”
#Denver home builder mid-April color: “Doing price increases twice a month.”
#RaleighDurham home builder mid-April color: “Opening 4 new neighborhoods and seeing tremendous pre-sale interest (checks, etc… prior to us releasing prices).”
#Nashville home builder mid-April color: “Limiting most of our sales to inventory releases when a home is through the framing stage where a reasonably accurate delivery date can be given.”
#Charlotte home builder mid-April color: “Capping sales at 4 per month for each community, which is frustrating customers. Finished lots are golden.”
#RiversideSanBernardino home builder mid-April color: “Anyone walking in is a buyer. There are no looky-loos. Raising prices at an obscene level.”
#OrangeCounty home builder mid-April color: “Raising prices materially each sales phase release. It’s crazy, but so are our costs. Many of the homes are being bought by investors.”
#Seattle home builder mid-April color: “We have monthly price increases per community. All have escalators in multiple offers we are getting, ranging from $20k to $200k over list price. Offer reviews are pushing pricing beyond our list price by 10% or more.”
#Portland home builder mid-April color: “Can’t price them high enough…they’re selling anyway…for now, at least.”
#Boise home builder mid-April color: “Restricting sales until closer to homes being finished.”
#DC home builder mid-April color: “Increasing prices pretty much everywhere.”
#Boston home builder mid-April color: “When homes are released, they go almost immediately. Sales as strong as I can remember. Pushing price on every release with no resistance.”
#SanJose home builder mid-April color: “Running out of inventory. Sales remain strong, starting to hold back releases until construction can catch up.”
#EastBayCA home builder mid-April color: “Swamped right now. Still seeing a lot of traffic, increases prices and totally sold out with very little (if any) inventory.”
#Indianapolis home builder mid-April color: “Traffic down slightly from March but still well over our normal volume. Restricting sales as demand is still really strong. Stopped taking VIPs because list of interested buyers is longer than the number of lots we have.”
#Chicago home builder mid-April color: “Concern about the overpaying and that when Covid settles down there could be some big hits taken.”
#WestPalmBeach home builder mid-April color: “Sales are still strong although it feels like pricing has peaked, too soon to tell. In certain locations our increases have finally started to slow sales from the frenetic pace.”
#Jacksonville home builder mid-April color: “Sales are restricted to 85% of neighborhoods. Drawings for lots and highest/best offers are some of methods used to select buyers. Continue raising prices, no differences among segments.”
#Jacksonville & #Orlando home builder mid-April color: “Seeing investors back in play in some of our markets. Sales caps in many communities but not all markets yet.”
#Naples & #Sarasota home builder mid-April color: “We dramatically restricted sales in order to keep up with our backlog. Our slowdown is intentional.”
#Orlando, #Jacksonville, #Tampa home builder mid-April color: “Some of our competitors have closed models to traffic or will not release homes until they get past a certain stage.”
#Tampa home builder mid-April color: “We will likely turn off sales early again this month.” THE END
April 21st COVID-19 Vaccinations, New Cases, Hospitalizations
by Calculated Risk on 4/21/2021 04:20:00 PM
Note: I'm looking forward to not posting this daily! I've been posting this data daily for over a year, and I'll stop once all three of these criteria are met:
1) 70% of the population over 18 has had at least one dose of vaccine,
2) new cases are under 5,000 per day, and
3) hospitalizations are below 3,000.
According to the CDC, 216.0 million doses have been administered. 33.8% of the population over 18 is fully vaccinated, and 51.5% of the population over 18 has had at least one dose (133.0 million people over 18 have had at least one dose).
And check out COVID Act Now to see how each state is doing.
Almost 13,500 US deaths were reported so far in April due to COVID.
 Click on graph for larger image.
This graph shows the daily (columns) 7 day average (line) of positive tests reported.
Note: The ups and downs during the Winter surge were related to reporting delays due to the Thanksgiving and Christmas holidays.
This data is from the CDC.
 Click on graph for larger image.
This graph shows the daily (columns) 7 day average (line) of positive tests reported.
Note: The ups and downs during the Winter surge were related to reporting delays due to the Thanksgiving and Christmas holidays.
This data is from the CDC.
The 7-day average is 64,144, down from 66,824 yesterday, and below the summer surge peak of 67,337 on July 23, 2020.
The second graph shows the number of people hospitalized.
 This data is also from the CDC.
The CDC cautions that due to reporting delays, the area in grey will probably increase.
The second graph shows the number of people hospitalized.
 This data is also from the CDC.
The CDC cautions that due to reporting delays, the area in grey will probably increase.
The current 7-day average is 38,414, up from 38,185, reported yesterday, and well above the post-summer surge low of 23,000.
Philly Fed: State Coincident Indexes Increased in 49 States in March
by Calculated Risk on 4/21/2021 02:36:00 PM
From the Philly Fed:
The Federal Reserve Bank of Philadelphia has released the coincident indexes for the 50 states for March 2021. Over the past three months, the indexes increased in 49 states and decreased in one state, for a three-month diffusion index of 96. Additionally, in the past month, the indexes increased in 49 states and decreased in one state, for a one-month diffusion index of 96. For comparison purposes, the Philadelphia Fed has also developed a similar coincident index for the entire United States. The Philadelphia Fed’s U.S. index increased 1.6 percent over the past three months and 0.6 percent in March. .Note: These are coincident indexes constructed from state employment data. An explanation from the Philly Fed:
emphasis added
The coincident indexes combine four state-level indicators to summarize current economic conditions in a single statistic. The four state-level variables in each coincident index are nonfarm payroll employment, average hours worked in manufacturing by production workers, the unemployment rate, and wage and salary disbursements deflated by the consumer price index (U.S. city average). The trend for each state’s index is set to the trend of its gross domestic product (GDP), so long-term growth in the state’s index matches long-term growth in its GDP.
 Click on map for larger image.
Here is a map of the three month change in the Philly Fed state coincident indicators. This map was all red during the worst of the Pandemic and also at the worst of the Great Recession.
The map is almost all positive on a three month basis.
Source: Philly Fed.
 And here is a graph is of the number of states with one month increasing activity according to the Philly Fed.
 This graph includes states with minor increases (the Philly Fed lists as unchanged).
In March, 49 states had increasing activity.
In March, 49 states had increasing activity.
DOT: Vehicle Miles Driven decreased 10.6% year-over-year in February
by Calculated Risk on 4/21/2021 12:23:00 PM
This will be something to watch as the economy recovers.
The Department of Transportation (DOT) reported:
Travel on all roads and streets changed by -12.1% (-28.3 billion vehicle miles) for February 2021 as compared with February 2020. Travel for the month is estimated to be 205.4 billion vehicle miles.
The seasonally adjusted vehicle miles traveled for February 2021 is 245.9 billion miles, a -10.6% (-29.1 billion vehicle miles) decline from February 2020. It also represents -0.4% decline (-1.1 billion vehicle miles) compared with January 2021.
Cumulative Travel for 2021 changed by -11.7% (-56.7 billion vehicle miles). The cumulative estimate for the year is 428.7 billion vehicle miles of travel.
emphasis added
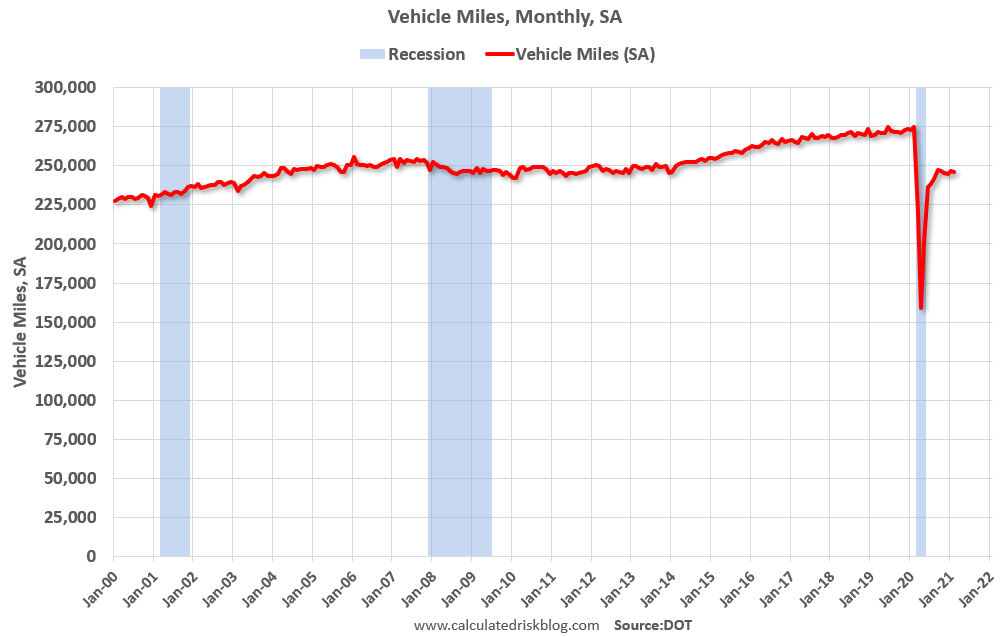 Click on graph for larger image.
This graph shows the monthly total vehicle miles driven, seasonally adjusted.
Miles driven declined during the great recession, and the rolling 12 months stayed below the previous peak for a record 85 months.
Miles driven declined sharply in March, and really collapsed in April. After partially recovering fairly quickly, miles driven have been mostly flat for the last 6+ months.
AIA: "Demand for Architecture design services continues to rapidly escalate" in March
by Calculated Risk on 4/21/2021 10:37:00 AM
Note: This index is a leading indicator primarily for new Commercial Real Estate (CRE) investment.
From the AIA: Demand for design services continues to rapidly escalate
Strengthening to a score not seen since pre-Great Recession, the Architecture Billings Index (ABI) logged its second positive mark since the beginning of the pandemic, according to a new report today from The American Institute of Architects (AIA).
AIA’s ABI score for March rose to 55.6 compared to 53.3 in February (any score above 50 indicates an increase in billings). Scores for both new projects inquiries and new design contracts strengthened to 66.9 and 55.7 respectively. March also marked the first time in three years all building sectors and regions posted positive scores.
“As business activity at architecture firms moves sharply toward recovery, it is very encouraging to simultaneously see such positive indicators of future project work increasing in the pipeline,” said AIA Chief Economist, Kermit Baker, Hon. AIA, PhD. “The activity architecture firms are seeing is a positive bellwether not only for the construction outlook, but also for the larger economy.”
...
• Regional averages: Midwest (56.5); South (55.8); West (52.8); Northeast (50.8)
• Sector index breakdown: commercial/industrial (57.0); mixed practice (54.9); institutional (54.4); multi-family residential (52.6)
emphasis added
 Click on graph for larger image.
This graph shows the Architecture Billings Index since 1996. The index was at 55.6 in March, up from 53.3 in February. Anything above 50 indicates expansion in demand for architects' services.
Note: This includes commercial and industrial facilities like hotels and office buildings, multi-family residential, as well as schools, hospitals and other institutions.
This index had been below 50 for eleven consecutive months, but has been solidly positive for the last two months.
The eleven months of decline represented a significant decrease in design services, and suggests a decline in CRE investment through most of 2021 (This usually leads CRE investment by 9 to 12 months), however we might see a pickup in CRE investment towards the end of the 2021.
MBA: Mortgage Applications Increase in Latest Weekly Survey
by Calculated Risk on 4/21/2021 07:00:00 AM
From the MBA: Mortgage Applications Increase in Latest MBA Weekly Survey
Mortgage applications increased 8.6 percent from one week earlier, according to data from the Mortgage Bankers Association’s (MBA) Weekly Mortgage Applications Survey for the week ending April 16, 2021.
... The Refinance Index increased 10 percent from the previous week and was 23 percent lower than the same week one year ago. The seasonally adjusted Purchase Index increased 6 percent from one week earlier. The unadjusted Purchase Index increased 7 percent compared with the previous week and was 57 percent higher than the same week one year ago.
“Mortgage rates dropped to their lowest levels in around two months, prompting a small resurgence in refinance activity after six weeks of declines. Borrowers acted on the decrease in rates for most loan types, with both conventional and government refinance applications showing gains,” said Joel Kan, MBA’s Associate Vice President of Economic and Industry Forecasting. “The spring housing market also saw a boost from lower rates, with purchase applications – driven by a jump in conventional applications – increasing over 5 percent. MBA expects the purchase market to remain strong, with the recovering job market and supportive demographics fueling housing demand in the months ahead.”
Added Kan, “The average loan size for purchase applications increased after a few weeks of declines, as fewer homes available for sale make for a competitive buying market that is accelerating home-price growth.”
...
The average contract interest rate for 30-year fixed-rate mortgages with conforming loan balances ($548,250 or less) decreased to 3.20 percent from 3.27 percent, with points increasing to 0.36 from 0.33 (including the origination fee) for 80 percent loan-to-value ratio (LTV) loans.
emphasis added
 Click on graph for larger image.
The first graph shows the refinance index since 1990.
With low rates, the index remains elevated, but below recent levels since mortgage rates have moved up from the record lows.
The second graph shows the MBA mortgage purchase index
 According to the MBA, purchase activity is up 57% year-over-year unadjusted.
Note: Until the 2nd half of May, the MBA index will be up sharply year-over-year since purchase activity collapsed in late March 2020 in the early weeks of the pandemic.
Note: Red is a four-week average (blue is weekly).


