 RSS Feed
 by Calculated Risk on 4/23/2021 10:40:00 AM
Friday, April 23, 2021
A few Comments on March New Home Sales
New home sales for March were reported at 1,021,000 on a seasonally adjusted annual rate basis (SAAR). Sales for the previous three months were revised up significantly.
This was well above consensus expectations for March and the highest sales rate since 2006.
Clearly low mortgages rates, low existing home supply, and favorable demographics have boosted sales. A surging stock market has probably helped new home sales too.
Earlier: New Home Sales Increase to 1,021,000 Annual Rate in March; Highest Since 2006.
 Click on graph for larger image.
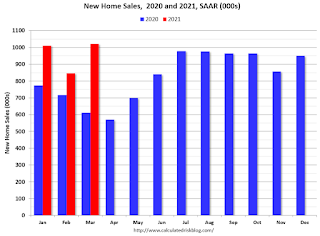
This graph shows new home sales for 2020 and 2021 by month (Seasonally Adjusted Annual Rate).
The year-over-year comparisons are easy in the first half of 2021 - especially in March and April.
However, sales will likely be down year-over-year in August through October - since the selling season was delayed in 2020.
And on inventory: note that completed inventory (3rd graph in previous post) is at record lows, but inventory under construction is closer to normal.
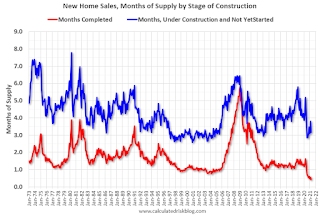 This graph shows the months of supply by stage of construction.
The inventory of completed homes for sale was at 37 thousand in March tying the record low of 37 thousand in 2013 (when sales were much lower). That is about 0.4 months of completed supply (record low).
Earlier: New Home Sales Increase to 1,021,000 Annual Rate in March; Highest Since 2006.
 Click on graph for larger image.
This graph shows new home sales for 2020 and 2021 by month (Seasonally Adjusted Annual Rate).
The year-over-year comparisons are easy in the first half of 2021 - especially in March and April.
However, sales will likely be down year-over-year in August through October - since the selling season was delayed in 2020.
And on inventory: note that completed inventory (3rd graph in previous post) is at record lows, but inventory under construction is closer to normal.
 This graph shows the months of supply by stage of construction.
The inventory of completed homes for sale was at 37 thousand in March tying the record low of 37 thousand in 2013 (when sales were much lower). That is about 0.4 months of completed supply (record low).
The inventory of new homes under construction, and not started, is about 3.2 months - at the low end of normal.


