by Calculated Risk on 3/27/2020 09:09:00 AM
Friday, March 27, 2020
Personal Income increased 0.6% in February, Spending increased 0.2%, Core PCE increase 0.2%
The BEA released the Personal Income and Outlays report for February:
Personal income increased $106.8 billion (0.6 percent) in February according to estimates released today by the Bureau of Economic Analysis. Disposable personal income (DPI) increased $88.7 billion (0.5 percent) and personal consumption expenditures (PCE) increased $27.7 billion (0.2 percent).The February PCE price index increased 1.8 percent year-over-year and the February PCE price index, excluding food and energy, increased 1.8 percent year-over-year.
Real DPI inincreased 0.4 percent in February and Real PCE increased 0.1 percent. The PCE price index increased 0.1 percent. Excluding food and energy, the PCE price index increased 0.2 percent
The increase in personal income was above expectations, and the increase in PCE was below expectations.
Note that core PCE inflation was at expectations.
This was prior to the COVID-19 crisis.
Thursday, March 26, 2020
Friday: Personal Income & Outlays
by Calculated Risk on 3/26/2020 07:50:00 PM
If you want to track the cases (and tests) in your state over time, check out COVID-19 Case Statistics by State. Just click on the state of interest.
Consumer sentiment might be interesting tomorrow. (something I don't watch closely). Personal income & outlays is for February (pre-crisis).
Friday:
• At 8:30 AM ET, Personal Income and Outlays, February. The consensus is for a 0.4% increase in personal income, and for a 0.3% increase in personal spending. And for the Core PCE price index to increase 0.2%.
• At 10:00 AM, University of Michigan's Consumer sentiment index (Final for March). The consensus is for a reading of 94.0.
• At 10:00 AM, State Employment and Unemployment (Monthly), February 2020
March 26 Update: US COVID-19 Tests per Day #TestAndTrace
by Calculated Risk on 3/26/2020 05:35:00 PM
Tests per day is a key number to track (along with actual cases and, sadly, deaths). But total tests were a key for South Korea slowing the spread of COVID-19. South Korea has been conducting 15,000 to 20,000 tests per day with a 51 million population, so the US needs to test around 130,000 per day.
The US reported 146,044 tests in the last 24 hours. Some of these were probably late reports.
Note: About 12% of tests were positive in the most recent report (some are still pending). However in some states, private labs aren't reporting the number of negative results, so this percentage may be high.
It would be helpful if there was a national reporting system for total tests and positive and negative results. Apparently, new legislation includes this reporting.

This data is from the COVID Tracking Project.
States are improving their reporting.
If testing can be maintained at this level, then that might be sufficient for test-and-trace.
Test. Test. Test. But protect our healthcare workers first!
Freddie Mac: Mortgage Serious Delinquency Rate Unchanged in February
by Calculated Risk on 3/26/2020 05:15:00 PM
Freddie Mac reported that the Single-Family serious delinquency rate in February was 0.60%, unchanged from 0.60% in January. Freddie's rate is down from 0.69% in February 2019.
This matches January as the lowest delinquency rate since November 2007.
Freddie's serious delinquency rate peaked in February 2010 at 4.20%.
These are mortgage loans that are "three monthly payments or more past due or in foreclosure".

This is close to a cycle bottom. However, with COVID-19, this rate will probably increase in a few months (it takes time since these are mortgage three months or more past due).
Note: Fannie Mae will report for February soon.
Hotels: Occupancy Rate Declined 56% Year-over-year to All Time Record Low
by Calculated Risk on 3/26/2020 11:16:00 AM
From HotelNewsNow.com: STR: US hotel results for week ending 21 March
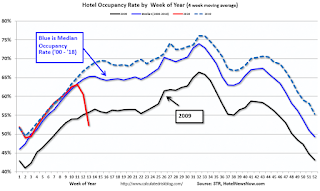
Showing further effects of the COVID-19 pandemic, the U.S. hotel industry reported significant year-over-year declines in the three key performance metrics during the week of 15-21 March 2020, according to data from STR.The following graph shows the seasonal pattern for the hotel occupancy rate using the four week average.
In comparison with the week of 17-23 March 2019, the industry recorded the following:
• Occupancy: -56.4% to 30.3%
• Average daily rate (ADR): -30.2% to US$93.41
• Revenue per available room (RevPAR): -69.5% to US$28.32
“RevPAR decreases are at unprecedented levels—worse than those seen during 9/11 and the financial crisis,” said Jan Freitag, STR’s senior VP of lodging insights. “Seven of 10 rooms were empty around the country. That average is staggering on its own, but it’s tougher to process when you consider that occupancy will likely fall further. With most events cancelled around the nation, group occupancy was down to one percent with a year-over-year RevPAR decline of 96.6%. The industry is no doubt facing a situation that will take a concerted effort by brands, owners and the government to overcome.”
emphasis added
 Click on graph for larger image.
The red line is for 2020, dash light blue is 2019, blue is the median, and black is for 2009 (the worst year probably since the Great Depression for hotels).
2020 was off to a solid start, however, COVID-19 has crushed hotel occupancy.
This is the lowest weekly occupancy on record, even considering seasonality, and STR expects occupancy rates to fall further. Note the graph is a 4-week average.
Kansas City Fed: "Tenth District Manufacturing Activity Declined Sharply" in March
by Calculated Risk on 3/26/2020 11:00:00 AM
From the Kansas City Fed: Tenth District Manufacturing Activity Declined Sharply
The Federal Reserve Bank of Kansas City released the March Manufacturing Survey today. According to Chad Wilkerson, vice president and economist at the Federal Reserve Bank of Kansas City, the survey revealed that Tenth District manufacturing activity declined sharply from a month ago, and expectations for future activity fell to levels last seen in early 2009.The last of the regional surveys for March will be released on Monday (Dallas Fed), and I expect the Texas region will be hit hard.
“Regional factory activity contracted sharply in March as firms were negatively impacted by COVID-19,” said Wilkerson. “Many firms indicated overall demand and sales have slowed dramatically, with capital investments being put on hold. Around 60 percent of manufacturers faced delayed payments from customers and 54 percent had concerns about cash availability.”
...
The month-over-month composite index was -17 in March, the lowest composite reading since April 2009, and down considerably from 5 in February and -1 in January. The composite index is an average of the production, new orders, employment, supplier delivery time, and raw materials inventory indexes.
emphasis added
Third Estimate Q4 GDP: Remains at 2.1% Annual Rate
by Calculated Risk on 3/26/2020 08:47:00 AM
From the BEA: Gross Domestic Product, Fourth Quarter and Year 2019 (Third Estimate); Corporate Profits, Fourth Quarter and Year 2019
Real gross domestic product (GDP) increased at an annual rate of 2.1 percent in the fourth quarter of 2019, according to the "third" estimate released by the Bureau of Economic Analysis. In the third quarter, real GDP also increased 2.1 percent.PCE growth was revised up to 1.8% from 1.7% in the second estimate. Residential investment was revised up to 6.5% from 6.2%.
The GDP estimate released today is based on more complete source data than were available for the "second" estimate issued last month. In the second estimate, the increase in real GDP was also 2.1 percent. In the third estimate, an upward revision to personal consumption expenditures (PCE) was largely offset by downward revisions to federal government spending and nonresidential fixed investment.
emphasis added
Here is a Comparison of Third and Second Estimates.
Weekly Initial Unemployment Claims Increase to 3,283,000
by Calculated Risk on 3/26/2020 08:35:00 AM
The DOL reported:
In the week ending March 21, the advance figure for seasonally adjusted initial claims was 3,283,000, an increase of 3,001,000 from the previous week's revised level. This marks the highest level of seasonally adjusted initial claims in the history of the seasonally adjusted series. The previous high was 695,000 in October of 1982. The previous week's level was revised up by 1,000 from 281,000 to 282,000. The 4-week moving average was 998,250, an increase of 765,750 from the previous week's revised average. The previous week's average was revised up by 250 from 232,250 to 232,500.The previous week was revised up.
emphasis added
The following graph shows the 4-week moving average of weekly claims since 1971.
 Click on graph for larger image.
The dashed line on the graph is the current 4-week average. The four-week average of weekly unemployment claims increased to 998,250.
This was much higher than the consensus forecast.
This week initial claims skyrocketed, and next week continued claims will follow.
The second graph shows seasonally adjust continued claims since 1967.
 At the worst of the Great Recession, continued claims peaked at 6.635 million, but then steadily declined.
Over the next few weeks, continued claims will increase rapidly to a new record high, and then will likely stay at that high level until the crisis abates.
Wednesday, March 25, 2020
Thursday: Initial Unemployment Claims, Q4 GDP
by Calculated Risk on 3/25/2020 08:49:00 PM
With the sudden stop in the economy, initial weekly unemployment claims will set an all time record this week, and will be huge next week too.
Thursday:
• At 8:30 AM ET, The initial weekly unemployment claims report will be released. The consensus is for a huge number of initial claims, up from 281 thousand the previous week.
• Also at 8:30 AM, Gross Domestic Product, 4th quarter 2019 (Third estimate). The consensus is that real GDP increased 2.1% annualized in Q4, the same as the second estimate of 2.1%.
• At 11:00 AM, the Kansas City Fed manufacturing survey for March.
March 25 Update: US COVID-19 Tests per Day #TestAndTrace
by Calculated Risk on 3/25/2020 04:53:00 PM
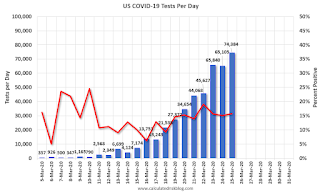
Tests per day is a key number to track (along with actual cases and, sadly, deaths). But total tests were a key for South Korea slowing the spread of COVID-19. South Korea has been conducting 15,000 to 20,000 tests per day with a 51 million population, so the US needs to test around 130,000 per day.
Note: NYC and LA have stopped testing mild cases due to resource constraints. Hopefully testing will continue to improve, and we can test more people - this is important for test-and-trace.
The US conducted 74,384 tests in the last 24 hours.
Note: About 16% of tests were positive in the most recent report (some are still pending). The high percentage of positives indicates limited testing. For Test-and-trace to be effective, the percent positive would probably be at 5% or less.

This data is from the COVID Tracking Project. Some states could do a better job of reporting the number of tests - so this is probably low.
Testing is improving, but needs to still increase significantly from here to be sufficient for test-and-trace.
Test. Test. Test. But protect our healthcare workers first!


