by Calculated Risk on 3/25/2020 11:31:00 AM
Wednesday, March 25, 2020
A 40-Day Plan to Start Recovery
Based on the experiences of other countries, it appears the number of cases per day (and deaths per day) will peak about 2 to 3 weeks after well observed shelter-in-place orders are issued (some areas are reporting less than 2 weeks - that would be great).
In some areas of the United States, shelter-in-place orders were issued a week or more ago. In some states and communities, orders have still not been issued.
Based on the experience in China, it appears the recovery can start in about 40 days after a national shelter-in-place - if certain rules are in place.
So here is a suggested 40-day plan to start recovery:
Today:
1. The Federal Government should ask all states to order Shelter-in-place (except for essential workers and businesses). This starts the clock across the country.
2. Use the Defense Production Act to increase supply of Personal Protection Equipment (PPE). We must protect our healthcare workers. This includes masks, gowns, face shields, and other protective equipment - and also medical equipment, primarily ventilators and ICU beds.
3. Sign Disaster relief fiscal policy into law. This will help Americans impacted by this national disaster.
4. Name a head of a national Test-and-Trace-and-Quarantine task force. Start putting in place the necessary manpower and tools to conduct test-and-trace when testing capacity (and sufficient PPE) allows for testing all contacts of anyone who has tested positive. We can't do this surveillance testing today due to lack of testing capacity and insufficient PPE (the priority for PPE is our healthcare workers and first responders) - but we should be able to do test-and-trace a couple of weeks after the cases-per-day peak. We must be ready! We will need people in the field, and software to track contacts, and also software (and manpower) to call those in quarantine twice a day until they test negative twice.
Every day:
1. Remind people about shelter-in-place, hygiene, and minimizing contact with others.
2. Ask people to keep a record of where they go, and the people they have contact with. This will be important once test-and-trace starts.
After Cases-per-day peak:
1. Continue to manufacture PPE, especially surgical masks - there will be another need for these masks.
2. Start test-and-trace and quarantine program as soon as possible after cases-per-day peak. This will identify asymptomatic people that will need to self-quarantine.
About 40 days from now (maybe sooner in some areas). Note: This will require an operational test-and-trace program, and sufficient masks for anyone who needs one.
1. Start easing shelter-in-place rules.
2. Require anyone in close contact with others to wear a mask (this is why surgical mask production must continue at high levels, even after the number of cases slows0. People need to wear masks, not to protect themselves, but to protect other people. This will help slow the spread.
3. Remind everyone daily about hygiene and minimizing contacts and staying home when sick (even as restrictions ease).
4. Anyone with even mild symptoms should be tested. Wide spread testing - and following up with test-and-trace will keep the spread minimal.
The crisis will not end completely until a vaccine and effective treatments are available, but the economic recovery could start in 40 days (or less time in some areas), if the Federal government takes action today.
March Vehicle Sales Forecast: 35% Year-over-year Decline
by Calculated Risk on 3/25/2020 09:59:00 AM
From Edmunds.com: New Vehicle Sales Drop in March to Close a Down First Quarter in 2020, Edmunds Forecasts
The car shopping experts at Edmunds say that March will be a down month for the auto industry due to the coronavirus (COVID-19) pandemic, forecasting that 1,044,805 new cars and trucks will be sold in the U.S. for an estimated seasonally adjusted annual rate (SAAR) of 11.9 million. This reflects a 35.5% decrease in sales from March 2019 and a 23.4% decrease from February 2020.
…
"The first two months of the year started off at a healthy sales pace, but the market took a dramatic turn in mid-March as more cities and states began to implement stay-at-home policies due to the coronavirus crisis, and consumers understandably shifted their focus to other things," said Jessica Caldwell, Edmunds' executive director of insights. "The whole world is turned upside down right now, and the auto industry is unfortunately not immune to the wide-ranging economic impacts of this unprecedented pandemic."
 Click on graph for larger image.
This graph shows actual sales from the BEA (Blue), and Edmunds forecast for March (Red).
Note that the low during the great recession was 9.02 million SAAR in February 2009.
With the sudden stop in activity, this forecast may be high - and sales will probably be lower in April.
FHFA: House Prices up 5.2% YoY in January
by Calculated Risk on 3/25/2020 09:35:00 AM
From the FHFA: FHFA House Price Index Up 0.3 Percent in January; Up 5.2 Percent from Last Year
U.S. house prices rose in January, up 0.3 percent from the previous month, according to the Federal Housing Finance Agency (FHFA) House Price Index (HPI). House prices rose 5.2 percent from January 2019 to January 2020. The previously reported 0.6 percent increase for December 2019 was revised upward to 0.7 percent.This is pre-crisis.
…
“U.S. house prices continued to increase at a moderate pace in January,” according to Dr. Lynn Fisher, Deputy Director of the Division of Research and Statistics at FHFA. “Transactions in January were unlikely to reflect much, if any, influence from the COVID-19 outbreak. House prices in the Pacific and South Atlantic regions grew somewhat faster over the year ending in January 2020 than observed the same time a year ago.”
MBA: Mortgage Applications Decreased in Latest Weekly Survey
by Calculated Risk on 3/25/2020 07:00:00 AM
The MBA noted that purchase applications were off 35% in New York not seasonally adjusted (following a 24% decline the previous week), and off 23% in California.
From the MBA: Mortgage Applications Decrease in Latest MBA Weekly Survey
Mortgage applications decreased 29.4 percent from one week earlier, according to data from the Mortgage Bankers Association’s (MBA) Weekly Mortgage Applications Survey for the week ending March 20, 2020.
... The Refinance Index decreased 34 percent from the previous week and was 195 percent higher than the same week one year ago. The seasonally adjusted Purchase Index decreased 15 percent from one week earlier. The unadjusted Purchase Index decreased 14 percent compared with the previous week and was 11 percent lower than the same week one year ago.
...
“The 30-year fixed mortgage rate reached its highest level since mid-January last week, even as Treasury yields remained at relatively low levels. Several factors pushed rates higher, including increased secondary market volatility, lenders grappling with capacity issues and backlogs in their pipelines, and remote work staffing challenges,” said Joel Kan, MBA’s Associate Vice President of Economic and Industry Forecasting. “With these higher rates, refinance activity fell 34 percent, and both the conventional and government indices dropped to their lowest level in a month. Looking ahead, this week’s additional actions taken by the Federal Reserve to restore liquidity and stabilize the mortgage-backed securities market could put downward pressure on mortgage rates, allowing more homeowners the opportunity to refinance.”
Added Kan, “Home purchase applications were notably impacted by rising rates and the widespread economic disruption and uncertainty over household employment and incomes. Last week’s purchase index fell 15 percent to its lowest level since August 2019. Compared to a year ago, purchase applications were down 11 percent – the first year-over-year decline in over three months. Potential homebuyers might continue to hold off on buying until there is a slowdown in the spread of the coronavirus and more clarity on the economic outlook.”
...
The average contract interest rate for 30-year fixed-rate mortgages with conforming loan balances ($510,400 or less) increased to 3.82 percent from 3.74 percent, with points decreasing to 0.35 from 0.37 (including the origination fee) for 80 percent loan-to-value ratio (LTV) loans.
emphasis added
 Click on graph for larger image.
The first graph shows the refinance index since 1990.
With record lower rates, we saw a huge increase in refinance activity in the survey over the last two weeks. Now, with higher rates last week - due to issues in the MBS market - refinance activity declined sharply. Note the Fed has stepped up buying of MBS this week.
 The second graph shows the MBA mortgage purchase index
According to the MBA, purchase activity is DOWN 11% year-over-year.
It appears purchase activity is falling sharply.
Tuesday, March 24, 2020
Wednesday: MBA Mortgage Applications, Durable Goods
by Calculated Risk on 3/24/2020 07:11:00 PM
The MBA Mortgage Application data will be very interesting now. This data is timely (last week), and will probably show a sharp decline in purchase applications in key states.
Wednesday:
• At 7:00 AM ET, The Mortgage Bankers Association (MBA) will release the results for the mortgage purchase applications index.
• At 8:30 AM, Durable Goods Orders for February from the Census Bureau. The consensus is for a 0.9% decrease in durable goods orders.
• At 9:00 AM, FHFA House Price Index for January. This was originally a GSE only repeat sales, however there is also an expanded index.
March 24 Update: US COVID-19 Tests per Day #TestAndTrace
by Calculated Risk on 3/24/2020 04:49:00 PM
Tests per day is a key number to track (along with actual cases and, sadly, deaths). But total tests were a key for South Korea slowing the spread of COVID-19. South Korea has been conducting 15,000 tests per day with a 51 million population, so the US needs to test around 100,000 per day.
Note: NYC and LA have stopped testing mild cases due to resource constraints. Hopefully testing will continue to improve, and we can test more people - this is important for test-and-trace.
The US conducted 63,851 tests in the last 24 hours.
Note: About 15% of tests were positive (red line, ht: NDD) in the most recent report (some are still pending). The high percentage of positives indicates limited testing. For Test-and-trace to be effective, the percent positive would probably be at 5% or less.

This data is from the COVID Tracking Project. Some states could do a better job of reporting the number of tests - so this is probably low.
Testing is improving, but needs to double from here to be sufficient for test-and-trace.
Test. Test. Test. But protect our healthcare workers first!
A few Comments on February New Home Sales
by Calculated Risk on 3/24/2020 11:12:00 AM
New home sales for February were reported at 765,000 on a seasonally adjusted annual rate basis (SAAR). Sales for the previous three months were revised up, and sales in January were revised up to a new cycle high of 800,000 - the highest sales rate since May 2007.
Earlier: New Home Sales at 765,000 Annual Rate in February.
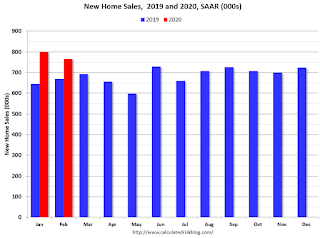
This graph shows new home sales for 2019 and 2020 by month (Seasonally Adjusted Annual Rate).
New home sales were up 14.3% Year-over-year (YoY) in February. The comparisons are easy over the first five months of the year, but sales will probably be down YoY for the next several months - at least - due to COVID-19.
And here is another update to the "distressing gap" graph that I first started posting a number of years ago to show the emerging gap caused by distressed sales.
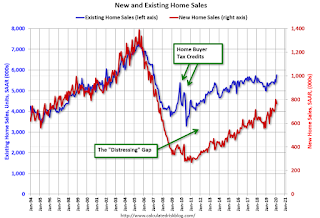
Following the housing bubble and bust, the "distressing gap" appeared mostly because of distressed sales.
Now the gap is mostly closed. However, this assumes that the builders will offer some smaller, less expensive homes.
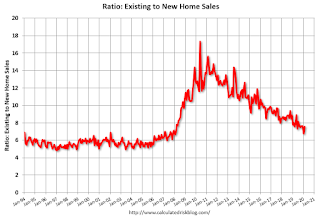
This ratio was fairly stable from 1994 through 2006, and then the flood of distressed sales kept the number of existing home sales elevated and depressed new home sales. (Note: This ratio was fairly stable back to the early '70s, but I only have annual data for the earlier years).
In general the ratio has been trending down since the housing bust - and is getting close to the historical ratio.
Note: Existing home sales are counted when transactions are closed, and new home sales are counted when contracts are signed. So the timing of sales is different.
Over the next several months, both new and existing home sales will be negatively impacted by COVID-19.
Richmond Fed: "Fifth District manufacturing activity remained fairly flat in March"
by Calculated Risk on 3/24/2020 10:18:00 AM
From the Richmond Fed: Manufacturing activity remained fairly flat in March
Fifth District manufacturing activity remained fairly flat in March, according to the most recent survey from the Federal Reserve Bank of Richmond. The composite index remained close to 0, rising from −2 in February to 2 in March.This survey was taken in the first half of March, and the impact of COVID-19 isn't apparent yet.
Survey results suggested a drop in employment but continued growth in wages in recent weeks.
emphasis added
New Home Sales at 765,000 Annual Rate in February
by Calculated Risk on 3/24/2020 10:13:00 AM
The Census Bureau reports New Home Sales in February were at a seasonally adjusted annual rate (SAAR) of 765 thousand.
The previous three months were revised up, combined.
"Sales of new single-family houses in February 2020 were at a seasonally adjusted annual rate of 765,000, according to estimates released jointly today by the U.S. Census Bureau and the Department of Housing and Urban Development. This is 4.4 percent below the revised January rate of 800,000, but is 14.3 percent above the February 2019 estimate of 669,000. "
emphasis added
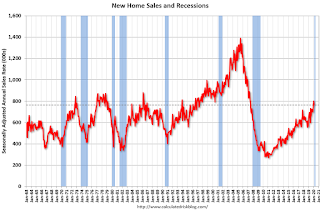 Click on graph for larger image.
The first graph shows New Home Sales vs. recessions since 1963. The dashed line is the current sales rate.
Even with the increase in sales over the last several years, new home sales are just at a normal level.
The second graph shows New Home Months of Supply.
 The months of supply increased in February to 5.0 months from 4.8 months in January.
 The all time record was 12.1 months of supply in January 2009.
This is in the normal range (less than 6 months supply is normal).
"The seasonally-adjusted estimate of new houses for sale at the end of February was 319,000. This represents a supply of 5.0 months at the current sales rate."
 On inventory, according to the Census Bureau:
 "A house is considered for sale when a permit to build has been issued in permit-issuing places or work has begun on the footings or foundation in nonpermit areas and a sales contract has not been signed nor a deposit accepted."Starting in 1973 the Census Bureau broke this down into three categories: Not Started, Under Construction, and Completed.
The third graph shows the three categories of inventory starting in 1973.
The inventory of completed homes for sale is still somewhat low, and the combined total of completed and under construction is close to normal.
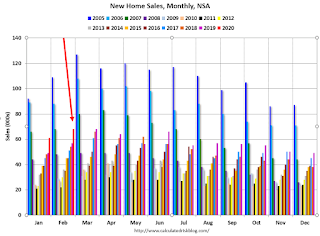 The last graph shows sales NSA (monthly sales, not seasonally adjusted annual rate).
In February 2020 (red column), 68 thousand new homes were sold (NSA). Last year, 57 thousand homes were sold in February
The all time high for February was 109 thousand in 2005, and the all time low for February was 22 thousand in 2011.
This was above expectations of 750 thousand sales SAAR, and sales in the three previous months were revised up, combined. This was a strong report with sales up 14.3% year-over-year. I'll have more later today.
This was prior to COVID-19 crisis.
Philly Fed: "Nonmanufacturing firms reported a significant weakening in activity this month"
by Calculated Risk on 3/24/2020 08:39:00 AM
From the Phily Fed: March 2020 Nonmanufacturing Business Outlook Survey
Note: Survey responses were collected from March 5 to March 19.This graph shows the Philly Fed Nonmanufacturing General Activity and Employment indexes.
Nonmanufacturing firms reported a significant weakening in regional nonmanufacturing activity this month, according to results from the Nonmanufacturing Business Outlook Survey. The survey’s indexes for general activity at the firm level, sales/revenues, new orders, and full-time employment all fell sharply and into negative territory this month, coinciding with developments related to the coronavirus. …
The diffusion index for current general activity at the firm level fell sharply from 36.1 in February to -12.8 in March, its lowest reading since July 2011 … The full-time employment index fell 23 points to -1.7.
emphasis added
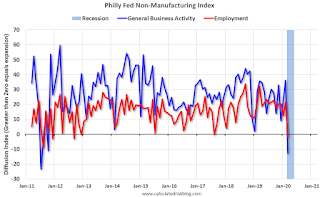 Click on graph for larger image.
Some of this survey was in early March, but it is clear the COVID-19 is having a significant on nonmanufacturing activity.


