by Calculated Risk on 11/22/2019 03:08:00 PM
Friday, November 22, 2019
Philly Fed: State Coincident Indexes increased in 33 states in October
From the Philly Fed:
The Federal Reserve Bank of Philadelphia has released the coincident indexes for the 50 states for October 2019. Over the past three months, the indexes increased in 42 states, decreased in seven states, and remained stable in one, for a three month diffusion index of 70. In the past month, the indexes increased in 33 states, decreased in 10 states, and remained stable in seven, for a one-month diffusion index of 46.Note: These are coincident indexes constructed from state employment data. An explanation from the Philly Fed:
emphasis added
The coincident indexes combine four state-level indicators to summarize current economic conditions in a single statistic. The four state-level variables in each coincident index are nonfarm payroll employment, average hours worked in manufacturing by production workers, the unemployment rate, and wage and salary disbursements deflated by the consumer price index (U.S. city average). The trend for each state’s index is set to the trend of its gross domestic product (GDP), so long-term growth in the state’s index matches long-term growth in its GDP.
 Click on map for larger image.
Here is a map of the three month change in the Philly Fed state coincident indicators. This map was all red during the worst of the recession, and all or mostly green during most of the recent expansion.
The map is mostly green on a three month basis, but there are some red and gray states.
Source: Philly Fed.
Note: For complaints about red / green issues, please contact the Philly Fed.
 And here is a graph is of the number of states with one month increasing activity according to the Philly Fed. This graph includes states with minor increases (the Philly Fed lists as unchanged).
In October, 37 states had increasing activity including states with minor increases.
Q4 GDP Forecasts: 0.4% to 1.9%
by Calculated Risk on 11/22/2019 11:49:00 AM
From Merrill Lynch:
Our 3Q tracking edged down to 1.8% from 1.9%. 4Q tracking remains at 1.5%. [Nov 22 estimate]From Goldman Sachs:
emphasis added
we left our Q4 GDP tracking estimate unchanged at +1.9% (qoq ar). [Nov 21 estimate]From the NY Fed Nowcasting Report
The New York Fed Staff Nowcast stands at 0.7% for 2019:Q4. [Nov 22 estimate]And from the Altanta Fed: GDPNow
The GDPNow model estimate for real GDP growth (seasonally adjusted annual rate) in the fourth quarter of 2019 is 0.4 percent on November 19, up from 0.3 percent on November 15. [Nov 19 estimate]CR Note: These early estimates suggest real GDP growth will be between 0.4% and 1.9% annualized in Q4.
Kansas City Fed: "Tenth District Manufacturing Activity Continued to Decline Modestly in November"
by Calculated Risk on 11/22/2019 11:00:00 AM
From the Kansas City Fed: Tenth District Manufacturing Activity Continued to Decline Modestly in November
The Federal Reserve Bank of Kansas City released the November Manufacturing Survey today. According to Chad Wilkerson, vice president and economist at the Federal Reserve Bank of Kansas City, the survey revealed that Tenth District manufacturing activity continued to decline modestly in November, however expectations for future activity rebounded moderately.Another weak regional manufacturing report.
“Regional factory activity continued to edge down in November, driven again by deterioration in durable goods production,” said Wilkerson. “But considerable more firms expect to add workers than reduce their workforce over the next year.”
...
The month-over-month composite index was -3 in November, equal to -3 in October, and similar to -2 in September. The composite index is an average of the production, new orders, employment, supplier delivery time, and raw materials inventory indexes.
emphasis added
One Year Ago: "Is a Recession Coming?"
by Calculated Risk on 11/22/2019 09:27:00 AM
This is from one year ago: "Is a Recession Coming?"
Recession calling is an annual ritual.
Thursday, November 21, 2019
"Mortgage Rates Steady Despite Bond Market Weakness"
by Calculated Risk on 11/21/2019 07:10:00 PM
From Matthew Graham at MortgageNewsDaily: Mortgage Rates Steady Despite Bond Market Weakness
Mortgage rates spent a 2nd day with the average lender holding relatively steady. This follows a decent winning streak over the previous week and a half with the net effect being at least an eighth of a percent (.125%) improvement on the average conventional 30yr fixed quote.
Holding steady was a bit anticlimactic yesterday because the broader bond market (specifically, the benchmark US 10yr Treasury yield) indicated more improvement than we actually saw. That had a lot to do with the underperformance of bonds that specifically underlie mortgages (MBS or "mortgage-backed securities). But whereas MBS lagged Treasuries yesterday, they outperformed today, thus allowing lenders to keep rates unchanged even as 10yr yields moved moderately higher. [Today's Most Prevalent Rates For Top Tier Scenarios 30YR FIXED - 3.75%]
 Click on graph for larger image.
This graph from Mortgage News Daily shows mortgage rates since 2014.
This graph is interactive, and you could view mortgage rates back to the mid-1980s - click here for graph.
Video: "2020 Economic Forecast featuring the UCI Paul Merage School of Business"
by Calculated Risk on 11/21/2019 01:58:00 PM
Here is the video of UCI Finance Professor Christopher Schwarz, Dr. Richard Afable and myself at the Newport Beach Chamber of Commerce event.
Comments on October Existing Home Sales
by Calculated Risk on 11/21/2019 12:14:00 PM
Earlier: NAR: Existing-Home Sales Increased to 5.46 million in October
A few key points:
1) Existing home sales were up 4.6% year-over-year (YoY) in October. This was the fourth consecutive YoY increase - following 16 consecutive months with a YoY decrease in sales
2) Inventory is still low, and was down 4.3% year-over-year (YoY) in October.

3) Year-to-date sales are down about 1.1% compared to the same period in 2018. On an annual basis, that would put sales around 5.28 million in 2019. Sales slumped at the end of 2018 and in January 2019 due to higher mortgage rates, the stock market selloff, and fears of an economic slowdown.
The comparisons will be easier towards in November and December of this year, and with lower mortgage rates, sales will probably finish the year unchanged or even up from 2018.

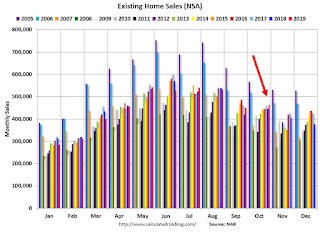
Sales NSA in October (463,000, red column) were above sales in October 2018 (446,000, NSA), and were the highest for October since 2006.
Overall this was a solid report.
NAR: Existing-Home Sales Increased to 5.46 million in October
by Calculated Risk on 11/21/2019 10:13:00 AM
From the NAR: Existing-Home Sales Climb 1.9% in October
Existing-home sales rose in October, a slight recovery from the declines seen in September, according to the National Association of Realtors®. The four major U.S. regions were split last month, with the Midwest and the South seeing growth, and the Northeast and the West both reporting a drop in sales.
Total existing-home sales, completed transactions that include single-family homes, townhomes, condominiums and co-ops, increased 1.9% from September to a seasonally-adjusted annual rate of 5.46 million in October. Despite lingering regional variances, overall sales are up 4.6% from a year ago (5.22 million in October 2018).
...
Total housing inventory at the end of October sat at 1.77 million units, down approximately 2.7% from September and 4.3% from one year ago (1.85 million). Unsold inventory sits at a 3.9-month supply at the current sales pace, down from 4.1 months in September and from the 4.3-month figure recorded in October 2018.
emphasis added
 Click on graph for larger image.
This graph shows existing home sales, on a Seasonally Adjusted Annual Rate (SAAR) basis since 1993.
Sales in October (5.46 million SAAR) were up 1.9% from last month, and were 4.6% above the October 2018 sales rate.
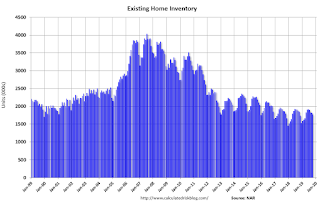
The second graph shows nationwide inventory for existing homes.
 According to the NAR, inventory decreased to 1.77 million in October from 1.82 million in September. Headline inventory is not seasonally adjusted, and inventory usually decreases to the seasonal lows in December and January, and peaks in mid-to-late summer.
The last graph shows the year-over-year (YoY) change in reported existing home inventory and months-of-supply. Since inventory is not seasonally adjusted, it really helps to look at the YoY change. Note: Months-of-supply is based on the seasonally adjusted sales and not seasonally adjusted inventory.
 Inventory was down 4.3% year-over-year in October compared to October 2018.
 Months of supply decreased to 3.9 months in October.
This was close to the consensus forecast. For existing home sales, a key number is inventory - and inventory is still low. I'll have more later …
Philly Fed Manufacturing shows "Overall Growth in November"
by Calculated Risk on 11/21/2019 08:50:00 AM
From the Philly Fed: Current Manufacturing Indexes Suggest Overall Growth in November
Manufacturing activity in the region continued to grow, according to results from the November Manufacturing Business Outlook Survey. The survey’s broad indicators remained positive, although their movements were mixed this month: The indicator for general activity increased, but the new orders, shipments, and employment indicators decreased from their readings last month. The survey’s future activity indexes remained positive, suggesting continued optimism about growth for the next six months.This was slightly above the consensus forecast. Here is a graph comparing the regional Fed surveys and the ISM manufacturing index:
The diffusion index for current general activity rose 5 points this month to 10.4, after decreasing 6 points in October.
emphasis added
 Click on graph for larger image.
The New York and Philly Fed surveys are averaged together (yellow, through November), and five Fed surveys are averaged (blue, through October) including New York, Philly, Richmond, Dallas and Kansas City. The Institute for Supply Management (ISM) PMI (red) is through October (right axis).
These early reports suggest the ISM manufacturing index will probably be weak again in November - but might increase a little.
Weekly Initial Unemployment Claims at 227,000
by Calculated Risk on 11/21/2019 08:36:00 AM
The DOL reported:
In the week ending November 16, the advance figure for seasonally adjusted initial claims was 227,000, unchanged from the previous week's revised level. The previous week's level was revised up by 2,000 from 225,000 to 227,000. The 4-week moving average was 221,000, an increase of 3,500 from the previous week's revised average. The previous week's average was revised up by 500 from 217,000 to 217,500.The previous week was revised up.
emphasis added
The following graph shows the 4-week moving average of weekly claims since 1971.
 Click on graph for larger image.
The dashed line on the graph is the current 4-week average. The four-week average of weekly unemployment claims increased to 221,000.
This was above the consensus forecast.


