 RSS Feed
 by Calculated Risk on 10/21/2019 03:18:00 PM
Monday, October 21, 2019
Phoenix Real Estate in September: Sales up 13.8% YoY, Active Inventory Down 16.3% YoY
This is a key housing market to follow since Phoenix saw a large bubble / bust followed by strong investor buying.
The Arizona Regional Multiple Listing Service (ARMLS) reports ("Stats Report"):
1) Overall sales were at 7,850 in September, down from 8,726 in August, but up from 6,897 in September 2018. Sales were down 10.0% from August 2019 (last month), and up 13.8% from September 2018.
2) Active inventory was at 13,936, down from 16,643 in September 2018. That is down 16.3% year-over-year.
3) Months of supply increased to 2.27 months in September from 2.00 months in August. This is low.
This is another market with increasing sales and falling inventory.
Real GDP Annual and Quarterly
by Calculated Risk on 10/21/2019 01:27:00 PM
The following graph shows real GDP quarterly (blue, annualized), and the year-over-year change in GDP (red).
The tax changes at the end of 2017 have had minimal impact on GDP. Most forecasts showed some minor boost in 2018 and 2019 followed by a minor drag starting in 2020. With the recent budget agreement, there probably will be little drag from fiscal policy next year.
Also, as shown earlier, there was no investment boom following the tax changes.
However, the tax changes did result in a large increase in the budget deficit (as predicted by all competent analysts).
 Click on graph for larger image.
This rate of growth is about what we should expect, see: Demographics and GDP: 2% is the new 4%
Note: Q3 2019 GDP estimated at 1.8% real rate annualized.
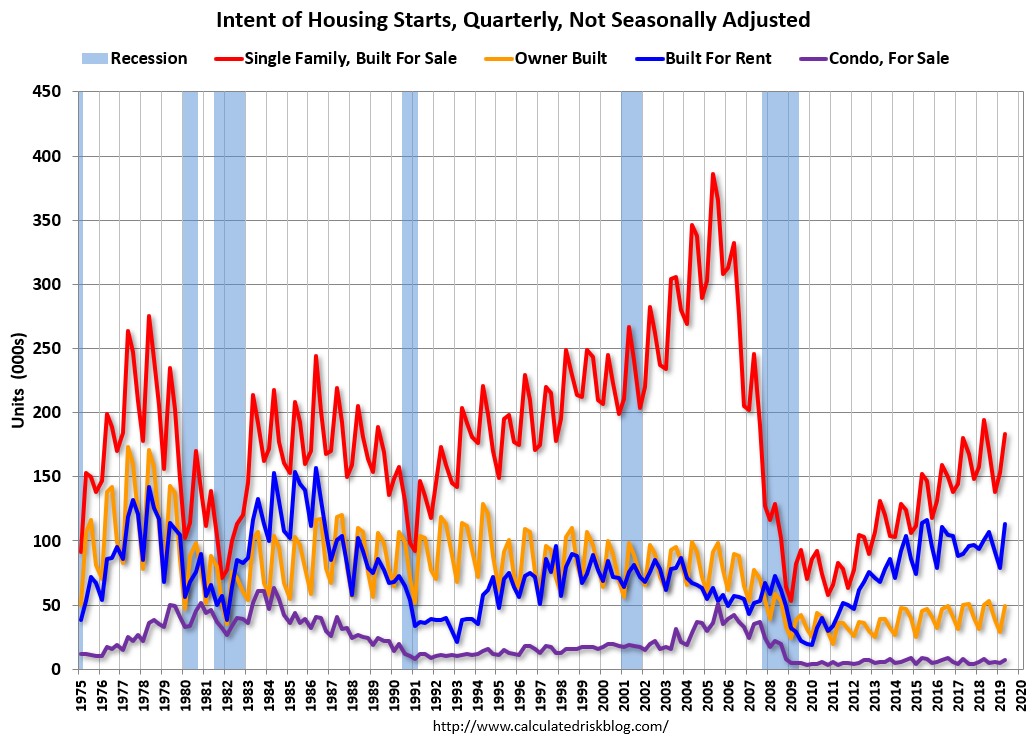
Quarterly Housing Starts by Intent
by Calculated Risk on 10/21/2019 10:06:00 AM
Here is a graph I haven't updated in some time. From the Census Bureau "Started and Completed by Purpose of Construction" through Q2 2019.
This graph shows the NSA quarterly intent for four start categories since 1975: single family built for sale, owner built (includes contractor built for owner), starts built for rent, and condos built for sale.
 Click on graph for larger image.
Single family starts built for sale were down about 6% in Q2 2019 compared to Q2 2018.
Owner built starts were down about 2% year-over-year.
And condos built for sale not far above the record low.
The 'units built for rent' (blue) had increased significantly following the great recession, but are now moving mostly sideways - and were up 12% in Q2 2019 compared to Q2 2018.
I expect single family, built for sales, will be up year-over-year in the 2nd half of 2019.
The Impact of the GM Strike on October Employment
by Calculated Risk on 10/21/2019 08:55:00 AM
Something to note on employment:
A tentative agreement has been reached at GM, however the GM workers were on strike during the BLS reference period (includes the 12th of the month). That means employment in October will be reduced by the number of workers on strike (approximately 48,000) plus some collateral layoffs in automotive suppliers.
The BLS counts striking workers as unemployed.
JP Morgan economist Daniel Silver estimates there will be 75,000 fewer jobs in October due to the strike. If the agreement is ratified, these jobs will return in the November report.
Sunday, October 20, 2019
Sunday Night Futures
by Calculated Risk on 10/20/2019 09:49:00 PM
Weekend:
• Schedule for Week of October 20, 2019
Monday:
• No major economic releases scheduled.
From CNBC: Pre-Market Data and Bloomberg futures: S&P 500 are up 9 and DOW futures are up 78 (fair value).
Oil prices were down over the last week with WTI futures at $53.60 per barrel and Brent at $59.14 barrel. A year ago, WTI was at $69, and Brent was at $80 - so oil prices are down about 25% year-over-year.
Here is a graph from Gasbuddy.com for nationwide gasoline prices. Nationally prices are at $2.64 per gallon. A year ago prices were at $2.84 per gallon, so gasoline prices are down 20 cents year-over-year.
Hotels: Occupancy Rate Decreased Year-over-year
by Calculated Risk on 10/20/2019 11:32:00 AM
From HotelNewsNow.com: STR: US hotel results for week ending 12 October
The U.S. hotel industry reported negative year-over-year results in the three key performance metrics during the week of 6-12 October 2019, according to data from STR.The following graph shows the seasonal pattern for the hotel occupancy rate using the four week average.
In comparison with the week of 7-13 October 2018, the industry recorded the following:
• Occupancy: -1.4% to 70.8%
• Average daily rate (ADR): -1.2% to US$131.38
• Revenue per available room (RevPAR): -2.6% to US$92.99
STR analysts attribute performance declines in many markets to the Yom Kippur calendar shift. Travel and conference schedules during the comparable time period last year were not affected by the Jewish holidays.
emphasis added
 Click on graph for larger image.
The red line is for 2019, dash light blue is 2018 (record year), blue is the median, and black is for 2009 (the worst year probably since the Great Depression for hotels).
Occupancy has been solid in 2019, and close to-date compared to the previous 4 years.
However occupancy will be lower this year than in 2018 (the record year).
Seasonally, the 4-week average of the occupancy rate will now move mostly sideways during the Fall business travel season.
Data Source: STR, Courtesy of HotelNewsNow.com
Saturday, October 19, 2019
Schedule for Week of October 20, 2019
by Calculated Risk on 10/19/2019 08:31:00 AM
The key reports this week are September New and Existing Home sales.
For manufacturing, the Richmond and Kansas City Fed manufacturing surveys will be released this week.
No major economic releases scheduled.
 10:00 AM: Existing Home Sales for September from the National Association of Realtors (NAR). The consensus is for 5.45 million SAAR, down from 5.49 million in August.
The graph shows existing home sales from 1994 through the report last month.
Housing economist Tom Lawler expects the NAR to report 5.36 million SAAR.
10:00 AM ET: Richmond Fed Survey of Manufacturing Activity for October.
7:00 AM ET: The Mortgage Bankers Association (MBA) will release the results for the mortgage purchase applications index.
9:00 AM: FHFA House Price Index for August 2018. This was originally a GSE only repeat sales, however there is also an expanded index.
During the day: The AIA's Architecture Billings Index for September (a leading indicator for commercial real estate).
11:15 AM: 2020 Economic Forecast featuring the UCI Paul Merage School of Business, Balboa Bay Resort, Newport Beach, CA 92660
8:30 AM: The initial weekly unemployment claims report will be released. The consensus is for 214,000 initial claims, unchanged from 214,000 last week.
8:30 AM: Durable Goods Orders for September from the Census Bureau. The consensus is for a 0.7% decrease in durable goods orders.
 10:00 AM: New Home Sales for September from the Census Bureau.
 This graph shows New Home Sales since 1963. The dashed line is the sales rate for last month.
The consensus is for 699 thousand SAAR, down from 713 thousand in August.
11:00 AM: the Kansas City Fed manufacturing survey for October.
10:00 AM: University of Michigan's Consumer sentiment index (Final for October). The consensus is for a reading of 96.0.
Friday, October 18, 2019
Q3 GDP Forecasts: Under 2%
by Calculated Risk on 10/18/2019 11:29:00 AM
From Merrill Lynch:
Weak inventories data edged down 3Q GDP tracking by a tenth to 1.5% qoq saar. [Oct 18 estimate]From the NY Fed Nowcasting Report
emphasis added
The New York Fed Staff Nowcast stands at 1.9% for 2019:Q3 and 1.1% for 2019:Q4. [Oct 18 estimate]And from the Altanta Fed: GDPNow
The GDPNow model estimate for real GDP growth (seasonally adjusted annual rate) in the third quarter of 2019 is 1.8 percent on October 17, unchanged from October 16. [Oct 17 estimate]CR Note: These estimates suggest real GDP growth will be under 2.0% annualized in Q3.
BLS: September Unemployment rates at New Series Lows in Alabama, California, Illinois, New Jersey and South Carolina
by Calculated Risk on 10/18/2019 10:24:00 AM
From the BLS: Regional and State Employment and Unemployment Summary
Unemployment rates were lower in September in 7 states, higher in 4 states, and stable in 39 states and the District of Columbia, the U.S. Bureau of Labor Statistics reported today. Seven states had jobless rate decreases from a year earlier, 2 states had increases, and 41 states and the District had little or no change.
...
Vermont had the lowest unemployment rate in September, 2.2 percent. The rates in Alabama (3.0 percent), California (4.0 percent), Illinois (3.9 percent), New Jersey (3.1 percent), and South Carolina (2.9 percent) set new series lows. (All state series begin in 1976.) Alaska had the highest jobless rate, 6.2 percent.
emphasis added
 Click on graph for larger image.
This graph shows the number of states (and D.C.) with unemployment rates at or above certain levels since January 1976.
At the worst of the great recession, there were 11 states with an unemployment rate at or above 11% (red).
Currently only one state, Alaska, has an unemployment rate at or above 6% (dark blue). Note that Alaska is at a new series low (since 1976). Two states and the D.C. have unemployment rates above 5%; Alaska and Mississippi.
A total of eight states are at a series low: Alabama, Alaska, California, Illinois, Maine, New Jersey, South Carolina, and Texas.
Lawler: Early Read on Existing Home Sales in September
by Calculated Risk on 10/18/2019 09:02:00 AM
From housing economist Tom Lawler: Early Read on Existing Home Sales in September
Based on publicly-available local realtor/MLS reports released across the country through today, I project that existing home sales as estimated by the National Association of Realtors ran at a seasonally adjusted annual rate of 5.36 million in September, down 2.4% from August’s preliminary estimate but up 3.5% from last September’s weak seasonally adjusted pace. Unadjusted sales should show a higher YoY increase, with the SA/NSA gap reflecting this September’s higher business day count relative to last September.
On the inventory front, local realtor/MLS data, as well as data from other inventory trackers, suggest that the inventory of existing homes for sale at the end of September should be down about 3.2% from a year earlier.
Finally, local realtor/MLS data suggest that the median US existing single-family home sales price last month was up by about 5.6% from last September.
CR Note: The National Association of Realtors (NAR) is scheduled to released September existing home sales on Tuesday, October 22nd at 10:00 AM ET. The consensus is for 5.45 million SAAR.


