by Calculated Risk on 9/20/2019 09:06:00 AM
Friday, September 20, 2019
CoreLogic: 2 Million Homes with Negative Equity in Q2 2019
From CoreLogic: Homeowner Equity Insights, 2nd Quarter 2019
In the second quarter 2019, the total number of mortgaged residential properties with negative equity decreased 7% from the first quarter 2019 to 2 million homes, or 3.8% of all mortgaged properties. On a year-over-year basis, negative equity fell 9% from 2.2 million homes, or 4.3% of all mortgaged properties, in the second quarter of 2018.
The national aggregate value of negative equity was approximately $302.7 billion at the end of the second quarter of 2019. This is down quarter over quarter by approximately $2.6 billion, from $305.3 billion in the first quarter of 2019.
Negative equity peaked at 26 percent of mortgaged residential properties in the fourth quarter of 2009, based on the CoreLogic equity data analysis which began in the third quarter of 2009.
emphasis added
 Click on graph for larger image.
This graph from CoreLogic shows the percent negative equity by states.
On a year-over-year basis, the number of homeowners with negative equity has declined from 2.2 million to 2.0 million.
Thursday, September 19, 2019
Friday: Q2 Flow of Funds
by Calculated Risk on 9/19/2019 06:40:00 PM
Friday:
• At 10:00 AM ET, State Employment and Unemployment (Monthly) for August 2019
• At 12:00 PM, Financial Accounts of the United States (aka Q2 Flow of Funds) from the Federal Reserve.
Revisiting: Has Housing Market Activity Peaked?
by Calculated Risk on 9/19/2019 04:11:00 PM
I wrote this in July 2018 (see: Has Housing Market Activity Peaked? and Has the Housing Market Peaked? (Part 2)
First, I think it is likely that existing home sales will move more sideways going forward. However it is important to remember that new home sales are more important for jobs and the economy than existing home sales. Since existing sales are existing stock, the only direct contribution to GDP is the broker's commission. There is usually some additional spending with an existing home purchase - new furniture, etc. - but overall the economic impact is small compared to a new home sale.Since that post, existing home sales have mostly moved sideways, and both new home sales and single family starts have hit new cycle highs.
Also I think the growth in multi-family starts is behind us, and that multi-family starts peaked in June 2015. See: Comments on June Housing Starts
For the economy, what we should be focused on are single family starts and new home sales. As I noted in Investment and Recessions "New Home Sales appears to be an excellent leading indicator, and currently new home sales (and housing starts) are up solidly year-over-year, and this suggests there is no recession in sight."
If new home sales and single family starts have peaked that would be a significant warning sign. Although housing is under pressure from policy (negative impact from tax, immigration and trade policies), I do not think housing has peaked, and I think new home sales and single family starts will increase further over the next couple of years.
Here is the graph I like to use to track tops and bottoms for housing activity. This is a graph of Single family housing starts, New Home Sales, and Residential Investment (RI) as a percent of GDP.
 Click on graph for larger image.
The arrows point to some of the earlier peaks and troughs for these three measures.
The purpose of this graph is to show that these three indicators generally reach peaks and troughs together. Note that Residential Investment is quarterly and single-family starts and new home sales are monthly.
RI as a percent of GDP has been sluggish recently, mostly due to softness in multi-family residential. However, both single family starts and new home sales have set new cycle highs this year.
Also, look at the relatively low level of RI as a percent of GDP, new home sales and single family starts compared to previous peaks. To have a significant downturn from these levels would be surprising.
Comments on August Existing Home Sales
by Calculated Risk on 9/19/2019 11:55:00 AM
Earlier: NAR: Existing-Home Sales Increased to 5.49 million in August
A few key points:
1) Existing home sales were up 2.6% year-over-year (YoY) in August. This was the second consecutive YoY increase - following 16 consecutive months with a YoY decrease in sales.
2) Inventory is still low, and was down 2.6% year-over-year (YoY) in August.
3) As usual, housing economist Tom Lawler's forecast was closer to the NAR report than the consensus. See: Lawler: Early Read on Existing Home Sales in August. The consensus was for sales of 5.38 million SAAR. Lawler estimated the NAR would report 5.42 million SAAR in July, and the NAR actually reported 5.49 million SAAR.

4) Year-to-date sales are down about 2.6% compared to the same period in 2018. On an annual basis, that would put sales around 5.20 million in 2019. Sales slumped at the end of 2018 and in January 2019 due to higher mortgage rates, the stock market selloff, and fears of an economic slowdown.
The comparisons will be easier towards the end of this year, and with lower mortgage rates, sales might even finish the year unchanged or even up from 2018.

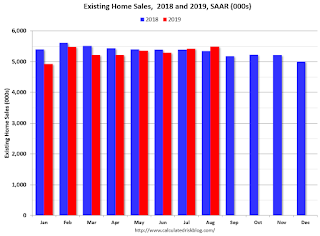
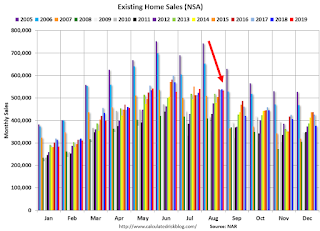
Sales NSA in August (534,000, red column) were below sales in August 2018 (539,000, NSA). There were fewer selling days in August 2019 than in 2018.
Overall this was a solid report.
NAR: Existing-Home Sales Increased to 5.49 million in August
by Calculated Risk on 9/19/2019 10:09:00 AM
From the NAR: Existing-Home Sales Increase 1.3% in August
Existing-home sales inched up in August, marking two consecutive months of growth, according to the National Association of Realtors®. Three of the four major regions reported a rise in sales, while the West recorded a decline last month.
Total existing-home sales, completed transactions that include single-family homes, townhomes, condominiums and co-ops, rose 1.3% from July to a seasonally adjusted annual rate of 5.49 million in August. Overall sales are up 2.6% from a year ago (5.35 million in August 2018).
...
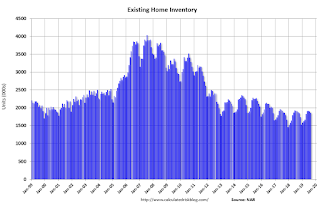
Total housing inventory at the end of August decreased to 1.86 million, down from 1.90 million existing-homes available for sale in July, and marking a 2.6% decrease from 1.91 million one year ago. Unsold inventory is at a 4.1-month supply at the current sales pace, down from 4.2 months in July and from the 4.3-month figure recorded in August 2018.
emphasis added
 Click on graph for larger image.
This graph shows existing home sales, on a Seasonally Adjusted Annual Rate (SAAR) basis since 1993.
Sales in August (5.49 million SAAR) were up 1.3% from last month, and were 2.6% above the August 2018 sales rate.
The second graph shows nationwide inventory for existing homes.
 According to the NAR, inventory decreased to 1.86 million in August from 1.90 million in July. Headline inventory is not seasonally adjusted, and inventory usually decreases to the seasonal lows in December and January, and peaks in mid-to-late summer.
The last graph shows the year-over-year (YoY) change in reported existing home inventory and months-of-supply. Since inventory is not seasonally adjusted, it really helps to look at the YoY change. Note: Months-of-supply is based on the seasonally adjusted sales and not seasonally adjusted inventory.
 Inventory was down 2.6% year-over-year in August compared to August 2018.
 Months of supply decreased to 4.1 months in August.
This was above the consensus forecast. For existing home sales, a key number is inventory - and inventory is still low. I'll have more later …
Philly Fed Manufacturing shows Continued Expansion in September, At Slower Pace
by Calculated Risk on 9/19/2019 09:39:00 AM
From the Philly Fed: August 2019 Manufacturing Business Outlook Survey
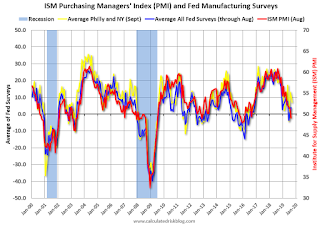
Manufacturing activity in the region continued to expand this month, according to results from the September Manufacturing Business Outlook Survey. The survey's broad indicators remained positive, although their movements were mixed: The indexes for general activity and new orders fell, while the indexes for shipments and employment increased. The survey’s price indexes increased notably this month. The survey’s future general activity index moderated but continues to suggest growth over the next six months.This was at the consensus forecast. Here is a graph comparing the regional Fed surveys and the ISM manufacturing index:
The diffusion index for current general activity fell 5 points this month to 12.0.
emphasis added
 Click on graph for larger image.
The New York and Philly Fed surveys are averaged together (yellow, through September), and five Fed surveys are averaged (blue, through August) including New York, Philly, Richmond, Dallas and Kansas City. The Institute for Supply Management (ISM) PMI (red) is through August (right axis).
These early reports suggest the ISM manufacturing index will probably be weak again in September.
Weekly Initial Unemployment Claims increased to 208,000
by Calculated Risk on 9/19/2019 08:37:00 AM
The DOL reported:
In the week ending September 14, the advance figure for seasonally adjusted initial claims was 208,000, an increase of 2,000 from the previous week's revised level. The previous week's level was revised up by 2,000 from 204,000 to 206,000. The 4-week moving average was 212,250, a decrease of 750 from the previous week's revised average. The previous week's average was revised up by 500 from 212,500 to 213,000.The previous week was revised up.
emphasis added
The following graph shows the 4-week moving average of weekly claims since 1971.
 Click on graph for larger image.
The dashed line on the graph is the current 4-week average. The four-week average of weekly unemployment claims decreased to 212,250.
This was lower than the consensus forecast.
Wednesday, September 18, 2019
Thursday: Existing Home Sales, Unemployment Claims, Philly Fed Mfg
by Calculated Risk on 9/18/2019 07:49:00 PM
Thursday:
• At 8:30 AM, The initial weekly unemployment claims report will be released. The consensus is for 214 thousand initial claims, up from 204 thousand the previous week.
• At 8:30 AM, the Philly Fed manufacturing survey for September. The consensus is for a reading of 11.3, down from 16.8.
• At 10:00 AM, Existing Home Sales for August from the National Association of Realtors (NAR). The consensus is for 5.38 million SAAR, down from 5.42 million in July. Housing economist Tom Lawler expects the NAR to report 5.42 million SAAR for August.
FOMC Projections and Press Conference
by Calculated Risk on 9/18/2019 02:12:00 PM
Statement here.
Fed Chair Powell press conference video here starting at 2:30 PM ET.
On the projections, growth was revised up slightly, and other projections were mostly unchanged.
Q1 real GDP growth was at 3.1% annualized, and Q2 at 2.0%. Currently most analysts are projecting around 1.5% to 2% in Q3. So the GDP projections for 2019 were revised up slightly.
| GDP projections of Federal Reserve Governors and Reserve Bank presidents | |||
|---|---|---|---|
| Change in Real GDP1 | 2019 | 2020 | 2021 |
| Sept 2019 | 2.1 to 2.3 | 1.8 to 2.1 | 1.8 to 2.0 |
| Jun 2019 | 2.0 to 2.2 | 1.8 to 2.2 | 1.8 to 2.0 |
| Mar 2019 | 1.9 to 2.2 | 1.8 to 2.0 | 1.7 to 2.0 |
The unemployment rate was at 3.7% in August. So the unemployment rate projection for 2019 was unchanged.
| Unemployment projections of Federal Reserve Governors and Reserve Bank presidents | |||
|---|---|---|---|
| Unemployment Rate2 | 2019 | 2020 | 2021 |
| Sept 2019 | 3.6 to 3.7 | 3.6 to 3.8 | 3.6 to 3.9 |
| Jun 2019 | 3.6 to 3.7 | 3.5 to 3.9 | 3.6 to 4.0 |
| Mar 2019 | 3.6 to 3.8 | 3.5 to 3.9 | 3.6 to 4.0 |
As of July 2019, PCE inflation was up 1.4% from July 2018 So PCE inflation projections were unchanged.
| Inflation projections of Federal Reserve Governors and Reserve Bank presidents | |||
|---|---|---|---|
| PCE Inflation1 | 2019 | 2020 | 2021 |
| Sept 2019 | 1.5 to 1.6 | 1.9 to 2.0 | 2.0 |
| Jun 2019 | 1.5 to 1.6 | 1.9 to 2.0 | 2.0 to 2.1 |
| Mar 2019 | 1.8 to 1.9 | 2.0 to 2.1 | 2.0 to 2.1 |
PCE core inflation was up 1.6% in July year-over-year. So Core PCE inflation was unchanged.
| Core Inflation projections of Federal Reserve Governors and Reserve Bank presidents | |||
|---|---|---|---|
| Core Inflation1 | 2019 | 2020 | 2021 |
| Sept 2019 | 1.7 to 1.8 | 1.9 to 2.0 | 2.0 |
| Jun 2019 | 1.7 to 1.8 | 1.9 to 2.0 | 2.0 to 2.1 |
| Mar 2019 | 1.9 to 2.0 | 2.0 to 2.1 | 2.0 to 2.1 |
FOMC Statement: 25bp Decrease
by Calculated Risk on 9/18/2019 02:01:00 PM
Information received since the Federal Open Market Committee met in July indicates that the labor market remains strong and that economic activity has been rising at a moderate rate. Job gains have been solid, on average, in recent months, and the unemployment rate has remained low. Although household spending has been rising at a strong pace, business fixed investment and exports have weakened. On a 12-month basis, overall inflation and inflation for items other than food and energy are running below 2 percent. Market-based measures of inflation compensation remain low; survey-based measures of longer-term inflation expectations are little changed.
Consistent with its statutory mandate, the Committee seeks to foster maximum employment and price stability. In light of the implications of global developments for the economic outlook as well as muted inflation pressures, the Committee decided to lower the target range for the federal funds rate to 1-3/4 to 2 percent. This action supports the Committee's view that sustained expansion of economic activity, strong labor market conditions, and inflation near the Committee's symmetric 2 percent objective are the most likely outcomes, but uncertainties about this outlook remain. As the Committee contemplates the future path of the target range for the federal funds rate, it will continue to monitor the implications of incoming information for the economic outlook and will act as appropriate to sustain the expansion, with a strong labor market and inflation near its symmetric 2 percent objective.
In determining the timing and size of future adjustments to the target range for the federal funds rate, the Committee will assess realized and expected economic conditions relative to its maximum employment objective and its symmetric 2 percent inflation objective. This assessment will take into account a wide range of information, including measures of labor market conditions, indicators of inflation pressures and inflation expectations, and readings on financial and international developments.
Voting for the monetary policy action were Jerome H. Powell, Chair, John C. Williams, Vice Chair; Michelle W. Bowman; Lael Brainard; Richard H. Clarida; Charles L. Evans; and Randal K. Quarles. Voting against the action were James Bullard, who preferred at this meeting to lower the target range for the federal funds rate to 1-1/2 to 1-3/4 percent; and Esther L. George and Eric S. Rosengren, who preferred to maintain the target range at 2 percent to 2-1/4 percent.
emphasis added


