by Calculated Risk on 9/10/2019 12:32:00 PM
Tuesday, September 10, 2019
Seattle Real Estate in August: Sales up 5.1% YoY, Inventory up 25% YoY from Low Levels
The Northwest Multiple Listing Service reported Home Buyers Seeking Affordability Are Expanding Search Outside Greater Seattle Job Centers
Depleted inventory continues to frustrate would-be buyers in Western Washington. Many of these potential homeowners are expanding their search beyond the major job centers in King County, according to market watchers who commented on the latest statistics from Northwest Multiple Listing Service.The press release is for the Northwest. In King County, sales were up 4.1% year-over-year, and active inventory was down 5.7% year-over-year.
The MLS report summarizing August activity shows less than two months of supply system-wide, and only about 1.6 months of supply in the four-county Puget Sound region. The sparse selection is pushing up prices. For last month's sales of single family homes and condos across the 23 counties served by Northwest MLS, prices rose nearly 6.2% compared to a year ago.
...
"While August is always a slower time for listings and sales, what is really surprising this year is the decrease in new listings taken, while pending sales increased," observed Mike Grady, president and COO of Coldwell Banker Bain.
emphasis added
In Seattle, sales were up 5.1% year-over-year, and inventory was up 25% year-over-year from very low levels. The year-over-year increase in inventory has slowed sharply (although still up 25%), and the months of supply is still low in Seattle (1.9 months). In many areas it appears the inventory build that started last year is ending.
BLS: Job Openings "Little Changed" at 7.2 Million in July
by Calculated Risk on 9/10/2019 10:10:00 AM
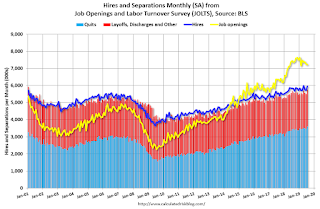
Notes: In July there were 7.217 million job openings, and, according to the July Employment report, there were 6,063 million unemployed. So, for the seventeenth consecutive month, there were more job openings than people unemployed. Also note that the number of job openings has exceeded the number of hires since January 2015 (4+ years).
From the BLS: Job Openings and Labor Turnover Summary
The number of job openings was little changed at 7.2 million on the last business day of July, the U.S. Bureau of Labor Statistics reported today. Over the month, hires edged up to 6.0 million and separations increased to 5.8 million. Within separations, the quits rate and the layoffs and discharges rate were little changed at 2.4 percent and 1.2 percent, respectively. ...The following graph shows job openings (yellow line), hires (dark blue), Layoff, Discharges and other (red column), and Quits (light blue column) from the JOLTS.
The number of quits edged up to a series high in July of 3.6 million (+130,000). The quits rate was 2.4 percent. The quits level edged up for total private (+127,000) and was little changed for government. Quits increased in health care and social assistance (+54,000) and in federal government (+3,000).
emphasis added
This series started in December 2000.
Note: The difference between JOLTS hires and separations is similar to the CES (payroll survey) net jobs headline numbers. This report is for July, the most recent employment report was for August.
 Click on graph for larger image.
Note that hires (dark blue) and total separations (red and light blue columns stacked) are pretty close each month. This is a measure of labor market turnover. When the blue line is above the two stacked columns, the economy is adding net jobs - when it is below the columns, the economy is losing jobs.
Jobs openings decreased in July to 7.217 million from 7.248 million in June.
The number of job openings (yellow) are down 3% year-over-year.
Quits are up 3% year-over-year to a new series high. These are voluntary separations. (see light blue columns at bottom of graph for trend for "quits").
Job openings remain at a high level, and quits are still increasing year-over-year. This was a solid report.
Small Business Optimism Index Decreased in August
by Calculated Risk on 9/10/2019 08:50:00 AM
CR Note: Most of this survey is noise, but there is some information, especially on the labor market and the "Single Most Important Problem".
From the National Federation of Independent Business (NFIB): August 2019 Report: Small Business Optimism Index
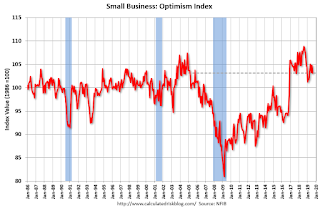
The NFIB Small Business Optimism Index fell 1.6 points to 103.1, remaining within the top 15 percent of readings. Overall, August was a good month for small business. However, optimism slipped because fewer owners said they expect better business conditions and real sales volumes in the coming months.
..
Job creation picked up in August, with an average addition of 0.19 workers per firm compared to 0.12 in July. Finding qualified workers is becoming more and more difficult with a record 27 percent reporting finding qualified workers as their number one problem (up 1 point).
emphasis added
 Click on graph for larger image.
This graph shows the small business optimism index since 1986.
The index decreased to 103.1 in August.
Note: Usually small business owners complain about taxes and regulations (currently 2nd and 3rd on the "Single Most Important Problem" list). However, during the recession, "poor sales" was the top problem. Now the difficulty of finding qualified workers is the top problem.
Monday, September 09, 2019
Tuesday: Job Openings
by Calculated Risk on 9/09/2019 07:23:00 PM
From Matthew Graham at Mortgage News Daily: Mortgage Rates Moving Quickly Higher
Mortgage rates moved higher today at the fastest pace in several months today. [Most Prevalent Rates 30YR FIXED - 3.5% - 3.625%]Tuesday:
emphasis added
• At 6:00 AM, NFIB Small Business Optimism Index for August.
• At 10:00 AM ET, Job Openings and Labor Turnover Survey for July from the BLS.
Las Vegas: Convention Attendance and Visitor Traffic up Slightly in 2019 Through July
by Calculated Risk on 9/09/2019 03:27:00 PM
During the recession, I wrote about the troubles in Las Vegas and included a chart of visitor and convention attendance: Lost Vegas.
Since then Las Vegas visitor traffic recovered to new record highs.
However, in 2018, visitor traffic declined 0.2% compared to 2017, but was still 7.5% above the pre-recession peak.
Convention attendance declined 2.2% in 2018 from the record high in 2017. Here is the data from the Las Vegas Convention and Visitors Authority.

The blue bars are annual visitor traffic (left scale), and the red line is convention attendance (right scale). 2019 is estimate based on data through July 2019.
Convention attendance was up 3.3% in 2019 compared to the same period in 2018.
Visitor traffic was up 0.6% in 2019 compared to the first seven months of 2018.
Historically, declines in Las Vegas visitor traffic have been associated with economic weakness, so the slight declines over the last two years was concerning.
Update on Decennial Census Hiring
by Calculated Risk on 9/09/2019 12:34:00 PM
In the August employment report, the BLS reported
In August, employment in federal government increased by 28,000. The gain was mostly due to the hiring of 25,000 temporary workers to prepare for the 2020 Census.Earlier, on August 12th, from the Census Bureau: U.S. Census Bureau Announces the Start of First Major Field Operation for 2020 Census
emphasis added
“We were able to verify 65% of addresses using satellite imagery — a massive accomplishment for us,” said Census Bureau Geography Division Chief Deirdre Bishop during the briefing. “In 2010 we had to hire 150,000 people to verify 100% of the addresses in the field, this decade we will only have to hire about 40,000 employees around the nation to verify the remaining 35% of addresses.”Based on this information, we can estimate:
…
Census Bureau employees (listers) have started walking through neighborhoods across the country checking addresses not verified using BARCA software. In-field address canvassing will continue through mid-October.
• An additional 15,000 or so temporary Census workers will be reported in the September BLS report, bringing the total for this operation to around 40,000.
• There probably be little impact from the Census on the October report (the operation concludes in "mid-October"). However, it is possible some temporary jobs will be terminated prior to the reference week in October.
• There will probably be 30,000 to 40,000 Census jobs terminated in November, and maybe December.
• The major Census hiring will start early next year, and will really ramp up in April and May of 2020.
• The major Decennial Census terminations will happen in June through September of 2020.
Here is the Census webpage listing jobs added and terminated by month for the last several Census (1990, 2000, 2010, and now 2020).
Here is How to Report the Monthly Employment Number excluding Temporary Census Hiring
AAR: August Rail Carloads down 4.6% YoY, Intermodal Down 5.4% YoY
by Calculated Risk on 9/09/2019 10:28:00 AM
From the Association of American Railroads (AAR) Rail Time Indicators. Graphs and excerpts reprinted with permission.
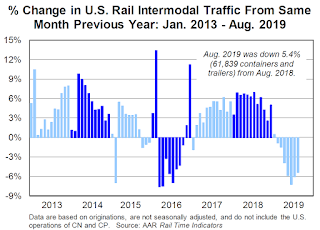
It seems clear that U.S. railroads are facing a freight recession. Total originated U.S. rail carloads fell 4.6% in August 2019 from August 2018, their seventh straight year-over-year decline. The average decline over those seven months was 4.2%, a not-insignificant amount. Meanwhile, U.S. intermodal volume fell 5.4% in August, also the seventh straight monthly decline. … Why? The parts of the economy that generate much of the freight that railroads carry — manufacturing and goods trading — have weakened significantly over the past several months.
emphasis added
 Click on graph for larger image.
This graph from the Rail Time Indicators report shows the year-over-year changes in U.S. Carloads.
U.S. railroads originated 1.06 million total carloads in August 2019, down 4.6%, or 50,672 carloads, from August 2018. August was the seventh straight year-over-year decline. For the first eight months of 2019, total U.S. carloads were down 3.4%, or 310,246 carloads, compared with 2018. Our U.S. data begin in 1988. Since then, only 2016 had fewer year-to-date total carloads than this year.
 The second graph is the year-over-year change for intermodal traffic (using intermodal or shipping containers):
For intermodal, August was no prize either: originations were down 5.4% from August 2018. That too was the seventh straight decline. In 2019 through August, intermodal originations were down 3.9%, or 375,964 containers and trailers, from last year. It’s some consolation, though, that 2018 was a record year for intermodal, and this year’s January-August total is the second best ever (behind 2018).
So far, U.S. rail traffic appears to be mirroring what happened in late 2015 and 2016, when it fell for 13 out of 14 months. Back then, there was a freight recession, but not an economywide recession. We appear to be in another freight recession now. Whether the same thing happens this time around — the overall economy wobbles but doesn’t fall down1 — remains to be seen, but railroads are already suffering. One reason why is that the ongoing trade war and accompanying uncertainty has had the most direct impact on manufacturing and commodity-related industries that are heavily served by railroads but that comprise only a moderate share of the overall economy.
Black Knight Mortgage Monitor for July: National Delinquency Rate near Series Low
by Calculated Risk on 9/09/2019 08:11:00 AM
Black Knight released their Mortgage Monitor report for July today. According to Black Knight, 3.46% of mortgages were delinquent in July, down slightly from 3.61% in July 2018. Black Knight also reported that 0.49% of mortgages were in the foreclosure process, down from 0.57% a year ago.
This gives a total of 3.95% delinquent or in foreclosure.
Press Release: Black Knight Mortgage Monitor: Servicer Retention Rates Improve Significantly Among Rate-Driven Refinance Transactions; Cash-Out Refi Retention Still Lackluster
Today, the Data & Analytics division of Black Knight, Inc. released its latest Mortgage Monitor Report, based upon the company’s industry-leading mortgage performance, housing and public records datasets. This month’s report returned to the subject of servicer retention rates – the share of borrowers servicers retained through a refinance transaction. As Black Knight Data & Analytics President Ben Graboske explained, falling interest rates and a subsequent increase in rate/term refinances has worked in servicers’ favor.
...
This month’s analysis found that tappable equity – the amount of equity available to homeowners with mortgages before reaching a maximum combined loan-to-value ratio of 80% – rose for the second consecutive quarter. Gaining $335 billion in Q2 2019, tappable equity is now at an all-time high of $6.3 trillion. Approximately 45 million homeowners with mortgages have an average of $140,000 in tappable equity available to them. As mentioned above, falling 30-year rates have made cash-out refinances an affordable alternative to HELOCs as a way for these homeowners to tap equity. These falling rates have also opened up a relatively low-risk pool of potential borrowers with high credit scores. Nearly half of tappable equity holders have current first lien rates of 4.25%, while 76% have interest rates of 3.75% or higher, meaning they could potentially tap into home equity with little change to their existing 30-year rate, or perhaps even experience a slight improvement. More than half of this population has credit scores of 760 or above, making for a relatively low-risk market segment; another 16% have credit scores between 720-759.
emphasis added
 Click on graph for larger image.
Here is a graph from the Mortgage Monitor that shows the National delinquency rate over time.
From Black Knight:
• After June's calendar-driven spike, the national delinquency rate recovered strongly in JulyThe second graph shows the Year-over-year change in Black Knight's House Price Index:
• Delinquencies fell 7% from June, and are now down more than 4% from one year ago
• July 2019’s delinquency rate of 3.46% is the lowest for any July on record dating back to 2000
• The national delinquency rate is now more than 1% below the pre-recession average for the first time in 2019 after first crossing that threshold in late 2018

• The rate of a annual home price appreciation rose in July for the first time since February 2018There is much more in the mortgage monitor.
• Home prices were up by 0.34% for the month, increasing the annual home price growth rate to 3.9%
• Over those 16 months, annual home price growth had fallen from a peak of 6.75% in February 2018 to 3.7% as of June
• It’s important to note that the slowdown didn’t equate to falling home prices at the national level; in fact, July marked 87 consecutive months of annual home price growth
Sunday, September 08, 2019
Sunday Night Futures
by Calculated Risk on 9/08/2019 10:02:00 PM
Weekend:
• Schedule for Week of September 8, 2019
Tuesday:
• At 3:00 PM, Consumer Credit from the Federal Reserve.
From CNBC: Pre-Market Data and Bloomberg futures: S&P 500 are up 4 and DOW futures are up 25 (fair value).
Oil prices were up over the last week with WTI futures at $56.82 per barrel and Brent at $61.76 barrel. A year ago, WTI was at $68, and Brent was at $77 - so oil prices are down about 20% year-over-year.
Here is a graph from Gasbuddy.com for nationwide gasoline prices. Nationally prices are at $2.55 per gallon. A year ago prices were at $2.85 per gallon, so gasoline prices are down 30 cents year-over-year.
Hotels: Occupancy Rate Decreased Year-over-year
by Calculated Risk on 9/08/2019 08:19:00 AM
From HotelNewsNow.com: STR: US hotel results for week ending 31 August
The U.S. hotel industry reported mostly positive year-over-year results in the three key performance metrics during the week of 25-31 August 2019, according to data from STR.The following graph shows the seasonal pattern for the hotel occupancy rate using the four week average.
In comparison with the week of 26 August through 1 September 2018, the industry recorded the following:
• Occupancy: -0.4% to 66.7%
• Average daily rate (ADR): +1.4% to US$127.26
• Revenue per available room (RevPAR): +1.0% at US$84.87
Orlando, Florida, saw the steepest declines in occupancy (-21.6% to 52.4%) and RevPAR (-24.1% to US$52.84).
Miami/Hialeah, Florida, posted the largest drop in ADR (-6.6% to US$137.27) and the only other double-digit decreases in occupancy (-10.9% to 60.1%) and RevPAR (-16.8% to US$82.56).
Due to the anticipation of Hurricane Dorian, the three largest hotel markets in Florida each reported significant declines in occupancy on Friday and Saturday.
emphasis added
 Click on graph for larger image.
The red line is for 2019, dash light blue is 2018 (record year), blue is the median, and black is for 2009 (the worst year probably since the Great Depression for hotels).
Occupancy has been solid in 2019, and close to-date compared to the previous 4 years.
However occupancy will be lower this year than in 2018 (the record year), unless there is a strong boost due to hurricane impacted areas.
Seasonally, the occupancy rate will now decline until the Fall business travel season.
Data Source: STR, Courtesy of HotelNewsNow.com


