 RSS Feed
 by Calculated Risk on 9/07/2019 08:11:00 AM
Saturday, September 07, 2019
Schedule for Week of September 8, 2019
The key economic reports this week are August Retail sales, and the August Consumer Price Index (CPI).
3:00 PM: Consumer Credit from the Federal Reserve.
6:00 AM: NFIB Small Business Optimism Index for August.
 10:00 AM ET: Job Openings and Labor Turnover Survey for July from the BLS.
 This graph shows job openings (yellow line), hires (purple), Layoff, Discharges and other (red column), and Quits (light blue column) from the JOLTS.
Jobs openings decreased in June to 7.348 million from 7.384 million in May.
The number of job openings (yellow) were down 1% year-over-year, and Quits were up 2% year-over-year.
7:00 AM ET: The Mortgage Bankers Association (MBA) will release the results for the mortgage purchase applications index.
8:30 AM: The Producer Price Index for August from the BLS. The consensus is for a 0.1% increase in PPI, and a 0.2% increase in core PPI.
8:30 AM: The initial weekly unemployment claims report will be released. The consensus is for 215 thousand initial claims, down from 217 thousand the previous week.
8:30 AM: The Consumer Price Index for August from the BLS. The consensus is for a 0.1% increase in CPI, and a 0.2% increase in core CPI.
 8:30 AM ET: Retail sales for August will be released. The consensus is for a 0.3% increase in retail sales.
This graph shows the year-over-year change in retail sales and food service (ex-gasoline) since 1993. Retail and Food service sales, ex-gasoline, increased by 3.7% on a YoY basis in July.
10:00 AM: University of Michigan's Consumer sentiment index (Preliminary for September).
Friday, September 06, 2019
Public and Private Sector Payroll Jobs During Presidential Terms
by Calculated Risk on 9/06/2019 04:00:00 PM
By request, here is another update of tracking employment during Presidential terms. We frequently use Presidential terms as time markers - we could use Speaker of the House, Fed Chair, or any other marker.
NOTE: Several readers have asked if I could add a lag to these graphs (obviously a new President has zero impact on employment for the month they are elected). But that would open a debate on the proper length of the lag, so I'll just stick to the beginning of each term.
Important: There are many differences between these periods. Overall employment was smaller in the '80s, however the participation rate was increasing in the '80s (younger population and women joining the labor force), and the participation rate is generally declining now. But these graphs give an overview of employment changes.
The first graph shows the change in private sector payroll jobs from when each president took office until the end of their term(s). Presidents Carter and George H.W. Bush only served one term.
Mr. G.W. Bush (red) took office following the bursting of the stock market bubble, and left during the bursting of the housing bubble. Mr. Obama (dark blue) took office during the financial crisis and great recession. There was also a significant recession in the early '80s right after Mr. Reagan (dark red) took office.
There was a recession towards the end of President G.H.W. Bush (light purple) term, and Mr Clinton (light blue) served for eight years without a recession.
 Click on graph for larger image.
The first graph is for private employment only.
Mr. Trump is in Orange (31 months).
The employment recovery during Mr. G.W. Bush's (red) first term was sluggish, and private employment was down 821,000 jobs at the end of his first term. At the end of Mr. Bush's second term, private employment was collapsing, and there were net 382,000 private sector jobs lost during Mr. Bush's two terms.
Private sector employment increased by 20,979,000 under President Clinton (light blue), by 14,714,000 under President Reagan (dark red), 9,039,000 under President Carter (dashed green), 1,511,000 under President G.H.W. Bush (light purple), and 11,890,000 under President Obama (dark blue).
During the first 31 months of Mr. Trump's term, the economy has added 5,561,000 private sector jobs.
 A big difference between the presidencies has been public sector employment. Note: the bumps in public sector employment due to the decennial Census in 1980, 1990, 2000, and 2010.
The public sector grew during Mr. Carter's term (up 1,304,000), during Mr. Reagan's terms (up 1,414,000), during Mr. G.H.W. Bush's term (up 1,127,000), during Mr. Clinton's terms (up 1,934,000), and during Mr. G.W. Bush's terms (up 1,744,000 jobs). However the public sector declined significantly while Mr. Obama was in office (down 269,000 jobs).
During the first 31 months of Mr. Trump's term, the economy has added 281,000 public sector jobs.
 The third graph shows the progress towards the Trump goal of adding 10 million jobs over his 4 year term.
After 31 months of Mr. Trump's presidency, the economy has added 5,846,000 jobs, about 612,000 behind the projection.
Note: Based on the preliminary Benchmark revision, there will be 501,000 fewer jobs in March 2019 after the Benchmark revision is released in February - so job growth is probably over 1 million behind the projection.
Las Vegas Real Estate in August: Sales up 1.4% YoY, Inventory up 37% YoY
by Calculated Risk on 9/06/2019 01:00:00 PM
This is a key former distressed market to follow since Las Vegas saw the largest price decline, following the housing bubble, of any of the Case-Shiller composite 20 cities.
The Greater Las Vegas Association of Realtors reported More signs that Southern Nevada’s real estate roller-coaster ride has slowed down; GLVAR housing statistics for August 2019
The total number of existing local homes, condos and townhomes sold during August was 3,935. Compared to one year ago, August sales were up 3.1% for homes, but down 5.1% for condos and townhomes.1) Overall sales were up 1.4% year-over-year to 3,935 in August 2019 from 3,881 in August 2018.
By the end of August, GLVAR reported 7,766 single-family homes listed for sale without any sort of offer. That’s up 33.5% from one year ago. For condos and townhomes, the 1,860 properties listed without offers in August represented a 57.1% increase from one year ago.
While the local housing supply is up from one year ago, Carpenter said it’s still below what would normally be considered a balanced market. At the current sales pace, she said Southern Nevada has about a 2.5-month supply of homes available for sale.
...
[T]he number of so-called distressed sales remains near historically low levels. GLVAR reported that short sales and foreclosures combined accounted for just 2.1% of all existing local property sales in August. That compares to 2.5% of all sales one year ago and 6.1% two years ago.
emphasis added
2) Active inventory (single-family and condos) is up from a year ago, from a total of 7,002 in August 2018 to 9,626 in August 2019. Note: Total inventory was up 37% year-over-year. This is a significant increase in inventory, although the year-over-year increase is down substantially from earlier this year. And months of inventory is still low.
3) Low level of distressed sales.
Q3 GDP Forecasts: Mid-to-high 1%
by Calculated Risk on 9/06/2019 11:36:00 AM
From Merrill Lynch:
We left our Q3 GDP tracking estimate unchanged at +1.9% (qoq ar). [Sept 5 estimate]From Goldman Sachs:
emphasis added
[W]e lowered our Q3 GDP tracking estimate by one tenth to 1.9% (qoq ar).. [Sept 4 estimate] From the NY Fed Nowcasting Report
The New York Fed Staff Nowcast stands at 1.5% for 2019:Q3 and 1.1% for 2019:Q4. [Sept 6 estimate].And from the Altanta Fed: GDPNow
The GDPNow model estimate for real GDP growth (seasonally adjusted annual rate) in the third quarter of 2019 is 1.5 percent on September 4, down from 1.7 percent on September 3 [Sept 4 estimate]CR Note: These early estimates suggest real GDP growth will be around 1.5% to 2.0% annualized in Q3.
Comments on August Employment Report
by Calculated Risk on 9/06/2019 09:14:00 AM
The headline jobs number at 105 thousand for August ex-Census (130K total including temp Census hires) was well below consensus expectations of 158 thousand, and the previous two months were revised down 20 thousand, combined. The unemployment rate was unchanged at 3.7%. There was good news with the increase in the participation rate and employment-population ratio. But overall this was a disappointing employment report. Note: See: How to Report the Monthly Employment Number excluding Temporary Census Hiring
Earlier: August Employment Report: 105,000 Jobs Added Ex-Census, 3.7% Unemployment Rate
In August, the year-over-year employment change was 2.074 million jobs including Census hires (note: this will be revised down significantly in February with the benchmark revision).
Average Hourly Earnings
Wage growth was at expectations. From the BLS:
"In August, average hourly earnings for all employees on private nonfarm payrolls rose by 11 cents to $28.11, following 9-cent gains in both June and July. Over the past 12 months, average hourly earnings have increased by 3.2 percent."
 This graph is based on “Average Hourly Earnings” from the Current Employment Statistics (CES) (aka "Establishment") monthly employment report. Note: There are also two quarterly sources for earnings data: 1) “Hourly Compensation,” from the BLS’s Productivity and Costs; and 2) the Employment Cost Index which includes wage/salary and benefit compensation.
The graph shows the nominal year-over-year change in "Average Hourly Earnings" for all private employees. Nominal wage growth was at 3.2% YoY in August.
Wage growth had been generally trending up, but has weakened recently.
Prime (25 to 54 Years Old) Participation
 Since the overall participation rate has declined due to cyclical (recession) and demographic (aging population, younger people staying in school) reasons, here is the employment-population ratio for the key working age group: 25 to 54 years old.
In the earlier period the participation rate for this group was trending up as women joined the labor force. Since the early '90s, the participation rate moved more sideways, with a downward drift starting around '00 - and with ups and downs related to the business cycle.
The 25 to 54 participation rate increased in August to 82.6% from 82.0% in July, and the 25 to 54 employment population ratio was increased to 80.0% from 79.5%.
Part Time for Economic Reasons
 From the BLS report:
"The number of persons employed part time for economic reasons (sometimes referred to as involuntary part-time workers) increased by 397,000 to 4.4 million in August; this increase follows a decline of similar magnitude in July. These individuals, who would have preferred full-time employment, were working part time because their hours had been reduced or they were unable to find full-time jobs."The number of persons working part time for economic reasons increased in August to 4.381 million from 3.984 million in July. The number of persons working part time for economic reason has been generally trending down.
These workers are included in the alternate measure of labor underutilization (U-6) that increased to 7.2% in August.
Unemployed over 26 Weeks
 This graph shows the number of workers unemployed for 27 weeks or more.
 According to the BLS, there are 1.243 million workers who have been unemployed for more than 26 weeks and still want a job. This was up from 1.166 million in July.
Summary:
The headline jobs number was well below expectations, and the previous two months were revised down. The headline unemployment rate was unchanged at 3.7%. Wage growth was at expectations.
Some good news is the participation rate and employment-population rate increased.
Overall this was a disappointing jobs report. The economy added 1.239 million jobs through August 2019 ex-Census, down from 1.871 million jobs during the same period of 2018 (although 2018 will be revised down with benchmark revision to be released in February 2020). So job growth has slowed.
August Employment Report: 105,000 Jobs Added Ex-Census, 3.7% Unemployment Rate
by Calculated Risk on 9/06/2019 08:44:00 AM
From the BLS:
Total nonfarm payroll employment rose by 130,000 in August, and the unemployment rate was unchanged at 3.7 percent, the U.S. Bureau of Labor Statistics reported today. Employment in federal government rose, largely reflecting the hiring of temporary workers for the 2020 Census. Notable job gains also occurred in health care and financial activities, while mining lost jobs.
...
In August, employment in federal government increased by 28,000. The gain was mostly due to the hiring of 25,000 temporary workers to prepare for the 2020 Census.
The change in total nonfarm payroll employment for June was revised down by 15,000 from +193,000 to +178,000, and the change for July was revised down by 5,000 from +164,000 to +159,000. With these revisions, employment gains in June and July combined were 20,000 less than previously reported.
...
In August, average hourly earnings for all employees on private nonfarm payrolls rose by 11 cents to $28.11, following 9-cent gains in both June and July. Over the past 12 months, average hourly earnings have increased by 3.2 percent.
emphasis added
 Click on graph for larger image.
The first graph shows the monthly change in payroll jobs, ex-Census (meaning the impact of the decennial Census temporary hires and layoffs is removed - mostly in 2010 - to show the underlying payroll changes).
Total payrolls increased by 105 thousand in August ex-Census (private payrolls increased 96 thousand).
Payrolls for June and July were revised down 20 thousand combined.
 This graph shows the year-over-year change in total non-farm employment since 1968.
In August, the year-over-year change was 2.074 million jobs.
The third graph shows the employment population ratio and the participation rate.
 The Labor Force Participation Rate was increased in August to 62.9%. This is the percentage of the working age population in the labor force. A large portion of the recent decline in the participation rate is due to demographics and long term trends.
The Employment-Population ratio increased to 60.9% (black line).
I'll post the 25 to 54 age group employment-population ratio graph later.
 The fourth graph shows the unemployment rate.
 The unemployment rate was unchanged in August at 3.7%.
This was well below consensus expectations of 158,000 jobs added, and June and July were revised down by 41,000 combined.
I'll have much more later ...
Thursday, September 05, 2019
Friday: Employment Report, Fed Chair Powell Speaks
by Calculated Risk on 9/05/2019 07:57:00 PM
Friday:
• At 8:30 AM: Employment Report for August. The consensus is for an increase of 158,000 non-farm payroll jobs in August, down from the 164,000 non-farm payroll jobs added in July. The consensus is for the unemployment rate to be unchanged at 3.7%.
• At 12:30 PM: Discussion with Fed Chair Jerome Powell, Economic Outlook and Monetary Policy, Discussion with Thomas J. Jordan, Chairman of the Swiss National Bank, hosted by the Swiss Institute of International Studies, University of Zurich, Zurich, Switzerland
Goldman: August Payrolls Preview
by Calculated Risk on 9/05/2019 04:52:00 PM
A few brief excerpts from a note by Goldman Sachs economist Spencer Hill:
We estimate nonfarm payrolls increased 150k in August … Our forecast reflects a 15-20k boost from Census canvassing activities, but a slower underlying pace of private-sector job gains in part reflecting the return of the trade war. …CR Note: It will be important to adjust for decennial Census hiring. Ex-Census the Goldman forecast is for 130K to 135K jobs.
We estimate the unemployment rate was unchanged at 3.7%. … We estimate average hourly earnings increased 0.2% month-over-month—a tenth below consensus—and we expect the year-over-year rate to fall by two tenths to 3.0%.
emphasis added
August Employment Preview
by Calculated Risk on 9/05/2019 12:27:00 PM
Special Note on Decennial Census: Temporary Decennial Census hiring will probably impact the August employment report with the Census hiring as many as 40,000 temporary workers. The headline number should be adjusted for these hires, see: How to Report the Monthly Employment Number excluding Temporary Census Hiring
On Friday at 8:30 AM ET, the BLS will release the employment report for July. The consensus is for an increase of 158,000 non-farm payroll jobs in August, and for the unemployment rate to be unchanged at 3.7%.
Last month, the BLS reported 164,000 jobs added in July.
Here is a summary of recent data:
• The ADP employment report showed an increase of 195,000 private sector payroll jobs in August. This was above consensus expectations of 150,000 private sector payroll jobs added. The ADP report hasn't been very useful in predicting the BLS report for any one month, but in general, this suggests employment growth above expectations.
• The ISM manufacturing employment index decreased in August to 47.4%. A historical correlation between the ISM manufacturing employment index and the BLS employment report for manufacturing, suggests that private sector BLS manufacturing payroll decreased 35,000 in August. The ADP report indicated manufacturing jobs increased 8,000 in August.
The ISM non-manufacturing employment index decreased in August to 53.1%. A historical correlation between the ISM non-manufacturing employment index and the BLS employment report for non-manufacturing, suggests that private sector BLS non-manufacturing payroll increased 155,000 in August.
Combined, the ISM surveys suggest employment gains at 120,000 suggesting gains below consensus expectations.
• Initial weekly unemployment claims averaged 216,000 in August, up from 212,000 in July. For the BLS reference week (includes the 12th of the month), initial claims were at 211,000, down from 216,000 during the reference week the previous month.
This suggest employment growth close to expectations.
• The final August University of Michigan consumer sentiment index decreased sharply to 89.8 from the July reading of 98.4. Sentiment is frequently coincident with changes in the labor market, but there are other factors too like gasoline prices and politics.
• The BofA job tracker was weak in August suggesting 102K jobs added in August.
• Conclusion: The ISM employment indexes were weak in August, especially the manufacturing index. However the ADP employment suggests a report above the consensus. Employment reports for August are frequently revised up, suggesting the initial report will be lower than expectations. Also the BofA jobs tracker was especially weak in August, and consumer sentiment decreased significantly.
My guess is the jobs number (ex-Census hiring) will be below expectations.
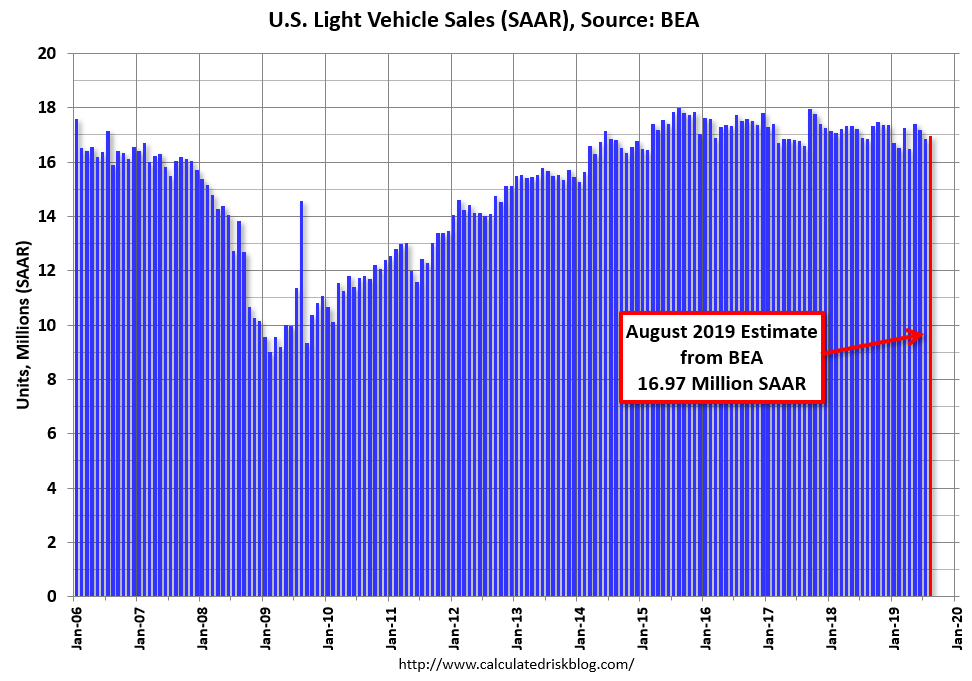
BEA: August Vehicles Sales increased to 17.0 Million SAAR
by Calculated Risk on 9/05/2019 11:30:00 AM
The BEA released their estimate of August vehicle sales this morning. The BEA estimated sales of 16.97 million SAAR in August 2019 (Seasonally Adjusted Annual Rate), up 0.7%% from the July sales rate, and up 0.7% from August2018.
Sales in 2019 are averaging 16.9 million (average of seasonally adjusted rate), down 1.2% compared to the same period in 2018.
 Click on graph for larger image.
This graph shows light vehicle sales since 2006 from the BEA (blue) and an estimate for July (red).
A small decline in sales to date this year isn't a concern - I think sales will move mostly sideways at near record levels.
This means the economic boost from increasing auto sales is over (from the bottom in 2009, auto sales boosted growth every year through 2016).
 The second graph shows light vehicle sales since the BEA started keeping data in 1967.
Note: dashed line is current estimated sales rate of 16.97 million SAAR.


