by Calculated Risk on 8/13/2019 08:44:00 AM
Tuesday, August 13, 2019
Small Business Optimism Index Increased in July
CR Note: Most of this survey is noise, but there is some information, especially on the labor market and the "Single Most Important Problem".
From the National Federation of Independent Business (NFIB): July 2019 Report: Small Business Optimism Index
The Optimism Index rose 1.4 points to 104.7, an exceptional reading. Seven of the 10 components advanced, two fell, and one was unchanged.
..
Job creation slowed in July, falling to an average addition of 0.12 workers per firm on average. Finding qualified workers is becoming increasingly difficult with a 46-year record high of 26 percent reporting finding qualified workers as their number one problem.
emphasis added
 Click on graph for larger image.
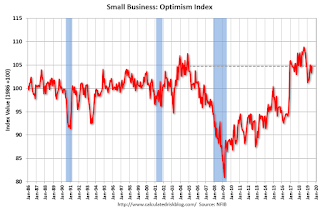
This graph shows the small business optimism index since 1986.
The index increased to 104.7 in July.
Note: Usually small business owners complain about taxes and regulations (currently 2nd and 3rd on the "Single Most Important Problem" list). However, during the recession, "poor sales" was the top problem. Now the difficulty of finding qualified workers is the top problem.
BLS: CPI increased 0.3% in July, Core CPI increased 0.3%
by Calculated Risk on 8/13/2019 08:32:00 AM
The Consumer Price Index for All Urban Consumers (CPI-U) increased 0.3 percent in July on a seasonally adjusted basis after rising 0.1 percent in June, the U.S. Bureau of Labor Statistics reported today. Over the last 12 months, the all items index increased 1.8 percent before seasonal adjustment.Inflation was above expectations in July. I'll post a graph later today after the Cleveland Fed releases the median and trimmed-mean CPI.
...
The index for all items less food and energy rose 0.3 in July, the same increase as in June. The July rise was broad-based, with increases in the indexes for shelter, medical care, airline fares, household furnishings and operations, apparel, and personal care all contributing to the increase.
...
The all items index increased 1.8 percent for the 12 months ending July, a larger increase than the 1.6-percent rise for the period ending June. The index for all items less food and energy rose 2.2 percent over the last 12 months, slightly more than the 2.1-percent increase for the period ending June.
emphasis added
Monday, August 12, 2019
Tuesday: CPI, Q2 Quarterly Report on Household Debt and Credit
by Calculated Risk on 8/12/2019 07:07:00 PM
From Matthew Graham at Mortgage News Daily: Mortgage Rates Miraculously Flat Despite Massively Lower Treasury Yields
Mortgage rates were unchanged to slightly higher today ... despite a substantial drop in Treasury yields, mortgage rates are stuck in the mud. [Most Prevalent Rates 30YR FIXED - 3.625% - 3.75%]Tuesday:
emphasis added
• At 6:00 AM ET, NFIB Small Business Optimism Index for July.
• At 8:30 AM, The Consumer Price Index for July from the BLS. The consensus is for a 0.2% increase in CPI, and a 0.2% increase in core CPI.
• At 11:00 AM, NY Fed: Q2 Quarterly Report on Household Debt and Credit
Census Bureau to Hire "about 40,000" Temp Workers Now
by Calculated Risk on 8/12/2019 03:27:00 PM
CR Note: This will impact the August employment report. See: How to Report the Monthly Employment Number excluding Temporary Census Hiring
From the Census Bureau: U.S. Census Bureau Announces the Start of First Major Field Operation for 2020 Census
Today, the U.S. Census Bureau briefed the media on the launch of address canvassing, the first major field operation of the 2020 Census. Address canvassing improves and refines the Census Bureau’s address list of households nationwide, which is necessary to deliver invitations to respond to the census. The address list plays a vital role in ensuring a complete and accurate count of everyone living in the United States.
“The Census Bureau is dedicated to ensuring that we are on track, and ready to accomplish the mission of the 2020 Census,” said Census Bureau Director Steven Dillingham. “We have made many improvements and innovations over the past decade, including better technologies for canvassing neighborhoods and developing complete and updated address listings and maps.”
The Census Bureau created new software called the Block Assessment, Research and Classification Application (BARCA). It compares satellite images of the United States over time, allowing Census Bureau employees to spot new housing developments, changes in existing homes and other housing units that did not previously exist. Reviewers also use BARCA to compare the number of housing units in current imagery with the number of addresses on file for each block.
“We were able to verify 65% of addresses using satellite imagery — a massive accomplishment for us,” said Census Bureau Geography Division Chief Deirdre Bishop during the briefing. “In 2010 we had to hire 150,000 people to verify 100% of the addresses in the field, this decade we will only have to hire about 40,000 employees around the nation to verify the remaining 35% of addresses.”
emphasis added
LA area Port Traffic Down Year-over-year in July
by Calculated Risk on 8/12/2019 12:49:00 PM
Special note: The expansion to the Panama Canal was completed in 2016 (As I noted a few years ago), and some of the traffic that used the ports of Los Angeles and Long Beach is probably going through the canal. This might be impacting TEUs on the West Coast.
Container traffic gives us an idea about the volume of goods being exported and imported - and usually some hints about the trade report since LA area ports handle about 40% of the nation's container port traffic.
The following graphs are for inbound and outbound traffic at the ports of Los Angeles and Long Beach in TEUs (TEUs: 20-foot equivalent units or 20-foot-long cargo container).
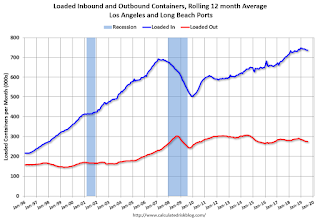
To remove the strong seasonal component for inbound traffic, the first graph shows the rolling 12 month average.

On a rolling 12 month basis, inbound traffic was up slightly in July compared to the rolling 12 months ending in June. Outbound traffic was down 0.4% compared to the rolling 12 months ending the previous month.
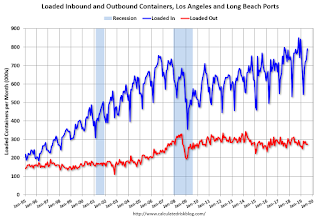
The 2nd graph is the monthly data (with a strong seasonal pattern for imports).

In general imports have been increasing, and exports have mostly moved sideways over the last 8 years.
AAR: July Rail Carloads down 4.8% YoY, Intermodal Down 6.1% YoY
by Calculated Risk on 8/12/2019 09:25:00 AM
From the Association of American Railroads (AAR) Rail Time Indicators. Graphs and excerpts reprinted with permission.
Continuing economic uncertainty, fueled in great measure by ongoing trade disputes and worrisome economic weakness around the globe — combined with low natural gas prices and the shift from coalfired electricity in the United States — to produce another month of disappointing rail traffic in Mexico and the United States, while Canada achieved moderate growth in its intermodal traffic. Carload and intermodal traffic fell by 4.8% and 6.1%, respectively, in the United States in July versus July 2018.
emphasis added
 Click on graph for larger image.
This graph from the Rail Time Indicators report shows U.S. average weekly rail carloads (NSA).
Rail carloads have been weak over the last decade due to the decline in coal shipments.
Total carloads originated by U.S. railroads in July 2019 were 1.26 million, down 64,406 carloads (4.8%) from the previous July. Since January’s modest 1.7% increase, U.S. railroads have faced year over-year declines each month — producing a total shortfall of more than 280,000 carloads over the past six months.…
For the year to date, U.S. carloads were 7.82 million in 2019, down 259,574 carloads (3.2%), from the first seven months of 2018. Coal alone was down 158,573 carloads — while crushed stone, sand, and gravel was off by 65,262 carloads, and grain dropped 34,600 carloads (grain mill products fell too, by about 14,000 carloads).
 The second graph is for intermodal traffic (using intermodal or shipping containers):
U.S. intermodal originations totaled 1.31 million containers and trailers in July 2019, down 84,878 units from July 2018. The 6.1% decline was the sixth straight monthly decline on a year-over-year basis.
For the first seven months of 2019, intermodal was down 314,125 units (3.7%). Though the decline from 2018 is significant, U.S. intermodal volume through July of this year was higher than every year except 2018 — so the current pace is not as slow as it feels. Intermodal traffic was especially strong during the last five months of 2018, which will make for challenging comps for the remainder of 2019.
Sunday, August 11, 2019
Goldman: "A Bigger Growth Hit from the Trade War"
by Calculated Risk on 8/11/2019 04:51:00 PM
A few brief excerpts from a Goldman Sachs research note:
We expect tariffs targeting the remaining $300bn of US imports from China to go into effect and no longer expect a trade deal before the 2020 election. …CR Note: This isn't enough drag to take the economy into recession, but the trade war appears to be slowing growth. Also, the Fed can't offset all of the negative impacts of the trade war.
Overall, we have increased our estimate of the growth impact of the trade war. In our baseline policy scenario, we now estimate a peak cumulative drag on the level of GDP of 0.6%, including a 0.2% drag from the latest escalation. The drivers of this modest change are that we now include an estimate of the sentiment and uncertainty effects and that financial markets have responded notably to recent trade news. Based on our estimates, we have taken down our Q4 growth forecast by 0.2pp to 1.8% (qoq ar).
Saturday, August 10, 2019
Schedule for Week of August 11, 2019
by Calculated Risk on 8/10/2019 08:11:00 AM
The key reports this week are July CPI, Housing starts and Retail sales.
For manufacturing, the Industrial Production report and the August New York and Philly Fed manufacturing surveys will be released.
No major economic releases scheduled.
6:00 AM ET: NFIB Small Business Optimism Index for July.
8:30 AM: The Consumer Price Index for July from the BLS. The consensus is for a 0.2% increase in CPI, and a 0.2% increase in core CPI.
11:00 AM: NY Fed: Q2 Quarterly Report on Household Debt and Credit
7:00 AM ET: The Mortgage Bankers Association (MBA) will release the results for the mortgage purchase applications index.
8:30 AM: The initial weekly unemployment claims report will be released. The consensus is for 208 thousand initial claims, down from 209 thousand last week.
 8:30 AM: Retail sales for July is scheduled to be released. The consensus is for 0.3% increase in retail sales.
This graph shows the year-over-year change in retail sales and food service (ex-gasoline) since 1993. Retail and Food service sales, ex-gasoline, increased by 3.9% on a YoY basis in June.
8:30 AM: The New York Fed Empire State manufacturing survey for August. The consensus is for a reading of 2.5, down from 4.3.
8:30 AM: the Philly Fed manufacturing survey for August. The consensus is for a reading of 11.1, down from 21.8.
 9:15 AM: The Fed will release Industrial Production and Capacity Utilization for July.
This graph shows industrial production since 1967.
The consensus is for a 0.1% increase in Industrial Production, and for Capacity Utilization to decrease to 77.8%.
10:00 AM: The August NAHB homebuilder survey. The consensus is for a reading of 66, up from 65. Any number above 50 indicates that more builders view sales conditions as good than poor.
 8:30 AM ET: Housing Starts for July.
 This graph shows single and total housing starts since 1968.
The consensus is for 1.260 million SAAR, up from 1.253 million SAAR in June.
10:00 AM: University of Michigan's Consumer sentiment index (Preliminary for August).
10:00 AM: State Employment and Unemployment (Monthly) for July 2019
Friday, August 09, 2019
Vehicle Sales: Fleet Turnover Ratio
by Calculated Risk on 8/09/2019 03:50:00 PM
Back in early 2009, I wrote a couple of posts arguing there would be an increase in auto sales - Vehicle Sales (Jan 2009) and Looking for the Sun (Feb 2009). This was an out-of-the-consensus call and helped me call the bottom for the US economy in mid-2009.
I wrote an update in 2014, and argued vehicle sales would "mostly move sideways" for the next few years.
Here is another update to the U.S. fleet turnover graph.
This graph shows the total number of registered vehicles in the U.S. divided by the sales rate through July 2019 - and gives a turnover ratio for the U.S. fleet (this doesn't tell you the age or the composition of the fleet). Note: the number of registered vehicles is estimated for 2018 and 2019.
The wild swings in 2009 were due to the "cash for clunkers" program.

The estimated ratio for July close to 16 years - back to a more normal level.
Note: in 2009, I argued the turnover ratio would "probably decline to 15 or so eventually" and that happened.

The current sales rate is now close to the top (excluding one month spikes) of the '98/'06 auto boom.
Light vehicle sales were at a 16.8 million seasonally adjusted annual rate (SAAR) in July.
I continue to expect vehicle sales to mostly move sideways.
BEA: July Vehicles Sales decreased to 16.8 Million SAAR
by Calculated Risk on 8/09/2019 03:20:00 PM
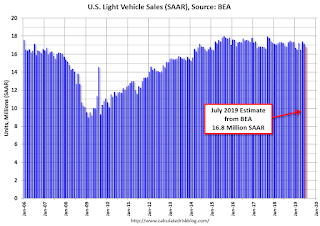
The BEA released their estimate of July vehicle sales on Tuesday. The BEA estimated sales of 16.82 million SAAR in July 2019 (Seasonally Adjusted Annual Rate), down 1.8% from the June sales rate, and down slightly from July 2018.
Sales in 2019 are averaging 16.9 million (average of seasonally adjusted rate), down 1.5% compared to the same period in 2018.

This graph shows light vehicle sales since 2006 from the BEA (blue) and an estimate for July (red).
A small decline in sales to date this year isn't a concern - I think sales will move mostly sideways at near record levels.
This means the economic boost from increasing auto sales is over (from the bottom in 2009, auto sales boosted growth every year through 2016).

Note: dashed line is current estimated sales rate of 16.82 million SAAR.


