 RSS Feed
 by Calculated Risk on 12/07/2018 10:00:00 AM
Friday, December 07, 2018
Comments on November Employment Report
The headline jobs number at 155 thousand for November was below consensus expectations of 190 thousand, and the previous two months were revised down 12 thousand, combined. The unemployment rate was unchanged at 3.7%. Still this was a decent report.
Earlier: November Employment Report: 155,000 Jobs Added, 3.7% Unemployment Rate
In November, the year-over-year employment change was 2.443 million jobs. This is solid year-over-year growth.
Seasonal Retail Hiring
Typically retail companies start hiring for the holiday season in October, and really increase hiring in November. Here is a graph that shows the historical net retail jobs added for October, November and December by year.
 Click on graph for larger image.
This graph really shows the collapse in retail hiring in 2008. Since then seasonal hiring has increased back close to more normal levels. Note: I expect the long term trend will be down with more and more internet holiday shopping.
Retailers hired 464 thousand workers (NSA) net in November. Note: this is NSA (Not Seasonally Adjusted).
Just like last year, there was a surge in seasonal hiring in November.
Average Hourly Earnings
Wage growth was close to expectations in November. From the BLS:
"In November, average hourly earnings for all employees on private nonfarm payrolls rose by 6 cents to $27.35. Over the year, average hourly earnings have increased by 81 cents, or 3.1 percent."
 This graph is based on “Average Hourly Earnings” from the Current Employment Statistics (CES) (aka "Establishment") monthly employment report. Note: There are also two quarterly sources for earnings data: 1) “Hourly Compensation,” from the BLS’s Productivity and Costs; and 2) the Employment Cost Index which includes wage/salary and benefit compensation.
The graph shows the nominal year-over-year change in "Average Hourly Earnings" for all private employees. Nominal wage growth was at 3.1% YoY in November.
Wage growth has generally been trending up.
Prime (25 to 54 Years Old) Participation
 Since the overall participation rate has declined due to cyclical (recession) and demographic (aging population, younger people staying in school) reasons, here is the employment-population ratio for the key working age group: 25 to 54 years old.
In the earlier period the participation rate for this group was trending up as women joined the labor force. Since the early '90s, the participation rate moved more sideways, with a downward drift starting around '00 - and with ups and downs related to the business cycle.
The 25 to 54 participation rate decreased in November to 82.2%, and the 25 to 54 employment population ratio was unchanged at 79.7%.
Part Time for Economic Reasons
 From the BLS report:
"The number of persons employed part time for economic reasons (sometimes referred to as involuntary part-time workers), at 4.8 million, changed little in November. These individuals, who would have preferred full-time employment, were working part time because their hours had been reduced or they were unable to find full-time jobs."The number of persons working part time for economic reasons has been generally trending down. The number increased in November. The number working part time for economic reasons suggests there is still a little slack in the labor market.
These workers are included in the alternate measure of labor underutilization (U-6) that increased to 7.6% in November. This is the highest level for U-6 since June.
Unemployed over 26 Weeks
 This graph shows the number of workers unemployed for 27 weeks or more.
 According to the BLS, there are 1.253 million workers who have been unemployed for more than 26 weeks and still want a job. This was down from 1.373 million in October.
Summary:
The headline jobs number was below expectations. The headline unemployment rate was unchanged at 3.7%, tying the previous two month for the lowest rate since 1969. And wage growth was at expectations, and above 3% YoY for the second consecutive month.
Overall, this was a decent report. For the first eleven months of 2018, job growth has been solid, averaging 206 thousand per month.
November Employment Report: 155,000 Jobs Added, 3.7% Unemployment Rate
by Calculated Risk on 12/07/2018 08:43:00 AM
From the BLS:
Total nonfarm payroll employment increased by 155,000 in November, and the unemployment rate remained unchanged at 3.7 percent, the U.S. Bureau of Labor Statistics reported today. Job gains occurred in health care, in manufacturing, and in transportation and warehousing.
...
The change in total nonfarm payroll employment for October was revised down from +250,000 to +237,000, and the change for September was revised up from +118,000 to +119,000. With these revisions, employment gains in September and October combined were 12,000 less than previously reported.
...
In November, average hourly earnings for all employees on private nonfarm payrolls rose by 6 cents to $27.35. Over the year, average hourly earnings have increased by 81 cents, or 3.1 percent.
emphasis added
 Click on graph for larger image.
The first graph shows the monthly change in payroll jobs, ex-Census (meaning the impact of the decennial Census temporary hires and layoffs is removed - mostly in 2010 - to show the underlying payroll changes).
Total payrolls increased by 155 thousand in November (private payrolls increased 161 thousand).
Payrolls for September and October were revised down 12 thousand combined.
 This graph shows the year-over-year change in total non-farm employment since 1968.
In November the year-over-year change was 2.443 million jobs.
The third graph shows the employment population ratio and the participation rate.
 The Labor Force Participation Rate was unchanged in November at 62.9%. This is the percentage of the working age population in the labor force. A large portion of the recent decline in the participation rate is due to demographics and long term trends.
The Employment-Population ratio was unchanged at 60.6% (black line).
I'll post the 25 to 54 age group employment-population ratio graph later.
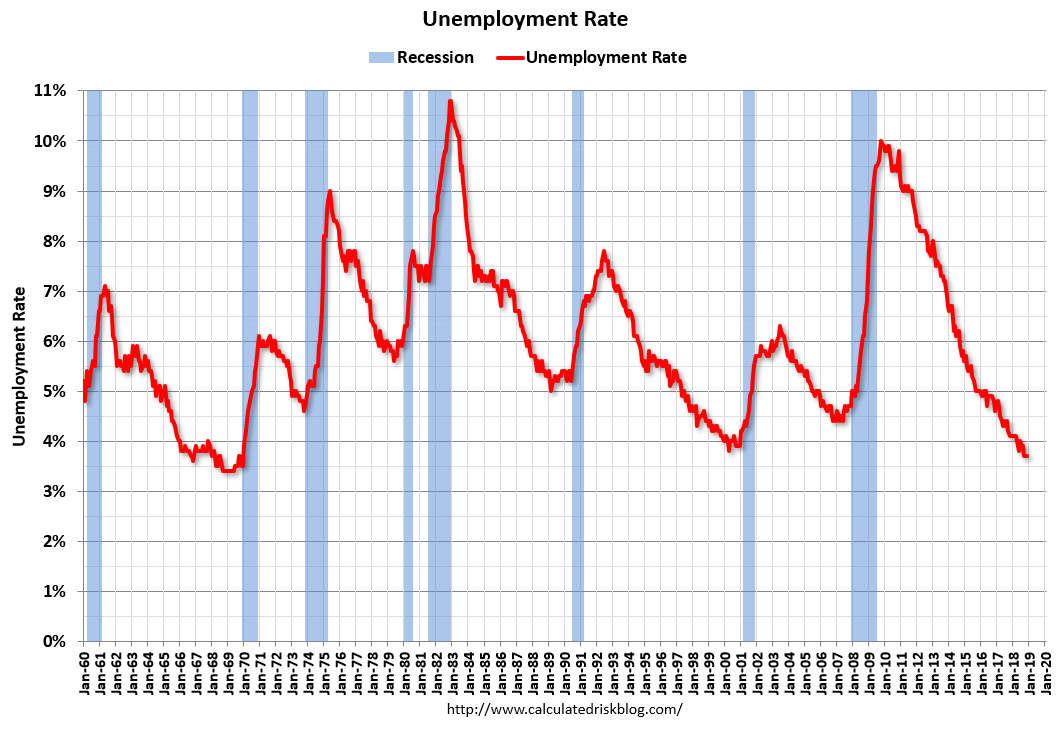 The fourth graph shows the unemployment rate.
 The unemployment rate was unchanged in November at 3.7%.
This was below the consensus expectations of 190,000 jobs added, and September and October were revised down, combined. Still a decent report.
I'll have much more later ...
Thursday, December 06, 2018
Friday: Employment Report
by Calculated Risk on 12/06/2018 08:29:00 PM
My November Employment Preview
Goldman: November Payrolls Preview
Friday:
• At 8:30 AM, Employment Report for November. The consensus is for 190,000 jobs added, and for the unemployment rate to be unchanged at 3.7%.
• At 10:00 AM, University of Michigan's Consumer sentiment index (Preliminary for December).
• At 3:00 PM, Consumer Credit from the Federal Reserve.
Las Vegas Real Estate in November: Sales Down 12% YoY, Inventory up 63% YoY
by Calculated Risk on 12/06/2018 06:26:00 PM
This is a key former distressed market to follow since Las Vegas saw the largest price decline, following the housing bubble, of any of the Case-Shiller composite 20 cities.
The Greater Las Vegas Association of Realtors reported Southern Nevada home prices level off heading into holidays; GLVAR housing statistics for November 2018
Southern Nevada home prices leveled off heading into the holidays, with more homes on the market and fewer properties changing hands. So says a report released Thursday by the Greater Las Vegas Association of REALTORS® (GLVAR).1) Overall sales were down 10.8% year-over-year from 3,202 in November 2017 to 3,335 in November 2018.
...
The total number of existing local homes, condos and townhomes sold during November was 2,857. Compared to one year ago, November sales were down 11.6 percent for homes and down 7.1 percent for condos and townhomes.
...
As for the number of local homes available for sale, Bishop said it’s still below what would be considered a balanced market but continued its recent rise to what is now a three-month housing supply. By the end of November, GLVAR reported 7,003 single-family homes listed for sale without any sort of offer. That’s up 54.3 percent from one year ago. For condos and townhomes, the 1,605 properties listed without offers in November represented a 118.4 percent jump from one year ago.
...
The number of so-called distressed sales continues to drop each year. GLVAR reported that short sales and foreclosures combined accounted for just 2.6 percent of all existing local property sales in November, down from just under 5 percent of all sales one year ago and 10.5 percent two years ago.
emphasis added
2) Active inventory (single-family and condos) is up sharply from a year ago, from a total of 5,273 in November 2017 to 8,608 in November 2018. Note: Total inventory was up 63.2% year-over-year. This is a significant increase in inventory.
3) Fewer distressed sales.
Goldman: November Payrolls Preview
by Calculated Risk on 12/06/2018 03:57:00 PM
A few brief excerpts from a note by Goldman Sachs economist Spencer Hill:
We estimate nonfarm payrolls increased 185k in November ... Our forecast reflects a 15-25k drag from winter storms, and given rising jobless claims and tighter financial conditions, the underlying pace of job growth may have also slowed somewhat. …
We expect the unemployment rate to remain at 3.7% in tomorrow’s report … We estimate average hourly earnings increased 0.3% month over month, with the year-over-year rate moving to a cycle high of 3.2%
emphasis added
November Employment Preview
by Calculated Risk on 12/06/2018 01:43:00 PM
On Friday at 8:30 AM ET, the BLS will release the employment report for November. The consensus is for an increase of 190,000 non-farm payroll jobs in November (with a range of estimates between 140,000 to 220,000), and for the unemployment rate to be unchanged at 3.7%.
Last month, the BLS reported 250,000 jobs added in October.
Here is a summary of recent data:
• The ADP employment report showed an increase of 179,000 private sector payroll jobs in November. This was slightly above consensus expectations of 175,000 private sector payroll jobs added. The ADP report hasn't been very useful in predicting the BLS report for any one month, but in general, this suggests employment growth close to expectations.
• The ISM manufacturing employment index increased in November to 58.4%. A historical correlation between the ISM manufacturing employment index and the BLS employment report for manufacturing, suggests that private sector BLS manufacturing payroll increased about 25,000 in November. The ADP report indicated manufacturing jobs increased 4,000 in November.
The ISM non-manufacturing employment index decreased in November to 58.4%. A historical correlation between the ISM non-manufacturing employment index and the BLS employment report for non-manufacturing, suggests that private sector BLS non-manufacturing payroll jobs increased well over 200,000 in November.
Combined, the ISM indexes suggest strong employment gains. This suggests employment growth well above expectations.
• Initial weekly unemployment claims averaged 228,000 in November, up from 214,000 in October. For the BLS reference week (includes the 12th of the month), initial claims were at 225,000, up from 210,000 during the reference week the previous month.
The increase during the reference week suggests a weaker employment report in November.
• The final November University of Michigan consumer sentiment index decreased to 97.5 from the October reading of 98.6. Sentiment is frequently coincident with changes in the labor market, but there are other factors too like gasoline prices and politics.
• Merrill Lynch has introduced a new payrolls tracker based on private internal BAC data. The tracker suggests private payrolls increased by 211,000 in November, and this suggests employment growth somewhat above expectations.
• Looking back at the three previous years:
In November 2017, the consensus was for 190,000 jobs, and the BLS reported 228,000 jobs added.
In November 2016, the consensus was for 170,000 jobs, and the BLS reported 178,000 jobs added.
In November 2015, the consensus was for 190,000 jobs, and the BLS reported 211,000 jobs added.
It appears the consensus is frequently a little low for November.
• Conclusion: These reports suggest a solid employment report in November, except for unemployment claims. My guess is the report will be at or above the consensus.
Fed's Flow of Funds: Household Net Worth increased in Q3
by Calculated Risk on 12/06/2018 12:53:00 PM
The Federal Reserve released the Q3 2018 Flow of Funds report today: Flow of Funds.
According to the Fed, household net worth increased in Q3 2018 to $109.0 Trillion, for $106.9 Trillion in Q2 2018:
The net worth of households and nonprofits rose to $109.0 trillion during the third quarter of 2018. The value of directly and indirectly held corporate equities increased $1.2 trillion and the value of real estate increased $0.2 trillion.The Fed estimated that the value of household real estate increased to $25.4 trillion in Q3. The value of household real estate is now above the bubble peak in early 2006 - but not adjusted for inflation, and this also includes new construction.
 Click on graph for larger image.
The first graph shows Households and Nonprofit net worth as a percent of GDP. Household net worth, as a percent of GDP, is higher than the peak in 2006 (housing bubble), and above the stock bubble peak.
This includes real estate and financial assets (stocks, bonds, pension reserves, deposits, etc) net of liabilities (mostly mortgages). Note that this does NOT include public debt obligations.
 This graph shows homeowner percent equity since 1952.
 Household percent equity (as measured by the Fed) collapsed when house prices fell sharply in 2007 and 2008.
In Q3 2018, household percent equity (of household real estate) was at 59.9% - up from Q2, and the highest since 2002. This was because of an increase in house prices in Q3 (the Fed uses CoreLogic).
Note: about 30.3% of owner occupied households had no mortgage debt as of April 2010. So the approximately 50+ million households with mortgages have far less than 59.9% equity - and about 2.2 million homeowners still have negative equity.
 The third graph shows household real estate assets and mortgage debt as a percent of GDP.
 Mortgage debt increased by $91 billion in Q3.
Mortgage debt has declined by $0.43 trillion from the peak. Studies suggest most of the decline in debt has been because of foreclosures (or short sales), but some of the decline is from homeowners paying down debt (sometimes so they can refinance at better rates).
The value of real estate, as a percent of GDP, declined slightly in Q3, and is above the average of the last 30 years (excluding bubble). However, mortgage debt as a percent of GDP, continues to decline.
ISM Non-Manufacturing Index increased to 60.7% in November
by Calculated Risk on 12/06/2018 10:04:00 AM
The November ISM Non-manufacturing index was at 60.7%, up from 60.3% in October. The employment index decreased in November to 58.4%, from 59.7%. Note: Above 50 indicates expansion, below 50 contraction.
From the Institute for Supply Management: November 2018 Non-Manufacturing ISM Report On Business®
Economic activity in the non-manufacturing sector grew in November for the 106th consecutive month, say the nation’s purchasing and supply executives in the latest Non-Manufacturing ISM® Report On Business®.
The report was issued today by Anthony Nieves, CPSM, C.P.M., A.P.P., CFPM, Chair of the Institute for Supply Management® (ISM®) Non-Manufacturing Business Survey Committee: “The NMI® registered 60.7 percent, which is 0.4 percentage point higher than the October reading of 60.3 percent. This represents continued growth in the non-manufacturing sector, at a slightly faster rate. The Non-Manufacturing Business Activity Index increased to 65.2 percent, 2.7 percentage points higher than the October reading of 62.5 percent, reflecting growth for the 112th consecutive month, at a faster rate in November. The New Orders Index registered 62.5 percent, 1 percentage point higher than the reading of 61.5 percent in October. The Employment Index decreased 1.3 percentage points in November to 58.4 percent from the October reading of 59.7 percent. The Prices Index rose 2.6 percentage points from the October reading of 61.7 percent to 64.3 percent, indicating that prices increased in November for the 33rd consecutive month. According to the NMI®, 17 non-manufacturing industries reported growth. The non-manufacturing sector continued to reflect strong growth in November. However, concerns persist about employment resources and the impact of tariffs. Respondents remain positive about current business conditions and the direction of the economy.”
emphasis added
 Click on graph for larger image.
This graph shows the ISM non-manufacturing index (started in January 2008) and the ISM non-manufacturing employment diffusion index.
This suggests slightly faster expansion in November than in October.
Trade Deficit increased to $55.5 Billion in October
by Calculated Risk on 12/06/2018 08:52:00 AM
From the Department of Commerce reported:
The U.S. Census Bureau and the U.S. Bureau of Economic Analysis announced today that the goods and services deficit was $55.5 billion in October, up $0.9 billion from $54.6 billion in September, revised.
October exports were $211.0 billion, $0.3 billion less than September exports. October imports were $266.5 billion, $0.6 billion more than September imports.
 Click on graph for larger image.
Exports decreased and imports increased in October.
Exports are 28% above the pre-recession peak and up 6% compared to October 2017; imports are 15% above the pre-recession peak, and up 9% compared to October 2017.
In general, trade has been picking up.
The second graph shows the U.S. trade deficit, with and without petroleum.
 The blue line is the total deficit, and the black line is the petroleum deficit, and the red line is the trade deficit ex-petroleum products.
Oil imports averaged $61.23 in October, down from $61.35 in September, and up from $47.27 in October 2017.
The trade deficit with China increased to $43.1 billion in October, from $35.2 billion in October 2017.
Weekly Initial Unemployment Claims decreased to 231,000
by Calculated Risk on 12/06/2018 08:33:00 AM
The DOL reported:
In the week ending December 1, the advance figure for seasonally adjusted initial claims was 231,000, a decrease of 4,000 from the previous week's revised level. The previous week's level was revised up by 1,000 from 234,000 to 235,000. The 4-week moving average was 228,000, an increase of 4,250 from the previous week's revised average. The previous week's average was revised up by 500 from 223,250 to 223,750.The previous week was revised up.
emphasis added
The following graph shows the 4-week moving average of weekly claims since 1971.
 Click on graph for larger image.
The dashed line on the graph is the current 4-week average. The four-week average of weekly unemployment claims increased to 228,000.
This was higher than the consensus forecast, and initial claims have increased recently. However the low level of claims suggest few layoffs.


