by Calculated Risk on 11/29/2018 08:33:00 AM
Thursday, November 29, 2018
Weekly Initial Unemployment Claims increased to 234,000
The DOL reported:
In the week ending November 24, the advance figure for seasonally adjusted initial claims was 234,000, an increase of 10,000 from the previous week's unrevised level of 224,000. The 4-week moving average was 223,250, an increase of 4,750 from the previous week's unrevised average of 218,500.The previous week was unrevised.
emphasis added
The following graph shows the 4-week moving average of weekly claims since 1971.
 Click on graph for larger image.
The dashed line on the graph is the current 4-week average. The four-week average of weekly unemployment claims increased to 223,250.
This was higher than the consensus forecast, and initial claims have increased recently. However the low level of claims suggest few layoffs.
Wednesday, November 28, 2018
Thursday: Unemployment Claims, Personal Income & Outlays, Pending Home Sales, FOMC Minutes
by Calculated Risk on 11/28/2018 08:01:00 PM
Thursday:
• At 8:30 AM ET, The initial weekly unemployment claims report will be released. The consensus is for 218 thousand initial claims, down from 224 thousand the previous week.
• At 8:30 AM, Personal Income and Outlays for October. The consensus is for a 0.4% increase in personal income, and for a 0.4% increase in personal spending. And for the Core PCE price index to increase 0.2%.
• At 10:00 AM, Pending Home Sales Index for October. The consensus is for a 0.5% increase in the index.
• At 2:00 PM, The Fed will release the FOMC Minutes for the Meeting of November 7-8, 2018
Chemical Activity Barometer Declines in November
by Calculated Risk on 11/28/2018 04:35:00 PM
Note: This appears to be a leading indicator for industrial production.
From the American Chemistry Council: Chemical Activity Barometer Adds to Signs U.S. Economy May Be Facing More Than a Seasonal Chill
The Chemical Activity Barometer (CAB), a leading economic indicator created by the American Chemistry Council (ACC), posted a 0.3 percent decline in November on a three-month moving average (3MMA) basis. This marks the barometer’s first month-over-month drop since February 2016 and adds to the chorus of growing concern of slowing U.S economic expansion. On a year-over-year basis the barometer is up 2.8 percent (3MMA), a marked slowdown in the pace of growth from earlier this year.
...
Applying the CAB back to 1912, it has been shown to provide a lead of two to fourteen months, with an average lead of eight months at cycle peaks as determined by the National Bureau of Economic Research. The median lead was also eight months. At business cycle troughs, the CAB leads by one to seven months, with an average lead of four months. The median lead was three months. The CAB is rebased to the average lead (in months) of an average 100 in the base year (the year 2012 was used) of a reference time series. The latter is the Federal Reserve’s Industrial Production Index.
emphasis added
 Click on graph for larger image.
This graph shows the year-over-year change in the 3-month moving average for the Chemical Activity Barometer compared to Industrial Production. It does appear that CAB (red) generally leads Industrial Production (blue).
The year-over-year increase in the CAB has softened recently, suggesting further gains in industrial production into 2019, but at a slower pace.
Richmond Fed: "Fifth District Manufacturing Activity Grew Moderately in November"
by Calculated Risk on 11/28/2018 01:27:00 PM
Earlier from the Richmond Fed: Fifth District Manufacturing Activity Grew Moderately in November
Fifth District manufacturing activity grew moderately in November, according to results of the most recent survey from the Federal Reserve Bank of Richmond. The composite index slipped from 15 in October to 14 in November, pulled down by drops in the indexes for new orders and employment, while the other component, the index for shipments, rose. However, all three continued to reflect expansion, as did most other measures of manufacturing activity. Firms were optimistic, expecting growth to continue in the next six months.This was the last of the regional Fed surveys for November.
While survey results suggested growth in employment and wages among manufacturing firms in November, the struggle to find workers with the required skills persisted.
emphasis added
Here is a graph comparing the regional Fed surveys and the ISM manufacturing index:
 Click on graph for larger image.
The New York and Philly Fed surveys are averaged together (yellow, through November), and five Fed surveys are averaged (blue, through November) including New York, Philly, Richmond, Dallas and Kansas City. The Institute for Supply Management (ISM) PMI (red) is through October (right axis).
Based on these regional surveys, it seems likely the ISM manufacturing index will decline slightly, but remain solid in November (to be released on Monday, December 3rd).
Fed Chair Powell: The Federal Reserve's Framework for Monitoring Financial Stability
by Calculated Risk on 11/28/2018 12:04:00 PM
From Fed Chair Powell: The Federal Reserve's Framework for Monitoring Financial Stability
Interest rates are still low by historical standards, and they remain just below the broad range of estimates of the level that would be neutral for the economy‑‑that is, neither speeding up nor slowing down growth. My FOMC colleagues and I, as well as many private-sector economists, are forecasting continued solid growth, low unemployment, and inflation near 2 percent.CR note: This seems pretty consistent with prior comments.
A few Comments on October New Home Sales
by Calculated Risk on 11/28/2018 11:01:00 AM
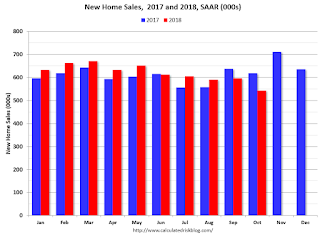
New home sales for October were reported at 544,000 on a seasonally adjusted annual rate basis (SAAR). This was below the consensus forecast, however the three previous months were revised up significantly. Although weak, this was only a little below the initial report for September of 553,000 (now revised up to 597,000).
Sales in October were down 12.0% year-over-year compared to October 2017. The largest declines were in the Northeast, possibly due to a combination of higher interest rates and changes in the tax law.
On Inventory: Months of inventory is now above the top of the normal range, however the number of units completed and under construction is still somewhat low. Inventory will be something to watch very closely.
Earlier: New Home Sales decrease to 544,000 Annual Rate in October.

This graph shows new home sales for 2017 and 2018 by month (Seasonally Adjusted Annual Rate).
Sales are only up 2.8% through October compared to the same period in 2017.
And the comparison in November will be very difficult (Sales in November 2017 were strong). And sales might finish the year down from 2017,.
This is below my forecast for 2018 for an increase of about 6% over 2017. As I noted early this year, there were downside risks to that forecast, primarily higher mortgage rates, but also higher costs (labor and material), the impact of the new tax law, and other possible policy errors.
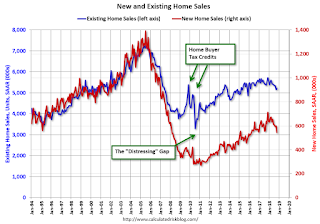
And here is another update to the "distressing gap" graph that I first started posting a number of years ago to show the emerging gap caused by distressed sales. Now I'm looking for the gap to close over the next several years.

Following the housing bubble and bust, the "distressing gap" appeared mostly because of distressed sales. The gap has persisted even though distressed sales are down significantly, since new home builders focused on more expensive homes.
I still expect this gap to slowly close. However, this assumes that the builders will offer some smaller, less expensive homes. If not, then the gap will persist.
Note: Existing home sales are counted when transactions are closed, and new home sales are counted when contracts are signed. So the timing of sales is different.
New Home Sales decrease to 544,000 Annual Rate in October
by Calculated Risk on 11/28/2018 10:14:00 AM
The Census Bureau reports New Home Sales in October were at a seasonally adjusted annual rate (SAAR) of 544 thousand.
The previous three months were revised up significantly.
"Sales of new single‐family houses in October 2018 were at a seasonally adjusted annual rate of 544,000, according to estimates released jointly today by the U.S. Census Bureau and the Department of Housing and Urban Development. This is 8.9 percent below the revised September rate of 597,000 and is 12.0 percent below the October 2017 estimate of 618,000. "
emphasis added
 Click on graph for larger image.
The first graph shows New Home Sales vs. recessions since 1963. The dashed line is the current sales rate.
Even with the increase in sales over the last several years, new home sales are still somewhat low historically.
The second graph shows New Home Months of Supply.
 The months of supply increased in October to 7.4 months from 6.5 months in September.
 The all time record was 12.1 months of supply in January 2009.
This is above the normal range (less than 6 months supply is normal).
"The seasonally‐adjusted estimate of new houses for sale at the end of October was 336,000. This represents a supply of 7.4 months at the current sales rate."
 On inventory, according to the Census Bureau:
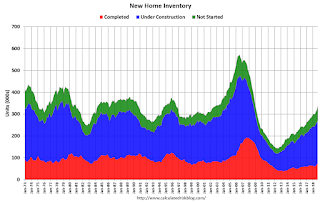
 "A house is considered for sale when a permit to build has been issued in permit-issuing places or work has begun on the footings or foundation in nonpermit areas and a sales contract has not been signed nor a deposit accepted."Starting in 1973 the Census Bureau broke this down into three categories: Not Started, Under Construction, and Completed.
The third graph shows the three categories of inventory starting in 1973.
The inventory of completed homes for sale is still somewhat low, and the combined total of completed and under construction is a little low.
 The last graph shows sales NSA (monthly sales, not seasonally adjusted annual rate).
In October 2018 (red column), 42 thousand new homes were sold (NSA). Last year, 49 thousand homes were sold in October.
The all time high for September was 105 thousand in 2005, and the all time low for October was 23 thousand in 2010.
This was well below expectations of 575,000 sales SAAR, however the previous months were revised up significantly. I'll have more later today.
Q3 GDP Unrevised at 3.5% Annual Rate
by Calculated Risk on 11/28/2018 08:34:00 AM
From the BEA: Gross Domestic Product, Third Quarter 2018 (Second Estimate); Corporate Profits, Third Quarter 2018 (Preliminary Estimate)
Real gross domestic product (GDP) increased at an annual rate of 3.5 percent in the third quarter of 2018, according to the "second" estimate released by the Bureau of Economic Analysis. In the second quarter, real GDP increased 4.2 percent.PCE growth was revised down from 4.0% to 3.6%. Residential investment was revised up from -4.0% to -2.6%. This was at the consensus forecast.
The GDP estimate released today is based on more complete source data than were available for the "advance" estimate issued last month. In the advance estimate, the increase in real GDP was also 3.5 percent. With this second estimate for the third quarter, the general picture of economic growth remains the same; upward revisions to nonresidential fixed investment and private inventory investment were offset by downward revisions to personal consumption expenditures (PCE) and state and local government spending.
emphasis added
Here is a Comparison of Second and Advance Estimates.
MBA: Mortgage Applications Increased in Latest Weekly Survey
by Calculated Risk on 11/28/2018 07:00:00 AM
From the MBA: Mortgage Applications Increase in Latest MBA Weekly Survey
Mortgage applications increased 5.5 percent from one week earlier, according to data from the Mortgage Bankers Association’s (MBA) Weekly Mortgage Applications Survey for the week ending November 23, 2018. This week’s results include an adjustment for the Thanksgiving holiday.
... The Refinance Index increased 1 percent from the previous week. The seasonally adjusted Purchase Index increased 9 percent from one week earlier. The unadjusted Purchase Index decreased 28 percent compared with the previous week and was 2 percent higher than the same week one year ago.
...
“After several weeks of market volatility, 30-year fixed mortgage rates decreased four basis points to 5.12 percent last week. Homebuyers responded, with purchase applications 1.7 percent higher than a year ago, and after adjusting for the Thanksgiving holiday, they increased almost 9 percent from the previous week,” said Mike Fratantoni, MBA’s Chief Economist. “The rise in purchase activity was led by conventional purchase applications, which surged almost 12 percent, while government purchases were essentially unchanged over the week. This also pushed the average loan size for purchase applications higher, which likely meant there were fewer first-time homebuyers in the market last week.”
...
The average contract interest rate for 30-year fixed-rate mortgages with conforming loan balances ($453,100 or less) decreased to 5.12 percent from 5.16 percent, with points decreasing to 0.46 from 0.48 (including the origination fee) for 80 percent loan-to-value ratio (LTV) loans.
emphasis added
 Click on graph for larger image.
The first graph shows the refinance index since 1990.
Refinance activity will not pick up significantly unless mortgage rates fall 50 bps or more from the recent level.
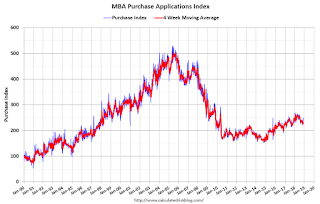
 The second graph shows the MBA mortgage purchase index
 According to the MBA, purchase activity is up 2% year-over-year.
Tuesday, November 27, 2018
Wednesday: New Home Sales, GDP, Fed Chair Powell, Richmond Fed Mfg Survey
by Calculated Risk on 11/27/2018 06:59:00 PM
Wednesday:
• At 7:00 AM ET, The Mortgage Bankers Association (MBA) will release the results for the mortgage purchase applications index.
• At 8:30 AM, Gross Domestic Product, 3nd quarter 2018 (Second estimate). The consensus is that real GDP increased 3.5% annualized in Q3, unchanged from the advance estimate of GDP.
• At 10:00 AM, New Home Sales for October from the Census Bureau. The consensus is for 575 thousand SAAR, up from 553 thousand in September.
• At 10:00 AM, Richmond Fed Survey of Manufacturing Activity for November. This is the last of the regional Fed manufacturing surveys for November.
• At 12:00 PM, Speech by Fed Chair Jerome Powell, The Federal Reserve's Framework for Monitoring Financial Stability, At The Economic Club of New York Signature Luncheon, New York, New York


