 RSS Feed
 by Calculated Risk on 8/27/2018 08:37:00 AM
Monday, August 27, 2018
Chicago Fed "Index points to a moderation in economic growth in July"
From the Chicago Fed: Index points to a moderation in economic growth in July
Led by slower growth in production-related indicators, the Chicago Fed National Activity Index (CFNAI) declined to +0.13 in July from +0.48 in June. Three of the four broad categories of indicators that make up the index decreased from June, but three of the four categories made positive contributions to the index in July. The index’s three-month moving average, CFNAI-MA3, moved down to +0.05 in July from +0.20 in June.This graph shows the Chicago Fed National Activity Index (three month moving average) since 1967.
emphasis added
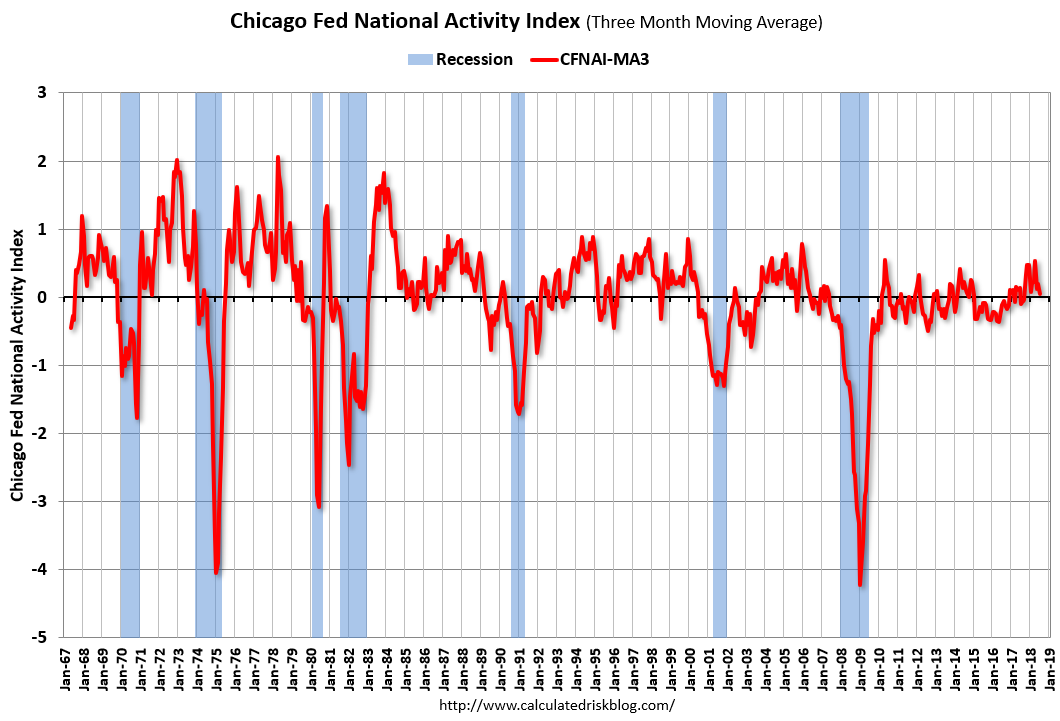 Click on graph for larger image.
This suggests economic activity was close to the historical trend in July (using the three-month average).
According to the Chicago Fed:
The index is a weighted average of 85 indicators of growth in national economic activity drawn from four broad categories of data: 1) production and income; 2) employment, unemployment, and hours; 3) personal consumption and housing; and 4) sales, orders, and inventories.
...
A zero value for the monthly index has been associated with the national economy expanding at its historical trend (average) rate of growth; negative values with below-average growth (in standard deviation units); and positive values with above-average growth.
Sunday, August 26, 2018
Sunday Night Futures
by Calculated Risk on 8/26/2018 07:40:00 PM
Weekend:
• Schedule for Week of Aug 26, 2018
Monday:
• At 8:30 AM ET, Chicago Fed National Activity Index for July. This is a composite index of other data.
• At 10:30 AM, Dallas Fed Survey of Manufacturing Activity for August.
From CNBC: Pre-Market Data and Bloomberg futures: S&P 500 are up 5 and DOW futures are up 62 (fair value).
Oil prices were up over the last week with WTI futures at $68.66 per barrel and Brent at $75.65 per barrel. A year ago, WTI was at $48, and Brent was at $52 - so oil prices are up about 40% year-over-year.
Here is a graph from Gasbuddy.com for nationwide gasoline prices. Nationally prices are at $2.83 per gallon. A year ago prices were at $2.36 per gallon - so gasoline prices are up 47 cents per gallon year-over-year.
New Home Prices
by Calculated Risk on 8/26/2018 08:11:00 AM
As part of the new home sales report released last week, the Census Bureau reported the number of homes sold by price and the average and median prices.
From the Census Bureau: "The median sales price of new houses sold in July 2018 was $328,700. The average sales price was $394,300."
The following graph shows the median and average new home prices.
 Click on graph for larger image.
During the housing bust, the builders had to build smaller and less expensive homes to compete with all the distressed sales. When housing started to recovery - with limited finished lots in recovering areas - builders moved to higher price points to maximize profits.
The average price in July 2018 was $394,300, and the median price was $328,700. Both are well above the bubble high (this is due to both a change in mix and rising prices).
The second graph shows the percent of new homes sold by price.
 About 2% of new homes sold were under $150K in July 2018. This is down from 30% in 2002. In general, the under $150K bracket is going away.
The $400K+ bracket has increased significantly since the housing recovery started. Still, a majority of new homes (about 60%) in the U.S., are in the $200K to $400K range.
Saturday, August 25, 2018
Schedule for Week of August 26, 2018
by Calculated Risk on 8/25/2018 08:11:00 AM
The key report this week is the second estimate of Q2 GDP.
Other key indicators include Personal Income and Outlays for July and Case-Shiller house prices for June.
For manufacturing, the Dallas and Richmond Fed manufacturing surveys will be released this week.
8:30 AM ET: Chicago Fed National Activity Index for July. This is a composite index of other data.
10:30 AM: Dallas Fed Survey of Manufacturing Activity for August.
 9:00 AM ET: S&P/Case-Shiller House Price Index for June.
This graph shows the nominal seasonally adjusted National Index, Composite 10 and Composite 20 indexes through the most recent report (the Composite 20 was started in January 2000).
The consensus is for a 6.5% year-over-year increase in the Comp 20 index for June.
10:00 AM ET: Richmond Fed Survey of Manufacturing Activity for August. This is the last of the regional surveys for August.
7:00 AM ET: The Mortgage Bankers Association (MBA) will release the results for the mortgage purchase applications index.
8:30 AM: Gross Domestic Product, 2nd quarter 2018 (Second estimate). The consensus is that real GDP increased 4.0% annualized in Q2, down from the advance estimate of 4.1%.
10:00 AM: Pending Home Sales Index for July. The consensus is for no change in the index.
8:30 AM: The initial weekly unemployment claims report will be released. The consensus is for 214 thousand initial claims, up from 210 thousand the previous week.
8:30 AM: Personal Income and Outlays for July. The consensus is for a 0.4% increase in personal income, and for a 0.4% increase in personal spending. And for the Core PCE price index to increase 0.2%.
9:45 AM: Chicago Purchasing Managers Index for August. The consensus is for a reading of 63.5, down from 65.5 in July.
10:00 AM: University of Michigan's Consumer sentiment index (Final for August). The consensus is for a reading of 95.3.
Friday, August 24, 2018
Oil Rigs: "Horizontal oil rigs roll off modestly"
by Calculated Risk on 8/24/2018 03:07:00 PM
A few comments from Steven Kopits of Princeton Energy Advisors LLC on August 24, 2018:
• Oil rigs let off again this week
• Total oil rigs fell, -9 to 860
• Horizontal oil rigs declined, -2 to 766
...
• Visual inspection suggests that rigs continue to roll off gently from here for the next several weeks.
 Click on graph for larger image.
CR note: This graph shows the US horizontal rig count by basin.
Graph and comments Courtesy of Steven Kopits of Princeton Energy Advisors LLC.
Q3 GDP Forecasts
by Calculated Risk on 8/24/2018 11:18:00 AM
From Goldman Sachs:
We lowered our Q3 GDP tracking estimate by one tenth to +3.1% (qoq ar). We also lowered our past-quarter tracking estimate for Q2 by one tenth to 3.9%" [Aug 22 estimate].From Merrill Lynch:
emphasis added
The data added 0.2pp to 3Q GDP tracking, bringing it up to 3.5%. 2Q tracking remains at 4.1%. [Aug 24 estimate].And from the Altanta Fed: GDPNow
The GDPNow model estimate for real GDP growth (seasonally adjusted annual rate) in the third quarter of 2018 is 4.6 percent on August 24, up from 4.3 percent on August 16. [Aug 24 estimate]From the NY Fed Nowcasting Report
The New York Fed Staff Nowcast for 2018:Q3 stands at 2.0%. [Aug 24 estimate]CR Note: Still a wide range, and it is early, but GDP in the 3s seems likely.
Fed Chair Powell: "Risk management suggests looking beyond inflation for signs of excesses"
by Calculated Risk on 8/24/2018 10:25:00 AM
Speech by Fed Chair Jerome Powell: Monetary Policy in a Changing Economy. A few excerpts:
Experience has revealed two realities about the relation between inflation and unemployment, and these bear directly on the two questions I started with. First, the stars are sometimes far from where we perceive them to be. In particular, we now know that the level of the unemployment rate relative to our real-time estimate of u* will sometimes be a misleading indicator of the state of the economy or of future inflation. Second, the reverse also seems to be true: Inflation may no longer be the first or best indicator of a tight labor market and rising pressures on resource utilization. Part of the reason inflation sends a weaker signal is undoubtedly the achievement of anchored inflation expectations and the related flattening of the Phillips curve. Whatever the cause, in the run-up to the past two recessions, destabilizing excesses appeared mainly in financial markets rather than in inflation. Thus, risk management suggests looking beyond inflation for signs of excesses.
...
Let me conclude by returning to the matter of navigating between the two risks I identified--moving too fast and needlessly shortening the expansion, versus moving too slowly and risking a destabilizing overheating. Readers of the minutes of FOMC meetings and other communications will know that our discussions focus keenly on the relative salience of these risks. The diversity of views on the FOMC is one of the great virtues of our system. Despite differing views on these questions and others, we have a long institutional tradition of finding common ground in coalescing around a policy stance.
I see the current path of gradually raising interest rates as the FOMC's approach to taking seriously both of these risks. While the unemployment rate is below the Committee's estimate of the longer-run natural rate, estimates of this rate are quite uncertain. The same is true of estimates of the neutral interest rate. We therefore refer to many indicators when judging the degree of slack in the economy or the degree of accommodation in the current policy stance. We are also aware that, over time, inflation has become much less responsive to changes in resource utilization.
While inflation has recently moved up near 2 percent, we have seen no clear sign of an acceleration above 2 percent, and there does not seem to be an elevated risk of overheating. This is good news, and we believe that this good news results in part from the ongoing normalization process, which has moved the stance of policy gradually closer to the FOMC's rough assessment of neutral as the expansion has continued. As the most recent FOMC statement indicates, if the strong growth in income and jobs continues, further gradual increases in the target range for the federal funds rate will likely be appropriate.
The economy is strong. Inflation is near our 2 percent objective, and most people who want a job are finding one. My colleagues and I are carefully monitoring incoming data, and we are setting policy to do what monetary policy can do to support continued growth, a strong labor market, and inflation near 2 percent.
emphasis added
2018 Jackson Hole Economic Policy Symposium Agenda
by Calculated Risk on 8/24/2018 08:27:00 AM
Note: the presented papers are usually posted to the Kansas City Fed's site fairly quickly. On twitter.
2018 Economic Policy Symposium: Changing Market Structures and Implications for Monetary Policy. Times listed on program are Mountain Standard Time.
From Merrill Lynch on Jackson Hole Symposium:
We expect the papers presented to be primarily academic in nature and of only marginal interest to the markets: this would be consistent with the recent shift away from using Jackson Hole as a forum for policy signaling.
However, two stories will swirl around the meetings. The first is the issue of Fed independence. ... We do not expect Chair Powell to discuss Fed independence in his speech at 10am today, and there will be no Q&A. …
The other issue of interest will be the Fed's tightening plans. In terms of policy rates, in our view the Fed has no reason to deviate from its pace of quarterly rate hikes unless either the macro data slow substantially or core inflation moves substantially higher. The more proximate concern is monetary policy implementation. Specifically, the Fed funds rate continues to move towards the upper bound of the Fed's target range. Mark Cabana has argued that this is because of bank demand for excess reserves in order to satisfy post-crisis regulatory requirements. The risk is that the Fed will have to stop unwinding its balance sheet earlier than the markets are expecting in order to keep the funds rate within the target range. The July / August meeting minutes mention that the Fed will address its operating framework in the fall.
emphasis added
Thursday, August 23, 2018
Friday: Fed Chair Powell Speech, Durable Goods
by Calculated Risk on 8/23/2018 07:22:00 PM
The schedule for the 2018 Jackson Hole Economic Policy Symposium will be released here.
Friday:
• At 8:30 AM ET, Durable Goods Orders for July from the Census Bureau. The consensus is for a 0.2% decrease in durable goods orders.
• At 10:00 AM, Speech by Fed Chair Jerome Powell, "Monetary Policy in a Changing Economy", At the Federal Reserve Bank of Kansas City Economic Policy Symposium, Jackson Hole, Wyo.
Black Knight: National Mortgage Delinquency Rate Decreased in July, Lowest Since March 2006
by Calculated Risk on 8/23/2018 02:59:00 PM
From Black Knight: Black Knight’s First Look: Increased Mortgage Cures in July Push Delinquencies to Lowest Level Since March 2006; Foreclosure Starts Rise 11 Percent
• Continued hurricane-related cure activity pushed delinquencies to their lowest level in more than 12 yearsAccording to Black Knight's First Look report for July, the percent of loans delinquent decreased 3.4% in July compared to June, and decreased 7.5% year-over-year.
• Foreclosure starts rose 11 percent over June’s 17-year low to 48,300, for the highest total in three months
• Though starts rose nationwide, foreclosure referrals in hurricane-affected areas of Texas increased by a higher-than-average 19 percent
• Fewer completions and an increase in starts caused foreclosure inventory to rise slightly in July, for just the second such increase in the past three years
• Improving delinquencies outweighed the slight increase in foreclosures, bringing the total non-current population (all loans 30 or more days delinquent or in active foreclosure) to a more than 12-year low
The percent of loans in the foreclosure process increased 0.7% in July and were down 27.3% over the last year.
Black Knight reported the U.S. mortgage delinquency rate (loans 30 or more days past due, but not in foreclosure) was 3.61% in July, down from 3.74% in June.
The percent of loans in the foreclosure process increased slightly in July to 0.57% (from 0.56% in June).
The number of delinquent properties, but not in foreclosure, is down 125,000 properties year-over-year, and the number of properties in the foreclosure process is down 105,000 properties year-over-year.
| Black Knight: Percent Loans Delinquent and in Foreclosure Process | ||||
|---|---|---|---|---|
| July 2018 | June 2018 | July 2017 | July 2016 | |
| Delinquent | 3.61% | 3.74% | 3.90% | 4.51% |
| In Foreclosure | 0.57% | 0.56% | 0.78% | 1.09% |
| Number of properties: | ||||
| Number of properties that are delinquent, but not in foreclosure: | 1,861,000 | 1,925,000 | 1,986,000 | 2,286,000 |
| Number of properties in foreclosure pre-sale inventory: | 293,000 | 291,000 | 398,000 | 550,000 |
| Total Properties | 2,154,000 | 2,216,000 | 2,384,000 | 2,836,000 |


