by Calculated Risk on 8/05/2018 11:53:00 AM
Sunday, August 05, 2018
Employment: July Diffusion Indexes
I haven't posted this in a few months.
The BLS diffusion index for total private employment was at 64.0 in July, down from 67.4 in June.
For manufacturing, the diffusion index was at 65.1, down from 67.8 in June.
Note: Any reading above 60 is very good.
Think of this as a measure of how widespread job gains are across industries. The further from 50 (above or below), the more widespread the job losses or gains reported by the BLS. From the BLS:
Figures are the percent of industries with employment increasing plus one-half of the industries with unchanged employment, where 50 percent indicates an equal balance between industries with increasing and decreasing employment.
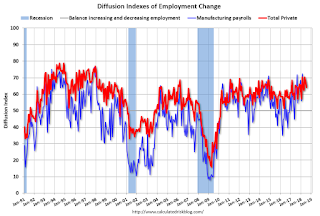 Overall both total private and manufacturing job growth was widespread again in July.
Saturday, August 04, 2018
Schedule for Week of August 5, 2018
by Calculated Risk on 8/04/2018 08:11:00 AM
The key economic report this week is the July Consumer Price Index (CPI) on Friday.
No major economic releases scheduled.
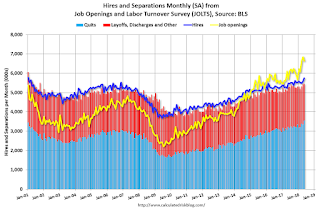 10:00 AM ET: Job Openings and Labor Turnover Survey for June from the BLS.
 This graph shows job openings (yellow line), hires (purple), Layoff, Discharges and other (red column), and Quits (light blue column) from the JOLTS.
Jobs openings decreased in May to 6.638 million from 6.840 million in April.
The number of job openings (yellow) were up 16.7% year-over-year, and Quits were up 10.4% year-over-year.
3:00 PM: Consumer Credit from the Federal Reserve. The consensus is for consumer credit to increase $16.0 billion in June.
7:00 AM ET: The Mortgage Bankers Association (MBA) will release the results for the mortgage purchase applications index.
8:30 AM: The initial weekly unemployment claims report will be released. The consensus is for 220 thousand initial claims, up from 218 thousand the previous week.
8:30 AM: The Producer Price Index for July from the BLS. The consensus is a 0.3% increase in PPI, and a 0.3% increase in core PPI.
8:30 AM: The Consumer Price Index for July from the BLS. The consensus is for a 0.2% increase in CPI, and a 0.2% increase in core CPI.
Friday, August 03, 2018
Oil Rigs: Rig Count Declines
by Calculated Risk on 8/03/2018 08:12:00 PM
A few comments from Steven Kopits of Princeton Energy Advisors LLC on August 3, 2018:
• A shockingly bad week for rig counts, notwithstanding that it was expected
• Total oil rigs fell, -2 to 859
• Horizontal oil rigs collapsed, -6 to 756
...
• The apparent breakeven to add horizontal oil rigs came in around $75 / barrel WTI (front month, 4 wma basis)
• Vertical oil rigs are at their highest level since last November – is that a precursor to rising horizontal rigs a few weeks later?
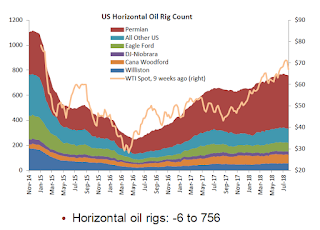 Click on graph for larger image.
CR note: This graph shows the US horizontal rig count by basin.
Graph and comments Courtesy of Steven Kopits of Princeton Energy Advisors LLC.
Public and Private Sector Payroll Jobs During Presidential Terms
by Calculated Risk on 8/03/2018 04:07:00 PM
By request, here is another update of tracking employment during Presidential terms. We frequently use Presidential terms as time markers - we could use Speaker of the House, Fed Chair, or any other marker.
NOTE: Several readers have asked if I could add a lag to these graphs (obviously a new President has zero impact on employment for the month they are elected). But that would open a debate on the proper length of the lag, so I'll just stick to the beginning of each term.
Important: There are many differences between these periods. Overall employment was smaller in the '80s, however the participation rate was increasing in the '80s (younger population and women joining the labor force), and the participation rate is generally declining now. But these graphs give an overview of employment changes.
The first graph shows the change in private sector payroll jobs from when each president took office until the end of their term(s). Presidents Carter and George H.W. Bush only served one term.
Mr. G.W. Bush (red) took office following the bursting of the stock market bubble, and left during the bursting of the housing bubble. Mr. Obama (dark blue) took office during the financial crisis and great recession. There was also a significant recession in the early '80s right after Mr. Reagan (dark red) took office.
There was a recession towards the end of President G.H.W. Bush (light purple) term, and Mr Clinton (light blue) served for eight years without a recession.

The first graph is for private employment only.
Mr. Trump is in Orange (18 months).
The employment recovery during Mr. G.W. Bush's (red) first term was sluggish, and private employment was down 804,000 jobs at the end of his first term. At the end of Mr. Bush's second term, private employment was collapsing, and there were net 391,000 private sector jobs lost during Mr. Bush's two terms.
Private sector employment increased by 20,964,000 under President Clinton (light blue), by 14,717,000 under President Reagan (dark red), 9,041,000 under President Carter (dashed green), 1,509,000 under President G.H.W. Bush (light purple), and 11,907,000 under President Obama (dark blue).
During the first 18 months of Mr. Trump's term, the economy has added 3,411,000 private sector jobs.

The public sector grew during Mr. Carter's term (up 1,304,000), during Mr. Reagan's terms (up 1,414,000), during Mr. G.H.W. Bush's term (up 1,127,000), during Mr. Clinton's terms (up 1,934,000), and during Mr. G.W. Bush's terms (up 1,744,000 jobs). However the public sector declined significantly while Mr. Obama was in office (down 266,000 jobs).
During the first 18 months of Mr. Trump's term, the economy has added 21,000 public sector jobs.
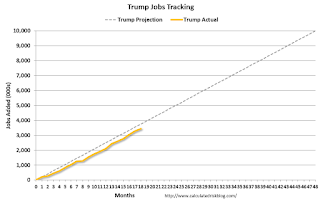
After 18 months of Mr. Trump's presidency, the economy has added 3,432,000 jobs, about 318,000 behind the projection.
ISM Non-Manufacturing Index decreased to 55.7% in July
by Calculated Risk on 8/03/2018 01:33:00 PM
The July ISM Non-manufacturing index was at 55.7%, down from 59.1% in June. The employment index increased in July to 56.1%, from 53.6%. Note: Above 50 indicates expansion, below 50 contraction.
From the Institute for Supply Management: July 2018 Non-Manufacturing ISM Report On Business®
Economic activity in the non-manufacturing sector grew in July for the 102nd consecutive month, say the nation’s purchasing and supply executives in the latest Non-Manufacturing ISM® Report On Business®.
The report was issued today by Anthony Nieves, CPSM, C.P.M., A.P.P., CFPM, Chair of the Institute for Supply Management® (ISM®) Non-Manufacturing Business Survey Committee: “The NMI® registered 55.7 percent, which is 3.4 percentage points lower than the June reading of 59.1 percent. This represents continued growth in the non-manufacturing sector at a slower rate. There was a notable decrease in the Business Activity Index, which fell to 56.5 percent, 7.4 percentage points lower than the June reading of 63.9 percent. The July figure still reflects growth for the 108th consecutive month, at a slower rate. The New Orders Index registered 57 percent, 6.2 percentage points lower than the reading of 63.2 percent in June. The Employment Index increased 2.5 percentage points in July to 56.1 percent from the June reading of 53.6 percent. The Prices Index increased by 2.7 percentage points from the June reading of 60.7 percent to 63.4 percent, indicating that prices increased in July for the 29th consecutive month. According to the NMI®, 16 non-manufacturing industries reported growth. There has been a ‘cooling off’ in growth for the non-manufacturing sector. Tariffs and deliveries are an ongoing concern. The majority of respondents remain positive about business conditions and the economy.”
emphasis added
 Click on graph for larger image.
This graph shows the ISM non-manufacturing index (started in January 2008) and the ISM non-manufacturing employment diffusion index.
This suggests slower expansion in July than in June.
Earlier: Trade Deficit increased to $46.3 Billion in June
by Calculated Risk on 8/03/2018 11:52:00 AM
Earlier from the Department of Commerce reported:
The U.S. Census Bureau and the U.S. Bureau of Economic Analysis announced today that the goods and services deficit was $46.3 billion in June, up $3.2 billion from $43.2 billion in May, revised. … June exports were $213.8 billion, $1.5 billion less than May exports. June imports were $260.2 billion, $1.6 billion more than May imports.
 Click on graph for larger image.
Exports decreased and imports increased in June.
Exports are 29% above the pre-recession peak and up 10% compared to June 2017; imports are 12% above the pre-recession peak, and up 9% compared to June 2017.
In general, trade has been picking up.
The second graph shows the U.S. trade deficit, with and without petroleum.
 The blue line is the total deficit, and the black line is the petroleum deficit, and the red line is the trade deficit ex-petroleum products.
Oil imports averaged $62.42 in June, up from $58.37 in May, and up from $44.78 in June 2017.
The trade deficit with China increased to $33.5 billion in June, from $32.6 billion in June 2017.
Comments on July Employment Report
by Calculated Risk on 8/03/2018 09:47:00 AM
The headline jobs number at 157,000 for July was below consensus expectations of 190 thousand, however the previously two months were revised up by a combined 59 thousand. Overall this was a solid report.
Earlier: July Employment Report: 157,000 Jobs Added, 3.9% Unemployment Rate
In July, the year-over-year employment change was 2.400 million jobs. This is solid year-over-year growth.
Average Hourly Earnings
Wage growth was close to expectations in July. From the BLS:
"In July, average hourly earnings for all employees on private nonfarm payrolls rose by 7 cents to $27.05. Over the year, average hourly earnings have increased by 71 cents, or 2.7 percent."
 Click on graph for larger image.
This graph is based on “Average Hourly Earnings” from the Current Employment Statistics (CES) (aka "Establishment") monthly employment report. Note: There are also two quarterly sources for earnings data: 1) “Hourly Compensation,” from the BLS’s Productivity and Costs; and 2) the Employment Cost Index which includes wage/salary and benefit compensation.
The graph shows the nominal year-over-year change in "Average Hourly Earnings" for all private employees. Nominal wage growth was at 2.7% YoY in July.
Wage growth had been trending up, although growth has been moving more sideways recently.
Prime (25 to 54 Years Old) Participation
 Since the overall participation rate has declined due to cyclical (recession) and demographic (aging population, younger people staying in school) reasons, here is the employment-population ratio for the key working age group: 25 to 54 years old.
In the earlier period the participation rate for this group was trending up as women joined the labor force. Since the early '90s, the participation rate moved more sideways, with a downward drift starting around '00 - and with ups and downs related to the business cycle.
The 25 to 54 participation rate increased in July to 82.1%, and the 25 to 54 employment population ratio increased to 79.5%.
The participation rate had been trending down for this group since the late '90s, however, with more younger workers (and fewer 50+ age workers), the prime participation rate might move up some more. The employment population ratio is almost back to the pre-great recession highs.
Part Time for Economic Reasons
 From the BLS report:
"The number of persons employed part time for economic reasons (sometimes referred to as involuntary part-time workers) was little changed in July, at 4.6 million, but was down by 669,000 over the year. These individuals, who would have preferred full-time employment, were working part time because their hours had been reduced or they were unable to find full-time jobs."The number of persons working part time for economic reasons has been generally trending down, and the number decreased in July to the lowest level since November 2007. The number working part time for economic reasons suggests three is still a little slack in the labor market.
These workers are included in the alternate measure of labor underutilization (U-6) that decreased to 7.5% in June. This is the lowest level for U-6 since May 2001.
Unemployed over 26 Weeks
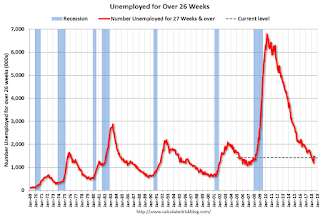 This graph shows the number of workers unemployed for 27 weeks or more.
 According to the BLS, there are 1.435 million workers who have been unemployed for more than 26 weeks and still want a job. This was down from 1.478 million in June.
Summary:
The headline jobs number was below expectations, however the previous two months were revised up.
The headline unemployment rate decreased to 3.9%, and U-6 decreased to 7.5% - the lowest rate since 2001. Wages growth was close to expectations.
Overall, this was a solid report. For the first seven months of 2018, job growth has been solid averaging 215 thousand per month.
July Employment Report: 157,000 Jobs Added, 3.9% Unemployment Rate
by Calculated Risk on 8/03/2018 08:42:00 AM
From the BLS:
Total nonfarm payroll employment rose by 157,000 in July, and the unemployment rate edged down to 3.9 percent, the U.S. Bureau of Labor Statistics reported today. Employment increased in professional and business services, in manufacturing, and in health care and social assistance.
...
The change in total nonfarm payroll employment for May was revised up from +244,000 to +268,000, and the change for June was revised up from +213,000 to +248,000. With these revisions, employment gains in May and June combined were 59,000 more than previously reported.
...
In July, average hourly earnings for all employees on private nonfarm payrolls rose by 7 cents to $27.05. Over the year, average hourly earnings have increased by 71 cents, or 2.7 percent.
emphasis added
 Click on graph for larger image.
The first graph shows the monthly change in payroll jobs, ex-Census (meaning the impact of the decennial Census temporary hires and layoffs is removed - mostly in 2010 - to show the underlying payroll changes).
Total payrolls increased by 157 thousand in July (private payrolls increased 170 thousand).
Payrolls for May and June were revised up by a combined 59 thousand.
 This graph shows the year-over-year change in total non-farm employment since 1968.
In July the year-over-year change was 2.400 million jobs.
The third graph shows the employment population ratio and the participation rate.
 The Labor Force Participation Rate was unchanged in July at 62.9%. This is the percentage of the working age population in the labor force. A large portion of the recent decline in the participation rate is due to demographics.
 The Employment-Population ratio increased to 60.5% (black line).
I'll post the 25 to 54 age group employment-population ratio graph later.
 The fourth graph shows the unemployment rate.
 The unemployment rate decreased in July to 3.9%.
This was below the consensus expectations of 190,000 jobs, however the previous two months combined were revised up by 59,000. A solid report.
I'll have much more later ...
Thursday, August 02, 2018
Friday: Employment Report, Trade Deficit
by Calculated Risk on 8/02/2018 07:03:00 PM
My July Employment Preview
Goldman: July Payrolls Preview
Friday:
• At 8:30 AM, Employment Report for July. The consensus is for an increase of 190,000 non-farm payroll jobs added in July, down from the 213,000 non-farm payroll jobs added in June. The consensus is for the unemployment rate to decline to 3.9%.
• Also at 8:30 AM, Trade Balance report for June from the Census Bureau. The consensus is for the U.S. trade deficit to be at $45.6 billion in June from $43.1 billion in May.
• At 10:00 AM, the ISM non-Manufacturing Index for July. The consensus is for index to decrease to 58.8 from 59.1 in June.
Goldman: July Payrolls Preview
by Calculated Risk on 8/02/2018 03:54:00 PM
A few brief excerpts from a note by Goldman Sachs economist Spencer Hill:
We estimate that nonfarm payrolls increased 205k in July, somewhat above consensus of 192k. Our forecast reflects lower initial jobless claims as well as the continued strength in employment surveys and job availability measures. Additionally, while trade policy uncertainty is likely on the rise, the recent escalation may have occurred too late to meaningfully impact tomorrow’s report.
We expect the unemployment rate to partially reverse its June increase, falling a tenth to 3.9%. ... We estimate average hourly earnings increased 0.2% month over month, lowering the year-over-year rate by a tenth to 2.6%.
emphasis added


