by Calculated Risk on 6/30/2017 04:59:00 PM
Friday, June 30, 2017
Vehicle Sales Forecast: "Sixth Consecutive Decline in June"
The automakers will report June vehicle sales on Monday, July 3rd.
Note: There were 26 selling days in June 2017, the same as in June 2016.
From WardsAuto: U.S. Forecast: Sixth Consecutive Decline in June
A WardsAuto forecast calls for U.S. automakers to deliver 1.50 million light vehicles in June. A daily sales rate of 57,762 units over 26 days represents a 0.7% decline from like-2016 (also 26 days).From Reuters: U.S. auto sales seen down 2 percent in June: JD Power and LMC
...
The report puts the seasonally adjusted annual rate of sales for the month at 16.82 million units, above year-ago’s 16.77 million and May’s 16.58 million mark. ...
WardsAuto is forecasting U.S. sales of 17.1 million units in calendar-year 2017. The outlook assumes a sales surge in the summer caused by deep price discounting or other means to trim the excess stock. If inventory is not cut by 400,000 to 500,000 units by September, another sell-off is possible in Q4, probably December. Without such a surge, sales are heading to 16.8 million units for the year.
emphasis added
The seasonally adjusted annualized rate for the month will be 16.5 million vehicles, down nearly 2 percent from 16.8 million units in the same month in 2016.Overall sales are down from the record in 2016.
U.S. Births decreased in 2016, Women 30-34 Now have Highest Birth Rate
by Calculated Risk on 6/30/2017 12:57:00 PM
From the National Center for Health Statistics: Births: Provisional Data for 2016. The NCHS reports:
The provisional number of births for the United States in 2016 was 3,941,109, down 1% from 2015. The general fertility rate was 62.0 births per 1,000 women aged 15–44, down 1% from 2015 to a record low for the United States. ...Here is a long term graph of annual U.S. births through 2016 ...
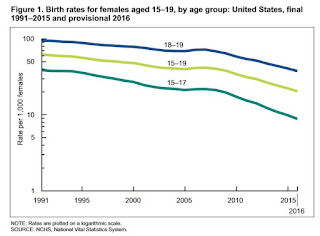
The provisional birth rates for teenagers aged 15–17 and 18–19 were 8.8 and 37.5 births per 1,000 women, respectively, down by 11% and 8% from 2015 and record lows for both groups.
...
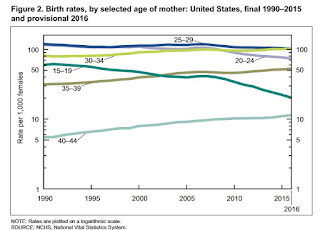
The provisional birth rate for women aged 20–24 was 73.7 births per 1,000 women in 2016, a decline of 4% from 2015 (76.8), reaching again another record low for this age group.
...
The rate for women aged 25–29 was 101.9 births per 1,000 women, down 2% from 2015 (104.3) and another record low for this age group.
...
The provisional birth rate for women aged 30–34 in 2016 was 102.6 births per 1,000 women, up 1% from 2015 (101.5) to the highest rate for this age group since 1964.
...
The provisional birth rate for women aged 40–44 in 2016 was 11.4 births per 1,000 women, up 4% from 2015 (11.0) to the highest rate for this age group since 1966.
 Click on graph for larger image.
Births have declined for two consecutive years following increases in 2013 and 2014.
A key trend is that women are waiting longer to have babies. Waiting longer to have children makes sense (see: Demographics and Behavior and U.S. Demographics: The Millennials Take Over) and we should expect a baby boom in a few years as the largest cohorts move into the 25 to 34 years old age groups.
I expect that as families have babies, they will tend to buy homes (as opposed to rent). The demographics are favorable for renting now, but the demographics will become more positive for homeownership.
 The second graph is from the NCHS report and shows birth rates by age group.
 From the NCHS:
The rate for women aged 25–29 was 101.9 births per 1,000 women, down 2% from 2015 (104.3) and another record low for this age group.Note that the highest birth rate is now for women in the 30 to 34 age group!
...
The provisional birth rate for women aged 30–34 in 2016 was 102.6 births per 1,000 women, up 1% from 2015 (101.5) to the highest rate for this age group since 1964.
 The third graph is from the NCHS report and shows births per 1,000 women by teen age group. From the NCHS:
 The provisional birth rates for teenagers aged 15–17 and 18–19 were 8.8 and 37.5 births per 1,000 women, respectively, down by 11% and 8% from 2015 and record lows for both groups.Far fewer teens births is great news (and is probably related to the much higher enrollment rates).
Chicago PMI Increases in June, Highest in Three Years
by Calculated Risk on 6/30/2017 10:05:00 AM
From the Chicago PMI: June Chicago Business Barometer at 65.7 vs 59.4 in May
The MNI Chicago Business Barometer rose to 65.7 in June from 59.4 in May, the highest level in over three years.This was well above the consensus forecast.
...
“June’s MNI Chicago Business Barometer Survey is a testament to firms’ expectations of a busy summer. With Production and New Orders touching levels not seen in three years, rising pressure on backlogs and delivery times has led to higher optimism among firms both in general business conditions and the local economy,” said Shaily Mittal, Senior Economist at MNI Indicators.
emphasis added
Personal Income increased 0.4% in May, Spending increased 0.1%
by Calculated Risk on 6/30/2017 08:40:00 AM
The BEA released the Personal Income and Outlays report for May:
Personal income increased $67.1 billion (0.4 percent) in May according to estimates released today by the Bureau of Economic Analysis. ... personal consumption expenditures (PCE) increased $7.3 billion (0.1 percent).The May PCE price index increased 1.4 percent year-over-year and the May PCE price index, excluding food and energy, increased 1.4 percent year-over-year.
...
Real PCE increased 0.1 percent. The PCE price index decreased 0.1 percent. Excluding food and energy, the PCE price index increased 0.1 percent.
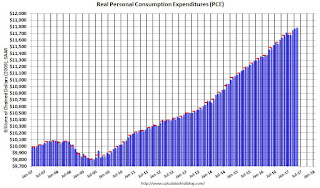
The following graph shows real Personal Consumption Expenditures (PCE) through May 2017 (2009 dollars). Note that the y-axis doesn't start at zero to better show the change.
 Click on graph for larger image.
The dashed red lines are the quarterly levels for real PCE.
The increase in personal income was above expectations, and the increase in PCE was at expectations.
Using the two-month method to estimate Q2 PCE growth, PCE was increasing at a 3.5% annual rate in Q2 2017. (using the mid-month method, PCE was increasing 3.7%). This suggests decent PCE growth in Q2.
Thursday, June 29, 2017
Friday: Personal Income and Outlays, Chicago PMI
by Calculated Risk on 6/29/2017 08:51:00 PM
From Matthew Graham at Mortgage News Daily: Mortgage Rates Highest in More Than a Month
Mortgage rates are higher again today, with the average lender now back to levels not seen since May 16th, 2017. Unless you've been following every little day-to-day change in rates, the apparent drama over the past few days is laughable. In the worst cases, some borrowers are now seeing rate quotes that are an eighth of percentage point higher than those seen on Monday morning. [30 year fixed 4% for top scenarios]Friday:
emphasis added
• At 8:30 AM ET, Personal Income and Outlays for May. The consensus is for a 0.3% increase in personal income, and for a 0.1% increase in personal spending. And for the Core PCE price index to increase 0.1%.
• At 9:15 AM, Chicago Purchasing Managers Index for June. The consensus is for a reading of 58.2, down from 59.4 in May.
• At 10:00 AM, University of Michigan's Consumer sentiment index (final for June). The consensus is for a reading of 94.5, from the preliminary reading 94.5.
Fannie Mae: Mortgage Serious Delinquency rate declined in May, Lowest since December 2007
by Calculated Risk on 6/29/2017 04:17:00 PM
Fannie Mae reported that the Single-Family Serious Delinquency rate declined to 1.04% in May, from 1.07% in April. The serious delinquency rate is down from 1.38% in May 2016.
This is the lowest serious delinquency rate since December 2007.
These are mortgage loans that are "three monthly payments or more past due or in foreclosure".
The Fannie Mae serious delinquency rate peaked in February 2010 at 5.59%.

Although the rate is declining, the "normal" serious delinquency rate is under 1%.
The Fannie Mae serious delinquency rate has fallen 0.34 percentage points over the last year, and at that rate of improvement, the serious delinquency rate will below 1% this Summer.
Note: Freddie Mac reported earlier.
Reis: Office Vacancy Rate "flat" in Q2 at 16.0%
by Calculated Risk on 6/29/2017 12:17:00 PM
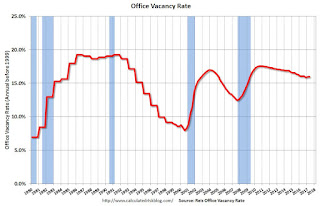
Reis released their Q2 2017 Office Vacancy survey this morning. Reis reported that the office vacancy rate was unchanged at 16.0% in Q2, from 16.0% in Q1. This is down from 16.1% in Q1 2016, and down from the cycle peak of 17.6%.
From Reis Economist Barbara Denham: Office Vacancy Holds Steady at 15.8%; Rents Increase 0.5% in the Quarter. Vacancy Increases in 42 U.S. Metros, but only 10 See Effective Rent Decline.
The Office Vacancy Rate remained flat in the second quarter at 16.0%. Asking rents increased 0.4% in the quarter and only 1.6% since the second quarter of 2016 – the lowest annual rate since 2011.
Continuing its lackluster pace, the Office market recorded the lowest quarterly net absorption in three years as the vacancy rate remained flat at 16.0%. One year ago, the vacancy rate was 16.1%. In the last expansion, the U.S. vacancy rate had fallen from a high of 17.0% in 2003 to a low of 12.5% in 2007. In the current expansion that is now seven quarters longer than the previous expansion, the vacancy rate has fallen from a high of 17.6% to only 16.0% as tenants have leased far fewer square feet per added employee than in past cycles.
New construction of 7.5 million square feet was also low by historic standards, but developers have been cautious throughout these last few years and have expanded the office supply at a less aggressive rate than in previous cycles. Net absorption, or occupancy growth, of 3.3 million square feet was the lowest since the second quarter of 2014. ...
 Click on graph for larger image.
This graph shows the office vacancy rate starting in 1980 (prior to 1999 the data is annual).
Reis reported the vacancy rate was at 16.0% in Q2. The office vacancy rate is moving sideways at an elevated level.
Office vacancy data courtesy of Reis.
Q1 GDP Revised up to 1.4% Annual Rate
by Calculated Risk on 6/29/2017 08:39:00 AM
From the BEA: Gross Domestic Product: First Quarter 2017 (Third Estimate)
Real gross domestic product (GDP) increased at an annual rate of 1.4 percent in the first quarter of 2017, according to the "third" estimate released by the Bureau of Economic Analysis. In the fourth quarter of 2016, real GDP increased 2.1 percent.Here is a Comparison of Third and Second Estimates. PCE growth was revised up from 0.6% to 1.1%. (still soft PCE, but better than the 0.3% reported in the Advance estimate of GDP). Residential investment was revised down slightly from 13.8% to +13.0%. This was above the consensus forecast.
The GDP estimate released today is based on more complete source data than were available for the "second" estimate issued last month. In the second estimate, the increase in real GDP was 1.2 percent. With the third estimate for the first quarter, personal consumption expenditures (PCE) and exports increased more than previously estimated, but the general picture of economic growth remains the same ...
emphasis added
Weekly Initial Unemployment Claims increase to 244,000
by Calculated Risk on 6/29/2017 08:34:00 AM
The DOL reported:
In the week ending June 24, the advance figure for seasonally adjusted initial claims was 244,000, an increase of 2,000 from the previous week's revised level. The previous week's level was revised up by 1,000 from 241,000 to 242,000. The 4-week moving average was 242,250, a decrease of 2,750 from the previous week's revised average. The previous week's average was revised up by 250 from 244,750 to 245,000.The previous week was revised up.
emphasis added
The following graph shows the 4-week moving average of weekly claims since 1971.
 Click on graph for larger image.
The dashed line on the graph is the current 4-week average. The four-week average of weekly unemployment claims decreased to 242,250.
This was higher than the consensus forecast.
The low level of claims suggests relatively few layoffs.
Wednesday, June 28, 2017
Thursday: Unemployment Claims, GDP
by Calculated Risk on 6/28/2017 08:49:00 PM
From Matthew Graham at Mortgage News Daily: Mortgage Rates Highest in More Than 2 Weeks
Mortgage rates moved moderately higher again today, as investors continued digesting the possibility of a "taper tantrum" in Europe.Thursday:
...
The average lender is once again quoting 4.0% on top tier conventional 30yr fixed scenarios. Before today (and especially before yesterday), 3.875% was fairly prevalent.
emphasis added
• At 8:30 AM ET, The initial weekly unemployment claims report will be released. The consensus is for 239 thousand initial claims, down from 241 thousand the previous week.
• Also at 8:30 AM, Gross Domestic Product, 1st quarter 2017 (Third estimate). The consensus is that real GDP increased 1.2% annualized in Q1, unchanged from the second estimate of 1.2%.
• Early, Reis Q2 2017 Office Survey of rents and vacancy rates.


