by Calculated Risk on 7/05/2017 12:54:00 PM
Wednesday, July 05, 2017
Office Vacancy Rate and Office Investment
Last week Reis reported the office vacancy rate was unchanged at 16.0% in Q2, from 16.0% in Q1.
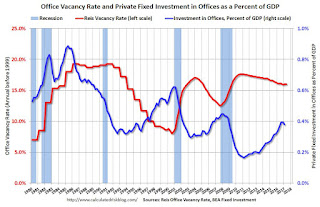
A key question is whether office investment will increase further (as a percent of GDP). The following graph shows the office vacancy rate and office investment as a percent of GDP. Note: Office investment also includes improvements.
Here are some comments from Reis Economist Barbara Byrne Denham on Q2:
Continuing its lackluster pace, the Office market recorded the lowest quarterly net absorption in three years as the vacancy rate remained flat at 16.0%. One year ago, the vacancy rate was 16.1%. In the last expansion, the U.S. vacancy rate had fallen from a high of 17.0% in 2003 to a low of 12.5% in 2007. In the current expansion that is now seven quarters longer than the previous expansion, the vacancy rate has fallen from a high of 17.6% to only 16.0% as tenants have leased far fewer square feet per added employee than in past cycles.
...
Overall office employment growth for U.S. metro areas in 2017 has grown at a slightly slower but still healthy rate of 2.0%. Thus, we expect occupancy growth to remain positive in 2017. We expect stronger construction in 2017 than in 2016 which means that the vacancy rate could continue to stay flat as occupancy grows at or near the same pace as new completions just as it has over the last two years. This has kept rent growth low and should continue to do so this year and next.
 Click on graph for larger image.
This graph shows the office vacancy rate starting in 1980 (prior to 1999 the data is annual). Back in the early '80s, there was overbuilding in the office sector even as the vacancy rate was rising. This was due to the very loose lending that led to the S&L crisis.
In the '90s, office investment picked up as the vacancy rate fell. Following the bursting of the stock bubble, the vacancy rate increased sharply and office investment declined.
During the housing bubble, office investment started to increase even before the vacancy rate had fallen below 14%. This was due to loose lending - again. Investment essentially stopped following the financial crisis.
Office investment has been increasing, and is now above the levels of previous slow periods. However the vacancy rate is still very high, suggesting office investment will not increase significantly going forward.
Office vacancy data courtesy of Reis.
Update: Framing Lumber Prices Up Year-over-year
by Calculated Risk on 7/05/2017 10:06:00 AM
Here is another update on framing lumber prices. Early in 2013 lumber prices came close to the housing bubble highs - and prices are once again near the bubble highs.
The price increases in early 2013 were due to a surge in demand (more housing starts) and supply constraints (framing lumber suppliers were working to bring more capacity online).
Prices didn't increase as much early in 2014 (more supply, smaller "surge" in demand).
In 2015, even with the pickup in U.S. housing starts, prices were down year-over-year. Note: Multifamily starts do not use as much lumber as single family starts, and there was a surge in multi-family starts. This decline in 2015 was also probably related to weakness in China.
Prices in 2017 are up solidly year-over-year.

This graph shows two measures of lumber prices: 1) Framing Lumber from Random Lengths through June 2017 (via NAHB), and 2) CME framing futures.
Right now Random Lengths prices are up 14% from a year ago, and CME futures are up about 18% year-over-year.
There is a seasonal pattern for lumber prices. Prices frequently peak around May, and bottom around October or November - although there is quite a bit of seasonal variability.
Tuesday, July 04, 2017
Wednesday: FOMC Minutes
by Calculated Risk on 7/04/2017 06:55:00 PM
Happy July 4th!
Wednesday:
• At 2:00 PM: FOMC Minutes for the Meeting of June 13 - 14, 2017
Hotels: Hotel Occupancy down Year-over-Year
by Calculated Risk on 7/04/2017 11:11:00 AM
From HotelNewsNow.com: STR: US hotel results for week ending 24 June
The U.S. hotel industry reported mixed year-over-year results in the three key performance metrics during the week of 18-24 June 2017, according to data from STR.The following graph shows the seasonal pattern for the hotel occupancy rate using the four week average.
In comparison with the week of 19-25 June 2016, the industry recorded the following:
• Occupancy: -1.2% to 75.8%
• Average daily rate (ADR): +1.1% to US$129.73
• Revenue per available room (RevPAR): -0.1% to US$98.31
emphasis added
 The red line is for 2017, dashed is 2015 (best year on record), blue is the median, and black is for 2009 (the worst year since the Great Depression for hotels).
Currently the occupancy rate is tracking close to last year, and behind the record year in 2015.
For hotels, occupancy will be strong over the next couple of months.
Data Source: STR, Courtesy of HotelNewsNow.com
Monday, July 03, 2017
U.S. Light Vehicle Sales at 16.4 million annual rate in June
by Calculated Risk on 7/03/2017 02:07:00 PM
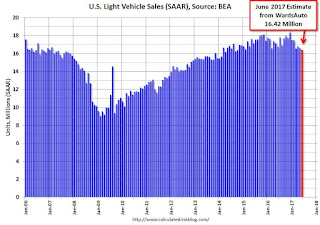
Based on a preliminary estimate from WardsAuto (ex-Porsche and Volvo), light vehicle sales were at a 16.42 million SAAR in June.
That is down 2% from June 2016, and down 1% from last month.
Click on graph for larger image.
This graph shows the historical light vehicle sales from the BEA (blue) and an estimate for May (red, light vehicle sales of 16.42 million SAAR mostly from WardsAuto).
This was below the consensus forecast of 16.6 million for May.
After two consecutive years of record sales, sales will be down in 2017.

Note: dashed line is current estimated sales rate.
Construction Spending unchanged in May
by Calculated Risk on 7/03/2017 11:57:00 AM
Earlier today, the Census Bureau reported that overall construction spending was unchanged in May:
Construction spending during May 2017 was estimated at a seasonally adjusted annual rate of $1,230.1 billion, nearly the same as the revised April estimate of $1,230.4 billion. The May figure is 4.5 percent above the May 2016 estimate of $1,177.0 billion.Private spending decreased and public spending increased in May:
Spending on private construction was at a seasonally adjusted annual rate of $943.2 billion, 0.6 percent below the revised April estimate of $949.3 billion. ...
In May, the estimated seasonally adjusted annual rate of public construction spending was $286.9 billion, 2.1 percent above the revised April estimate of $281.0 billion.
emphasis added
 Click on graph for larger image.
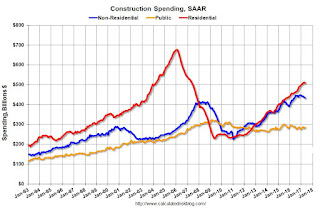
This graph shows private residential and nonresidential construction spending, and public spending, since 1993. Note: nominal dollars, not inflation adjusted.
Private residential spending has been increasing, and is still 25% below the bubble peak.
Non-residential spending is now 5% above the previous peak in January 2008 (nominal dollars).
Public construction spending is now 12% below the peak in March 2009, and 9% above the austerity low in February 2014.
 The second graph shows the year-over-year change in construction spending.
On a year-over-year basis, private residential construction spending is up 11%. Non-residential spending is up slightly year-over-year. Public spending is down slightly year-over-year.
This was below the consensus forecast of a 0.5% increase for May, however spending for previous months were revised up.
ISM Manufacturing index increased to 57.8 in June
by Calculated Risk on 7/03/2017 10:03:00 AM
The ISM manufacturing index indicated expansion in June. The PMI was at 57.8% in June, up from 54.9% in May. The employment index was at 57.2%, up from 53.5% last month, and the new orders index was at 63.5%, up from 59.5%.
From the Institute for Supply Management: June 2017 Manufacturing ISM® Report On Business®
Economic activity in the manufacturing sector expanded in June, and the overall economy grew for the 97th consecutive month, say the nation's supply executives in the latest Manufacturing ISM® Report On Business®.
The report was issued today by Timothy R. Fiore, CPSM, C.P.M., Chair of the Institute for Supply Management® (ISM®) Manufacturing Business Survey Committee: "The June PMI® registered 57.8 percent, an increase of 2.9 percentage points from the May reading of 54.9 percent. The New Orders Index registered 63.5 percent, an increase of 4 percentage points from the May reading of 59.5 percent. The Production Index registered 62.4 percent, a 5.3 percentage point increase compared to the May reading of 57.1 percent. The Employment Index registered 57.2 percent, an increase of 3.7 percentage points from the May reading of 53.5 percent. The Supplier Deliveries index registered 57 percent, a 3.9 percentage point increase from the May reading of 53.1 percent. The Inventories Index registered 49 percent, a decrease of 2.5 percentage points from the May reading of 51.5 percent. The Prices Index registered 55 percent in June, a decrease of 5.5 percentage points from the May reading of 60.5 percent, indicating higher raw materials’ prices for the 16th consecutive month, but at a slower rate of increase in June compared with May. Comments from the panel generally reflect expanding business conditions; with new orders, production, employment, backlog and exports all growing in June compared to May and with supplier deliveries and inventories struggling to keep up with the production pace."
emphasis added
 Click on graph for larger image.
Here is a long term graph of the ISM manufacturing index.
This was above expectations of 55.1%, and suggests manufacturing expanded at a faster pace in June than in May.
A strong report.
Sunday, July 02, 2017
Monday: Auto Sales, ISM Mfg, Construction Spending
by Calculated Risk on 7/02/2017 08:11:00 PM
Weekend:
• Schedule for Week of July 2, 2017
Monday:
• At 10:00 AM ET, ISM Manufacturing Index for June. The consensus is for the ISM to be at 55.1, up from 54.9 in May.
• Also at 10:00 AM, Construction Spending for May. The consensus is for a 0.5% increase in construction spending.
• All day: Light vehicle sales for June. The consensus is for light vehicle sales to be 16.6 million SAAR in June, mostly unchanged from 16.6 million in May (Seasonally Adjusted Annual Rate).
From CNBC: Pre-Market Data and Bloomberg futures: S&P futures are up 4 and DOW futures are up 45 (fair value).
Oil prices were up over the last week with WTI futures at $46.30 per barrel and Brent at $48.77 per barrel. A year ago, WTI was at $49, and Brent was at $48 - so oil prices are down slightly year-over-year.
Here is a graph from Gasbuddy.com for nationwide gasoline prices. Nationally prices are at $2.22 per gallon - a year ago prices were at $2.28 per gallon - so gasoline prices are down 6 cents year-over-year.
June 2016: Unofficial Problem Bank list declines to 137 Institutions, Q2 2017 Transition Matrix
by Calculated Risk on 7/02/2017 11:18:00 AM
Note: Surferdude808 compiles an unofficial list of Problem Banks compiled only from public sources.
Here is the unofficial problem bank list for June 2017.
Here are the monthly changes and a few comments from surferdude808:
Update on the Unofficial Problem Bank List for June 2017. During the month, the list declined slightly from 140 institutions to 137 after four removals and one addition. Assets increased by $946 million to an aggregate $35.2 billion. A year ago, the list held 203 institutions with assets of $60.6 billion.
This month, actions have been terminated against Bank of the Orient, San Francisco, CA ($611 million); Cornerstone Bank, Moorestown, NJ ($245 million Ticker: CFIC); and Central Bank, Savannah, TN ($98 million). Fayette County Bank, Saint Elmo, IL ($34 million) left the list through failure. The addition this month was the $1.9 billion MidSouth Bank, National Association, Lafayette, LA (Ticker: MSL).

With it being the end of the second quarter, we bring an updated transition matrix to detail how banks are moving off the Unofficial Problem Bank List. Since the Unofficial Problem Bank List was first published on August 7, 2009 with 389 institutions, a total of 1,720 institutions have appeared on a weekly or monthly list at some point. Only 8.0 percent of the banks that have appeared on the list remain today. In all, there have been 1,583 institutions that have transitioned through the list. Departure methods include 910 action terminations, 405 failures, 251 mergers, and 17 voluntary liquidations. Of the 389 institutions on the first published list, only 13 or 3.3 percent still remain nearly eight years later. The 405 failures represent 23.5 percent of the 1,720 institutions that have made an appearance on the list. This failure rate is well above the 10-12 percent rate frequently cited in media reports on the failure rate of banks on the FDIC's official list.
| Unofficial Problem Bank List | |||
|---|---|---|---|
| Change Summary | |||
| Number of Institutions | Assets ($Thousands) | ||
| Start (8/7/2009) | 389 | 276,313,429 | |
| Subtractions | |||
| Action Terminated | 174 | (64,391,534) | |
| Unassisted Merger | 40 | (9,818,439) | |
| Voluntary Liquidation | 4 | (10,584,114) | |
| Failures | 158 | (186,397,337) | |
| Asset Change | (443,904) | ||
| Still on List at 6/30/2017 | 13 | 4,678,101 | |
| Additions after 8/7/2009 | 124 | 30,505,792 | |
| End (6/30//2017) | 137 | 35,183,893 | |
| Intraperiod Removals1 | |||
| Action Terminated | 736 | 305,160,192 | |
| Unassisted Merger | 211 | 81,081,586 | |
| Voluntary Liquidation | 13 | 2,515,855 | |
| Failures | 247 | 125,118,011 | |
| Total | 1,207 | 513,875,644 | |
| 1Institution not on 8/7/2009 or 6/30/2017 list but appeared on a weekly list. | |||
Saturday, July 01, 2017
Schedule for Week of July 2, 2017
by Calculated Risk on 7/01/2017 08:12:00 AM
The key report this week is the June employment report on Friday.
Other key indicators include the June ISM manufacturing and non-manufacturing indexes, June auto sales, and the May Trade Deficit.
 10:00 AM: ISM Manufacturing Index for June. The consensus is for the ISM to be at 55.1, up from 54.9 in May.
Here is a long term graph of the ISM manufacturing index.
The ISM manufacturing index indicated expansion at 54.9% in May. The employment index was at 53.5%, and the new orders index was at 59.5%.
10:00 AM: Construction Spending for May. The consensus is for a 0.5% increase in construction spending.
 All day: Light vehicle sales for June. The consensus is for light vehicle sales to be 16.6 million SAAR in June, mostly unchanged from 16.6 million in May (Seasonally Adjusted Annual Rate).
This graph shows light vehicle sales since the BEA started keeping data in 1967. The dashed line is the May sales rate.
All US markets will be closed in observance of Independence Day.
7:00 AM ET: The Mortgage Bankers Association (MBA) will release the results for the mortgage purchase applications index.
2:00 PM: FOMC Minutes for the Meeting of June 13 - 14, 2017
8:15 AM: The ADP Employment Report for June. This report is for private payrolls only (no government). The consensus is for 178,000 payroll jobs added in June, down from 253,000 added in May.
8:30 AM ET: The initial weekly unemployment claims report will be released. The consensus is for 244 thousand initial claims, unchanged from 244 thousand the previous week.
 8:30 AM: Trade Balance report for May from the Census Bureau.
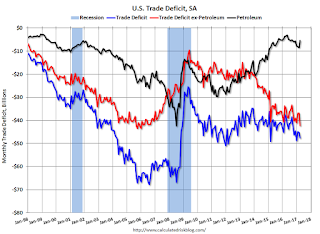
 This graph shows the U.S. trade deficit, with and without petroleum, through March. The blue line is the total deficit, and the black line is the petroleum deficit, and the red line is the trade deficit ex-petroleum products.
The consensus is for the U.S. trade deficit to be at $46.2 billion in May from $47.6 billion in April.
10:00 AM: the ISM non-Manufacturing Index for June. The consensus is for index to decrease to 56.5 from 56.9 in May.
8:30 AM: Employment Report for June. The consensus is for an increase of 170,000 non-farm payroll jobs added in June, up from the 138,000 non-farm payroll jobs added in May.
 The consensus is for the unemployment rate to be unchanged at 4.3%.
This graph shows the year-over-year change in total non-farm employment since 1968.
In May, the year-over-year change was 2.23 million jobs.
A key will be the change in wages.


