by Calculated Risk on 1/06/2017 11:58:00 AM
Friday, January 06, 2017
Trade Deficit at $45.2 Billion in November
From the Department of Commerce reported:
The U.S. Census Bureau and the U.S. Bureau of Economic Analysis, through the Department of Commerce, announced today that the goods and services deficit was $45.2 billion in November, up $2.9 billion from $42.4 billion in October, revised. November exports were $185.8 billion, $0.4 billion less than October exports. November imports were $231.1 billion, $2.4 billion more than October imports.The trade deficit was larger than the consensus forecast.
The first graph shows the monthly U.S. exports and imports in dollars through November 2016.
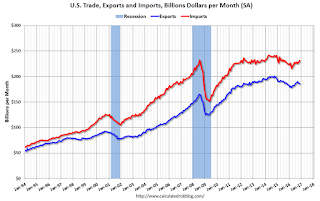 Click on graph for larger image.
Imports increased and exports decreased in October.
Exports are 12% above the pre-recession peak and up 1% compared to November 2015; imports are up 3% compared to November 2015.
It appears trade might be picking up a little.
The second graph shows the U.S. trade deficit, with and without petroleum.
 The blue line is the total deficit, and the black line is the petroleum deficit, and the red line is the trade deficit ex-petroleum products.
Oil imports averaged $40.82 in November, up from $40.01 in October, and down from $39.19 in November 2015. The petroleum deficit has generally been declining and is the major reason the overall deficit has declined a little since early 2012.
The trade deficit with China decreased to $30.5 billion in November, from $31.3 billion in November 2015. The deficit with China is a substantial portion of the overall deficit, but the deficit with China has been declining.
Comments: Solid December Employment Report, Pickup in Wage Growth
by Calculated Risk on 1/06/2017 09:57:00 AM
The headline jobs number was below expectations, but, including the combined upward revisions to the previous two months, this was a solid report.
Earlier: December Employment Report: 156,000 Jobs, 4.7% Unemployment Rate
Job growth has averaged 180,000 per month this year.
In December, the year-over-year change was 2.16 million jobs.
A key positive was the increase in hourly earnings. This is a noisy series, and the trend is clearly up.
Average Hourly Earnings

This graph is based on “Average Hourly Earnings” from the Current Employment Statistics (CES) (aka "Establishment") monthly employment report. Note: There are also two quarterly sources for earnings data: 1) “Hourly Compensation,” from the BLS’s Productivity and Costs; and 2) the Employment Cost Index which includes wage/salary and benefit compensation.
The graph shows the nominal year-over-year change in "Average Hourly Earnings" for all private employees. Nominal wage growth was at 2.9% YoY in December.
Seasonal Retail Hiring
According to the BLS employment report, retailers hired seasonal workers at a lower pace than the last few years.

This graph really shows the collapse in retail hiring in 2008. Since then seasonal hiring has increased back close to more normal levels. Note: I expect the long term trend will be down with more and more internet holiday shopping.
Retailers hired 673 thousand workers (NSA) net in October, November and December, this is down from just over 739 thousand for the same period over the last several years. Note: this is NSA (Not Seasonally Adjusted).
This suggests retailers were a little cautious about the holiday season. Or maybe retailers had trouble finding seasonal hires.
Employment-Population Ratio, 25 to 54 years old
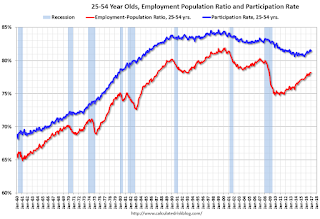
In the earlier period the participation rate for this group was trending up as women joined the labor force. Since the early '90s, the participation rate moved more sideways, with a downward drift starting around '00 - and with ups and downs related to the business cycle.
The 25 to 54 participation rate increased in December to 81.5%, and the 25 to 54 employment population ratio was unchanged at 78.2%.
The participation rate has been trending down for this group since the late '90s, however, with more younger workers (and fewer older workers), the participation rate might move up some more.
Part Time for Economic Reasons
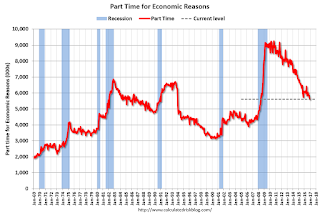
The number of persons employed part time for economic reasons (also referred to as involuntary part-time workers), at 5.6 million, was essentially unchanged in December but was down by 459,000 over the year. These individuals, who would have preferred full-time employment, were working part time because their hours had been cut back or because they were unable to find a full-time job.The number of persons working part time for economic reasons declined in December, and this is the lowest level since June 2008. This level suggests slack still in the labor market.
These workers are included in the alternate measure of labor underutilization (U-6) that declined to 9.2% in December. This is the lowest level for U-6 since April 2008.
Unemployed over 26 Weeks
 This graph shows the number of workers unemployed for 27 weeks or more.
 According to the BLS, there are 1.831 million workers who have been unemployed for more than 26 weeks and still want a job. This was down from 1.856 million in November.
This is trending down, and is at the lowest level since July 2008.
Overall this was another solid report.
December Employment Report: 156,000 Jobs, 4.7% Unemployment Rate
by Calculated Risk on 1/06/2017 08:49:00 AM
From the BLS:
Total nonfarm payroll employment rose by 156,000 in December, and the unemployment rate was little changed at 4.7 percent, the U.S. Bureau of Labor Statistics reported today. Job growth occurred in health care and social assistance.
...
The change in total nonfarm payroll employment for October was revised down from +142,000 to +135,000, and the change for November was revised up from +178,000 to +204,000. With these revisions, employment gains in October and November were 19,000 higher than previously reported.
...
In December, average hourly earnings for all employees on private nonfarm payrolls increased by 10 cents to $26.00, after edging down by 2 cents in November. Over the year, average hourly earnings have risen by 2.9 percent.
emphasis added
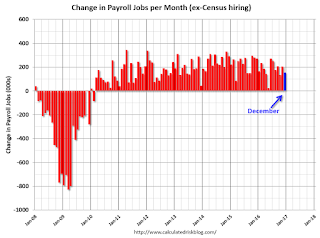 Click on graph for larger image.
The first graph shows the monthly change in payroll jobs, ex-Census (meaning the impact of the decennial Census temporary hires and layoffs is removed - mostly in 2010 - to show the underlying payroll changes).
Total payrolls increased by 156 thousand in December (private payrolls increased 144 thousand).
Payrolls for October and November were revised up by a combined 19 thousand.
 This graph shows the year-over-year change in total non-farm employment since 1968.
In December, the year-over-year change was 2.16 million jobs. This has been moving down, but still a solid year-over-year gain.
The third graph shows the employment population ratio and the participation rate.
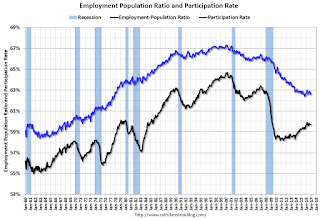 The Labor Force Participation Rate increased in December to 62.7%. This is the percentage of the working age population in the labor force. A large portion of the recent decline in the participation rate is due to demographics.
 The Employment-Population ratio was unchanged at 59.7% (black line).
I'll post the 25 to 54 age group employment-population ratio graph later.
 The fourth graph shows the unemployment rate.
 The unemployment rate increased in December to 4.7%.
This was below expectations of 175,000 jobs, however the previous two months were revised up. And there was a pickup in wage growth. Another solid report.
I'll have much more later ...
Thursday, January 05, 2017
Goldman's December NFP Preview
by Calculated Risk on 1/05/2017 05:54:00 PM
A few excerpts from Goldman Sachs' December Payroll Preview by economist Spencer Hill:
We forecast that nonfarm payroll employment increased 180k in December ... Our forecast for steady payroll gains reflects encouraging labor market surveys overall, as well as our expectation of above-trend growth in the transportation industry related to strong online holiday shopping.The December employment report will be released tomorrow, and the consensus is for an increase of 175,000 non-farm payroll jobs in November, and for the unemployment rate to increase to 4.7%.
We expect a one-tenth rise in the U3 unemployment rate to 4.7%, recouping part of its 0.3pp decline last month (to 4.64% unrounded). Average hourly earnings likely rebounded 0.3% after a 0.1% decline in November, boosted by more favorable calendar effects, with the year-over-year rate likely to accelerate 0.3pp to 2.8%, matching its post-crisis high.
...
Tomorrow’s employment report will be accompanied by the annual revision to the household survey, with potential revisions to the last 5 years of seasonally adjusted household data. ... The revisions to the household survey accompanying the December report are usually minor, and last year’s revisions did not result in a change to any of the monthly unemployment rates for 2015.
emphasis added
December Employment Preview
by Calculated Risk on 1/05/2017 03:33:00 PM
On Friday at 8:30 AM ET, the BLS will release the employment report for December. The consensus, according to Bloomberg, is for an increase of 175,000 non-farm payroll jobs in December (with a range of estimates between 151,000 to 200,000), and for the unemployment rate to increase to 4.7%.
The BLS reported 178,000 jobs added in November.
Here is a summary of recent data:
• The ADP employment report showed an increase of 153,000 private sector payroll jobs in December. This was below expectations of 172,000 private sector payroll jobs added. The ADP report hasn't been very useful in predicting the BLS report for any one month, but in general, this suggests employment growth somewhat below expectations.
• The ISM manufacturing employment index increased in December to 53.1%. A historical correlation between the ISM manufacturing employment index and the BLS employment report for manufacturing, suggests that private sector BLS manufacturing payroll was unchanged in December. The ADP report indicated 9,000 manufacturing jobs lost in December.
The ISM non-manufacturing employment index decreased in December to 53.8%. A historical correlation between the ISM non-manufacturing employment index and the BLS employment report for non-manufacturing, suggests that private sector BLS non-manufacturing payroll jobs increased about 175,000 in December.
Combined, the ISM indexes suggests employment gains of about 175,000. This suggests employment growth close to expectations.
• Initial weekly unemployment claims averaged 257,000 in December, up from 252,000 in November. For the BLS reference week (includes the 12th of the month), initial claims were at 275,000, up from 233,000 during the reference week in November.
The increase during the reference suggests more layoffs during that week in December as compared to November. This suggests a below consensus employment report.
• The final December University of Michigan consumer sentiment index increased to 98.2 from the November reading of 93.8. Sentiment is frequently coincident with changes in the labor market, but there are other factors too like gasoline prices and politics.
• Conclusion: Unfortunately none of the indicators alone is very good at predicting the initial BLS employment report. The ADP report and weekly unemployment claims suggest weaker job growth. The ISM reports suggests growth close to consensus.
My guess is the December report will be below the consensus forecast.
Reis: Apartment Vacancy Rate declined in Q4 to 4.1%
by Calculated Risk on 1/05/2017 01:11:00 PM
Reis reported that the apartment vacancy rate was at 4.1% in Q4 2016, down from 4.2% in Q3, and down from 4.3% in Q4 2015. The vacancy rate peaked at 8.0% at the end of 2009, and this is a new low for this cycle.
A few comments from Reis Economist Barbara Denham:
Showing continued resiliency, the national apartment vacancy rate declined to 4.1% from 4.2% in the third quarter and 4.3% at year-end 2015. Although net absorption (occupancy growth) was the lowest level in more than two years, new construction was also weaker. The fourth quarter statistics ... confirm that the pace of new completions has slowed after soaring over the last few years. Rent growth decelerated as well to a rate of 0.3% in the fourth quarter. Although the fourth quarter usually sees the lowest growth rates of the year, this quarter's results were the lowest since 2009.
...
Looking ahead, while new construction is expected to exceed demand (occupancy growth), we do not foresee a spike in vacancy rates. As mentioned above, recently surveyed data shows that the pace of completions has slowed while net absorption has stayed healthy. This means that prospective home buyers have not abandoned the apartment market as rapidly as many had thought would do so by this stage of the expansion.
emphasis added
 Click on graph for larger image.
This graph shows the apartment vacancy rate starting in 1980. (Annual rate before 1999, quarterly starting in 1999). Note: Reis is just for large cities.
The vacancy rate had been mostly moving sideways for the last few years. It appeared that the vacancy rate had bottomed, but this is a new low for this cycle.
Apartment vacancy data courtesy of Reis.
ISM Non-Manufacturing Index at 57.2% in December
by Calculated Risk on 1/05/2017 10:04:00 AM
The December ISM Non-manufacturing index was at 57.2%, unchanged from 57.2% in November. The employment index decreased in December to 53.8%, from 58.1%. Note: Above 50 indicates expansion, below 50 contraction.
From the Institute for Supply Management:December 2016 Non-Manufacturing ISM Report On Business®
Economic activity in the non-manufacturing sector grew in December for the 83rd consecutive month, say the nation's purchasing and supply executives in the latest Non-Manufacturing ISM® Report On Business®.
The report was issued today by Anthony Nieves, CPSM, C.P.M., CFPM, chair of the Institute for Supply Management® (ISM®) Non-Manufacturing Business Survey Committee. "The NMI® registered 57.2 percent in December, matching the November figure. This represents continued growth in the non-manufacturing sector at the same rate. The Non-Manufacturing Business Activity Index decreased to 61.4 percent, 0.3 percentage point lower than the November reading of 61.7 percent, reflecting growth for the 89th consecutive month, at a slightly slower rate in December. The New Orders Index registered 61.6 percent, 4.6 percentage points higher than the reading of 57 percent in November. The Employment Index decreased 4.4 percentage points in December to 53.8 percent from the November reading of 58.2 percent. The Prices Index increased 0.7 percentage point from the November reading of 56.3 percent to 57 percent, indicating prices increased in December for the ninth consecutive month at a slightly faster rate. According to the NMI®, 12 non-manufacturing industries reported growth in December. The non-manufacturing sector closed out the year strong maintaining its rate of growth month-over-month. Respondents' comments are mostly positive about business conditions and the overall economy."
emphasis added
 Click on graph for larger image.
This graph shows the ISM non-manufacturing index (started in January 2008) and the ISM non-manufacturing employment diffusion index.
This was above the consensus forecast of 56.8, and suggests about the same rate of expansion in December as in November. A solid report.
Weekly Initial Unemployment Claims decrease to 235,000
by Calculated Risk on 1/05/2017 08:33:00 AM
The DOL reported:
In the week ending December 31, the advance figure for seasonally adjusted initial claims was 235,000, a decrease of 28,000 from the previous week's revised level. The previous week's level was revised down by 2,000 from 265,000 to 263,000. The 4-week moving average was 256,750, a decrease of 5,750 from the previous week's revised average. The previous week's average was revised down by 500 from 263,000 to 262,500.The previous week was revised down.
There were no special factors impacting this week's initial claims. This marks 96 consecutive weeks of initial claims below 300,000, the longest streak since 1970.
emphasis added
The following graph shows the 4-week moving average of weekly claims since 1971.
 Click on graph for larger image.
The dashed line on the graph is the current 4-week average. The four-week average of weekly unemployment claims decreased to 256,750.
This was well below the consensus forecast (it is difficult to seasonally adjusted during the holidays). The low level of claims suggests relatively few layoffs.
ADP: Private Employment increased 153,000 in December
by Calculated Risk on 1/05/2017 08:21:00 AM
Private sector employment increased by 153,000 jobs from November to December according to the December ADP National Employment Report®. ... The report, which is derived from ADP’s actual payroll data, measures the change in total nonfarm private employment each month on a seasonally-adjusted basis.This was below the consensus forecast for 172,000 private sector jobs added in the ADP report.
...
“As we exit 2016, it’s interesting to note that the private sector generated an average of 174,000 jobs per month, down from 209,000 in 2015,” said Ahu Yildirmaz, vice president and head of the ADP Research Institute. “And while job gains in December were slightly below our monthly average, the U.S. labor market has experienced unprecedented seven years of growth that has brought us to near full employment. As we enter 2017, the tightening labor market will likely slow the growth.”
Mark Zandi, chief economist of Moody’s Analytics, said, “Job growth remains strong but is slowing. The gap between employment growth in the service economy and losses on the goods side persists. Smaller companies are struggling to maintain payrolls while large companies are expanding at a healthy pace.”
The BLS report for December will be released Friday, and the consensus is for 175,000 non-farm payroll jobs added in December.
Wednesday, January 04, 2017
Thursday: ADP Employment, Unemployment Claims, ISM Non-Mfg, Apartment Survey
by Calculated Risk on 1/04/2017 07:24:00 PM
Thursday:
• At 8:15 AM ET, the ADP Employment Report for December. This report is for private payrolls only (no government). The consensus is for 172,000 payroll jobs added in December, down from 216,000 added in November.
• At 8:30 AM, the initial weekly unemployment claims report will be released. The consensus is for 260 thousand initial claims, down from 265 thousand the previous week.
• Early, Reis Q4 2016 Apartment Survey of rents and vacancy rates.
• At 10:00 AM, the ISM non-Manufacturing Index for December. The consensus is for index to decrease to 56.8 from 57.2 in November.


