by Calculated Risk on 7/27/2015 04:51:00 PM
Monday, July 27, 2015
Vehicle Sales Forecasts for July: Over 17 Million Annual Rate Again, Best July in a Decade
The automakers will report July vehicle sales on Monday, August 3rd. Sales in June were at 17.1 million on a seasonally adjusted annual rate basis (SAAR), and it appears sales in July will be over 17 million SAAR again.
Note: There were 26 selling days in July, the same as in July 2014. Here are a few forecasts:
From J.D. Power: New-Vehicle Retail Sales SAAR in July to Hit 14 Million, Highest Level for the Month in a Decade
The forecast for new-vehicle retail sales in July 2015 is 1,260,200 units, a 2.5 percent increase compared with July 2014 and the highest retail sales volume for the month since July 2006, when sales hit 1,294,085. Retail transactions are the most accurate measure of consumer demand for new vehicles. [Total forecast 17.2 million SAAR]From Kelley Blue Book: New-Car Sales To Increase Nearly 3 Percent In July 2015, According To Kelley Blue Book
emphasis added
New-vehicle sales are expected to increase 2.6 percent year-over-year to a total of 1.47 million units in July 2015, resulting in an estimated 17.1 million seasonally adjusted annual rate (SAAR), according to Kelley Blue Book www.kbb.com ...From WardsAuto: 17 Million SAAR Streak Should Continue in July
...
"As the industry settles into the summer selling season, new-car sales are expected to remain consistent with last month's numbers, representing modest and slowing growth versus last year," said Alec Gutierrez, senior analyst for Kelley Blue Book. "Sales in the first half of the year totaled 8.5 million units, a year-over-year improvement of 4.4 percent and the highest first-half volume since 2005. Total sales in 2015 are projected to hit 17.1 million units overall, a 3.6 percent year-over-year increase and the highest industry total since 2001."
If the projected 17.3 million-unit seasonally adjusted annual rate is reached, it will mark the first time since 2000 that the monthly LV SAAR has exceeded 17 million units in three consecutive months, and would represent the highest July SAAR since 2005.Another strong month for auto sales.
...
At forecast levels, year-to-date sales through July would rise to 9.97 million units, up 4.4% over the first seven months of 2014.
ATA Trucking Index decreased 0.5% in June
by Calculated Risk on 7/27/2015 01:55:00 PM
Here is an indicator that I follow on trucking, from the ATA: ATA Truck Tonnage Index Fell 0.5% in June
American Trucking Associations’ advanced seasonally adjusted For-Hire Truck Tonnage Index decreased 0.5% in June, following a revised gain of 0.8% during May. In June, the index equaled 131.1 (2000=100). The all-time high of 135.8 was reached in January 2015.
Compared with June 2014, the SA index increased 1.8%, which was above the 1.5% gain in May. Year-to-date through June, compared with the same period last year, tonnage was up 3.4%. ...
With flat factory output and falling retail sales, I’m not surprised tonnage was soft in June,” said ATA Chief Economist Bob Costello. “I also remain concerned over the elevated inventory-to-sales ratio for retailers, wholesalers, and manufacturers, which suggests soft tonnage in the months ahead until the ratio falls.
“I remain hopeful that the inventory correction will transpire this summer. When the correction ends, truck freight – helped by better personal consumption – will accelerate,” he said.
emphasis added
 Click on graph for larger image.
Here is a long term graph that shows ATA's For-Hire Truck Tonnage index.
The dashed line is the current level of the index.
The index is now up only 1.8% year-over-year.
Dallas Fed: "Texas Manufacturing Slump Moderates"
by Calculated Risk on 7/27/2015 10:57:00 AM
From the Dallas Fed: Texas Manufacturing Slump Moderates, Outlooks Improve
Texas factory activity declined slightly in July, according to business executives responding to the Texas Manufacturing Outlook Survey. The production index, a key measure of state manufacturing conditions, remained negative but rose for a second month in a row to -1.9, suggesting further moderation in the decline in manufacturing output.The Dallas region has been especially hard hit by the decline in oil prices. This survey might be more negative in August since oil prices have declined again.
...
Perceptions of broader business conditions were mixed. The general business activity index remained negative, but it rose for a second month in a row and reached -4.6 in July. Manufacturers expect improved conditions ahead. The company outlook index surged nearly nine points and posted its first positive reading in seven months, coming in at 1.2.
Labor market indicators reflected slight employment declines and shorter workweeks. The July employment index was negative for a third month in a row and edged down to -3.3.
emphasis added
The Richmond Fed survey (last of the regional Fed surveys for July) will be released tomorrow.
Black Knight: House Price Index up 1.1% in May, 5.1% year-over-year
by Calculated Risk on 7/27/2015 09:14:00 AM
Note: I follow several house price indexes (Case-Shiller, CoreLogic, Black Knight, Zillow, FHFA, FNC and more). Note: Black Knight uses the current month closings only (not a three month average like Case-Shiller or a weighted average like CoreLogic), excludes short sales and REOs, and is not seasonally adjusted.
From Black Knight: U.S. Home Prices Up 1.1 percent for the Month; Up 5.1 Percent Year-Over-Year
Today, the Data and Analytics division of Black Knight Financial Services, Inc. (NYSE: BKFS) released its latest Home Price Index (HPI) report, based on May 2015 residential real estate transactions. The Black Knight HPI combines the company’s extensive property and loan-level databases to produce a repeat sales analysis of home prices as of their transaction dates every month for each of more than 18,500 U.S. ZIP codes. The Black Knight HPI represents the price of non-distressed sales by taking into account price discounts for REO and short sales.The Black Knight HPI increased 1.1% percent in May, and is off 6.5% from the peak in June 2006 (not adjusted for inflation).
For a more in-depth review of this month’s home price trends, including detailed looks at the 20 largest states and 40 largest metros, please download the full Black Knight HPI Report.
The year-over-year increase in the index has been about the same for the last eight months.
The press release has data for the 20 largest states, and 40 MSAs.
Black Knight shows prices off 39.3% from the peak in Las Vegas, off 32.5% in Orlando, and 28.1% off from the peak in Riverside-San Bernardino, CA (Inland Empire). Prices are at new highs in New York, Tennessee and Texas, and several other cities around the country.
Note: Case-Shiller for May will be released tomorrow.
Sunday, July 26, 2015
Sunday Night Futures
by Calculated Risk on 7/26/2015 07:49:00 PM
From Ben Leubsdorf and Jon Hilsenrath at the WSJ: Fed Officials May Offer More Clarity on Rates
Federal Reserve officials are likely to emerge from their policy meeting Wednesday with short-term interest rates still pinned near zero, though they could send fresh hints that they’re getting closer to raising rates. ...CR Note: I don't expect an explicit signal at the FOMC meeting this week, instead I expect the FOMC to emphasize that they are data dependent - and that they would like to see further improvement in the labor market, and further evidence of inflation moving back towards 2%.
This leaves the Fed with a slight signaling challenge at the meeting this week. How aggressively should officials tip their hands about the timing of a rate increase later this year? Fed officials don’t want to take financial markets by surprise by raising the benchmark federal-funds rate for the first time since 2006 with no forewarning. At the same time, they want to keep their options open so they can adjust their stance as the economy evolves.
The September meeting could be interesting!
Weekend:
• Schedule for Week of July 26, 2015
Monday:
• At 8:30 AM, Durable Goods Orders for June from the Census Bureau. The consensus is for a 3.1% increase in durable goods orders.
• At 10:30 AM, Dallas Fed Manufacturing Survey for July.
From CNBC: Pre-Market Data and Bloomberg futures: currently S&P futures are up slightly and DOW futures are up 20 (fair value).
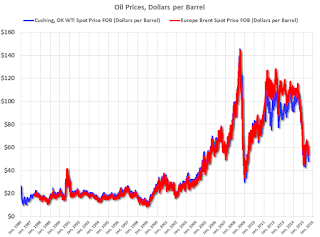
Oil prices were down over the last week with WTI futures at $48.04 per barrel and Brent at $54.62 per barrel. A year ago, WTI was at $103, and Brent was at $106 - so prices are down about 50% year-over-year.
Here is a graph from Gasbuddy.com for nationwide gasoline prices. Nationally prices are at $2.71 per gallon (down about $0.80 per gallon from a year ago).
WSJ: More Oil Industry Layoffs Coming
by Calculated Risk on 7/26/2015 10:25:00 AM
From Lynn Cook at the WSJ: Sudden Drop in Crude-Oil Prices Roils U.S. Energy Firms’ Rebound
U.S. energy companies are planning more layoffs, asset sales and financial maneuvers to deal with a recent, sudden drop in U.S. crude-oil prices to under $50 a barrel, the lowest level in four months.
...
Nearly 50,000 energy jobs have been lost in the past three months on top of 100,000 employees laid off since oil prices started to tumble last fall, according to Graves & Co., a Houston energy consultancy.
 Click on graph for larger image
This graph shows WTI and Brent spot oil prices from the EIA. (Prices Friday added). According to Bloomberg, WTI was at $48.14 per barrel on Friday, and Brent at $54.62.
Prices are down about 50% year-over-year.
The second graph shows the prices over the last few years.
 Some producers stopped cutting when prices started to rebound, but now prices are declining again - and there will probably be more layoffs in the oil sector.
 Note: Several oil producing states are already in recession such as North Dakota, Oklahoma and Alaska, but overall lower oil prices will be a positive for the U.S. economy.
Saturday, July 25, 2015
Schedule for Week of July 26, 2015
by Calculated Risk on 7/25/2015 08:15:00 AM
The key reports this week are Q2 GDP on Thursday, and Case-Shiller house prices on Tuesday.
The FOMC meets on Tuesday and Wednesday, and no change to policy is expected at this meeting.
8:30 AM: Durable Goods Orders for June from the Census Bureau. The consensus is for a 3.1% increase in durable goods orders.
10:30 AM: Dallas Fed Manufacturing Survey for July.
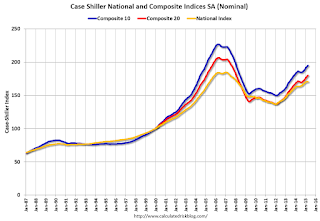
 9:00 AM: S&P/Case-Shiller House Price Index for May. Although this is the May report, it is really a 3 month average of March, April and May prices.
This graph shows the nominal seasonally adjusted National Index, Composite 10 and Composite 20 indexes through the April 2015 report (the Composite 20 was started in January 2000).
The consensus is for a 5.6% year-over-year increase in the Comp 20 index for April. The Zillow forecast is for the National Index to increase 4.0% year-over-year in May.
10:00 AM: Richmond Fed Survey of Manufacturing Activity for July.
10:00 AM: Q2 Housing Vacancies and Homeownership survey.
7:00 AM: The Mortgage Bankers Association (MBA) will release the results for the mortgage purchase applications index.
10:00 AM: Pending Home Sales Index for June. The consensus is for a 1.0% increase in the index.
2:00 PM: FOMC Meeting Announcement. No change is expected to policy.
8:30 AM: Gross Domestic Product, 2nd quarter 2015 (advance estimate); Includes historical revisions. The consensus is that real GDP increased 2.9% annualized in Q2.
8:30 AM: The initial weekly unemployment claims report will be released. The consensus is for claims to increase to 272 thousand from 255 thousand.
8:30 AM: The Q2 Employment Cost Index
9:45 AM: Chicago Purchasing Managers Index for June. The consensus is for a reading of 50.0, up from 49.4 in May.
10:00 AM: University of Michigan's Consumer sentiment index (final for July). The consensus is for a reading of 94.1, up from the preliminary reading of 93.3.
Friday, July 24, 2015
Philly Fed: State Coincident Indexes increased in 40 states in June
by Calculated Risk on 7/24/2015 06:29:00 PM
From the Philly Fed:
The Federal Reserve Bank of Philadelphia has released the coincident indexes for the 50 states for June 2015. In the past month, the indexes increased in 40 states, decreased in seven, and remained stable in three, for a one-month diffusion index of 66. Over the past three months, the indexes increased in 42 states, decreased in six, and remained stable in two, for a three-month diffusion index of 72.Note: These are coincident indexes constructed from state employment data. An explanation from the Philly Fed:
The coincident indexes combine four state-level indicators to summarize current economic conditions in a single statistic. The four state-level variables in each coincident index are nonfarm payroll employment, average hours worked in manufacturing, the unemployment rate, and wage and salary disbursements deflated by the consumer price index (U.S. city average). The trend for each state’s index is set to the trend of its gross domestic product (GDP), so long-term growth in the state’s index matches long-term growth in its GDP.
 Click on graph for larger image.
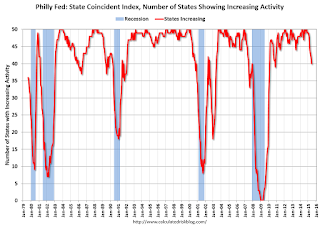
This is a graph is of the number of states with one month increasing activity according to the Philly Fed. This graph includes states with minor increases (the Philly Fed lists as unchanged).
In June, 40 states had increasing activity.
It appears we are seeing weakness in several oil producing states including Alaska, Oklahoma and North Dakota - and also in other energy producing states like West Virginia.
 Here is a map of the three month change in the Philly Fed state coincident indicators. This map was all red during the worst of the recession, and is almost all green again.
 Note: Blue added for Red/Green issues.
Nomura on Q2 GDP and Annual Revision
by Calculated Risk on 7/24/2015 03:31:00 PM
A few excerpts from a research note by economists at Nomura:
Q2 GDP, first estimate (Thursday): Economic activity in Q2 bounced back after slowing in Q1. However, some factors such as low energy prices and the strong dollar likely continued to weigh on business activity. We expect the BEA to report that the rebound in activity was concentrated in the consumer, housing and government sectors. As such we forecast a 2.8% increase in Q2 GDP, with real final sales growing by 3.1% as we expect inventory investment to subtract 0.3pp from GDP growth.Earlier on GDP: Merrill on the Annual GDP Revision and Q2 GDP
The annual revisions to GDP will also be released. Revisions will be mostly applied to data between 2012 and Q1 2015. The most notable features the annual revisions will introduce are 1) the average of GDP, gross domestic income and final sales, 2) an upgrade to its presentation of exports and imports, and 3) improvements to seasonal adjustment of certain GDP components. Furthermore, our work suggests that there is material residual seasonality in top-line GDP in Q1, as it tends to be below trend due to strong seasonal patterns in defense spending. Therefore, we might see some revision to the distribution of GDP growth in the first part of this year. As such, there is more uncertainty around the Q2 GDP estimate than usual.
Comments on New Home Sales
by Calculated Risk on 7/24/2015 12:19:00 PM
The new home sales report for June was well below expectations at 482 thousand on a seasonally adjusted annual rate basis (SAAR), and there were also downward revisions to prior months. However sales are still up solidly for 2015 compared to 2014.
A key question is if there was some negative impact of higher mortgage rates on sales? - or was the decline in June mostly noise? Changes in rates would show up in New Home sales before Existing Home sales (that were strong in June) because New Home sales are reported when the contract is signed, and Existing Home sales are reported when the transaction closes. If there is an impact from higher rates, then the impact will show up in the Existing Home sales report for July or August.
Earlier: New Home Sales decreased to 482,000 Annual Rate in June.
The Census Bureau reported that new home sales this year, through June, were 274,000, not seasonally adjusted (NSA). That is up 21.2% from 226,000 sales during the same period of 2014 (NSA). That is a strong year-over-year gain for the first half of 2015!
Sales were up 18.1% year-over-year in June.

This graph shows new home sales for 2014 and 2015 by month (Seasonally Adjusted Annual Rate).
The year-over-year gain will probably be strong through July (the first seven months were especially weak in 2014), however I expect the year-over-year increases to slow later this year - but the overall year-over-year gain should be solid in 2015.
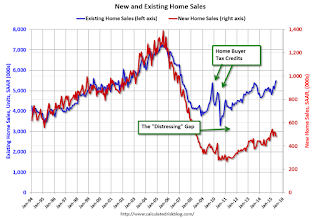
And here is another update to the "distressing gap" graph that I first started posting a number of years ago to show the emerging gap caused by distressed sales. Now I'm looking for the gap to close over the next several years.

Following the housing bubble and bust, the "distressing gap" appeared mostly because of distressed sales.
I expect existing home sales to mostly move sideways over the next few years (distressed sales will continue to decline and be partially offset by more conventional / equity sales). And I expect this gap to slowly close, mostly from an increase in new home sales.
Note: Existing home sales are counted when transactions are closed, and new home sales are counted when contracts are signed. So the timing of sales is different.


