by Calculated Risk on 2/24/2015 03:41:00 PM
Tuesday, February 24, 2015
FDIC: Fewer Problem banks, Residential REO Declines in Q4
The FDIC released the Quarterly Banking Profile for Q4 today.
The banking industry continued to improve at the end of the year. Although total industry earnings declined as a result of significant litigation expenses at a few large institutions and a continued decline in mortgage-related income, a majority of banks reported higher operating revenues and improved earnings from the previous year. In addition, banks made loans at a faster pace, asset quality improved, and the number of banks on the problem list declined to the lowest level in six years.
...
[F]ourth quarter net income was 36.9 billion dollars, down 7.3 percent from the prior year. The principal reasons for the decline were a 4.4 billion dollar increase in litigation expenses concentrated at a few large institutions and a 1.6 billion dollar decline in mortgage-related noninterest income.
emphasis added
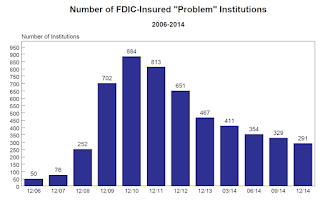 Click on graph for larger image.
The FDIC reported the number of problem banks declined (Note: graph shows problem banks quarterly for 2014, and year end prior to 2014):
The number of banks on the problem list fell to the lowest level since the third quarter of 2008. There were 291 banks on the problem list at the end of 2014, less than one-third of the 888 problem banks at the peak in March 2011. Total assets of banks on the problem list fell to 87 billion dollars.
This is the first time problem bank assets have been below 100 billion dollars since March 2008.
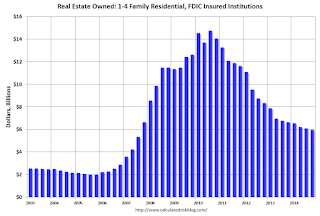 The dollar value of 1-4 family residential Real Estate Owned (REOs, foreclosure houses) declined from $6.10 billion in Q3 2014 to $5.98 billion in Q4. This is the lowest level of REOs since Q3 2007.
This graph shows the dollar value of Residential REO for FDIC insured institutions. Note: The FDIC reports the dollar value and not the total number of REOs.
A Comment on House Prices: Real Prices and Price-to-Rent Ratio in December
by Calculated Risk on 2/24/2015 12:22:00 PM
First, S&P's David Blitzer said this morning "The housing recovery is faltering." I disagree with that wording. The level of housing starts and new home sales are still historically weak, but are clearly recovering - and I expect the housing recovery to continue (not "falter").
Second, the expected slowdown in year-over-year price increases has occurred. In October 2013, the National index was up 10.9% year-over-year (YoY). In December 2014, the index was up 4.6% YoY. The YoY change has held steady for the last four months.
Looking forward, I expect the YoY increases for the indexes to move more sideways (as opposed to down). Two points: 1) I don't expect (as some) for the indexes to turn negative YoY (in 2015) , and 2) I think most of the slowdown on a YoY basis is now behind us. This slowdown in price increases was expected by several key analysts, and I think it was good news for housing and the economy.
In the earlier post, I graphed nominal house prices, but it is also important to look at prices in real terms (inflation adjusted). Case-Shiller, CoreLogic and others report nominal house prices. As an example, if a house price was $200,000 in January 2000, the price would be close to $275,000 today adjusted for inflation (38%). That is why the second graph below is important - this shows "real" prices (adjusted for inflation).
It has been almost ten years since the bubble peak. In the Case-Shiller release this morning, the National Index was reported as being 8.4% below the bubble peak. However, in real terms, the National index is still about 22% below the bubble peak.
Nominal House Prices
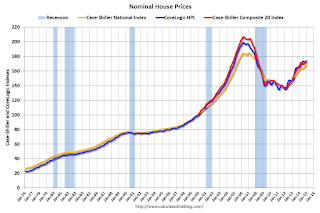
In nominal terms, the Case-Shiller National index (SA) is back to May 2005 levels, and the Case-Shiller Composite 20 Index (SA) is back to December 2004 levels, and the CoreLogic index (NSA) is back to February 2005.
Real House Prices

In real terms, the National index is back to April 2003 levels, the Composite 20 index is back to November 2002, and the CoreLogic index back to March 2003.
In real terms, house prices are back to early '00s levels.
Price-to-Rent
In October 2004, Fed economist John Krainer and researcher Chishen Wei wrote a Fed letter on price to rent ratios: House Prices and Fundamental Value. Kainer and Wei presented a price-to-rent ratio using the OFHEO house price index and the Owners' Equivalent Rent (OER) from the BLS.
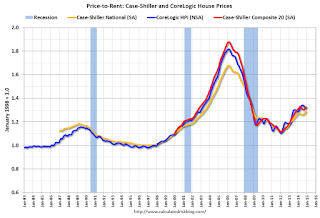
This graph shows the price to rent ratio (January 1998 = 1.0).
On a price-to-rent basis, the Case-Shiller National index is back to May 2003 levels, the Composite 20 index is back to December 2002 levels, and the CoreLogic index is back to March 2003.
In real terms, and as a price-to-rent ratio, prices are mostly back to early 2000 levels - and maybe moving a little sideways now.
Yellen: Semiannual Monetary Policy Report to the Congress
by Calculated Risk on 2/24/2015 10:00:00 AM
Federal Reserve Chair Janet Yellen testimony "Semiannual Monetary Policy Report to the Congress" Before the Senate Banking, Housing, and Urban Affairs Committee, Washington, D.C. (starts at 10 AM ET):
The FOMC's assessment that it can be patient in beginning to normalize policy means that the Committee considers it unlikely that economic conditions will warrant an increase in the target range for the federal funds rate for at least the next couple of FOMC meetings. If economic conditions continue to improve, as the Committee anticipates, the Committee will at some point begin considering an increase in the target range for the federal funds rate on a meeting-by-meeting basis. Before then, the Committee will change its forward guidance. However, it is important to emphasize that a modification of the forward guidance should not be read as indicating that the Committee will necessarily increase the target range in a couple of meetings. Instead the modification should be understood as reflecting the Committee's judgment that conditions have improved to the point where it will soon be the case that a change in the target range could be warranted at any meeting. Provided that labor market conditions continue to improve and further improvement is expected, the Committee anticipates that it will be appropriate to raise the target range for the federal funds rate when, on the basis of incoming data, the Committee is reasonably confident that inflation will move back over the medium term toward our 2 percent objective.Here is the C-Span Link
It continues to be the FOMC's assessment that even after employment and inflation are near levels consistent with our dual mandate, economic conditions may, for some time, warrant keeping the federal funds rate below levels the Committee views as normal in the longer run. It is possible, for example, that it may be necessary for the federal funds rate to run temporarily below its normal longer-run level because the residual effects of the financial crisis may continue to weigh on economic activity. As such factors continue to dissipate, we would expect the federal funds rate to move toward its longer-run normal level. In response to unforeseen developments, the Committee will adjust the target range for the federal funds rate to best promote the achievement of maximum employment and 2 percent inflation.
emphasis added
Here is the Bloomberg TV link.
Case-Shiller: National House Price Index increased 4.6% year-over-year in December
by Calculated Risk on 2/24/2015 09:05:00 AM
S&P/Case-Shiller released the monthly Home Price Indices for December ("December" is a 3 month average of October, November and December prices).
This release includes prices for 20 individual cities, two composite indices (for 10 cities and 20 cities) and the monthly National index.
Note: Case-Shiller reports Not Seasonally Adjusted (NSA), I use the SA data for the graphs.
From S&P: Home Prices Grew at Twice the Rate of Inflation in 2014 According to the S&P/Case-Shiller Home Price Indices
Data released today for December 2014 shows a slight uptick in home prices across the country. Nine cities reported monthly increases in prices ... Both the 10-City and 20-City Composites saw year-over-year increases in December compared to November. The 10-City Composite gained 4.3% year-over-year, up from 4.2% in November. The 20-City Composite gained 4.5% year-over-year, compared to a 4.3% increase in November. The S&P/Case-Shiller U.S. National Home Price Index, which covers all nine U.S. census divisions, recorded a 4.6% annual gain in December 2014 versus 4.7% in November.
...
The National index was slightly negative in December, while both composite Indices were positive. Both the 10- and 20-City Composites reported slight increases of 0.1%, while the National Index posted a -0.1% change for the month. Miami and Denver led all cities in December with increases of 0.7% and 0.5% respectively. Chicago and Cleveland offset those gains by reporting decreases of -0.9% and -0.5% respectively.
...
“The housing recovery is faltering. While prices and sales of existing homes are close to normal, construction and new home sales remain weak. Before the current business cycle, any time housing starts were at their current level of about one million at annual rates, the economy was in a recession” says David M. Blitzer, Managing Director and Chairman of the Index Committee at S&P Dow Jones Indices. “The softness in housing is despite favorable conditions elsewhere in the economy: strong job growth, a declining unemployment rate, continued low interest rates and positive consumer confidence.
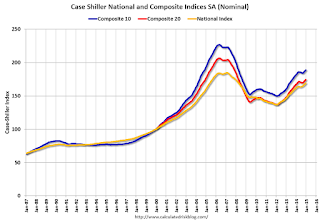 Click on graph for larger image.
 The first graph shows the nominal seasonally adjusted Composite 10, Composite 20 and National indices (the Composite 20 was started in January 2000).
The Composite 10 index is off 16.7% from the peak, and up 0.8% in December (SA).
The Composite 20 index is off 15.6% from the peak, and up 0.9% (SA) in December.
The National index is off 8.4% from the peak, and up 0.7% (SA) in December. The National index is up 23.7% from the post-bubble low set in Dec 2011 (SA).
 The second graph shows the Year over year change in all three indices.
The Composite 10 SA is up 4.3% compared to December 2013.
The Composite 20 SA is up 4.5% year-over-year..
The National index SA is up 4.6% year-over-year.
Prices increased (SA) in all 20 of the 20 Case-Shiller cities in December seasonally adjusted. (Prices increased in 9 of the 20 cities NSA) Prices in Las Vegas are off 41.6% from the peak, and prices in Denver and Dallas are at new highs (SA).
This was close to the consensus forecast for a 4.7% YoY increase for the National index. I'll have more on house prices later.
Monday, February 23, 2015
Tuesday: Yellen Testimony, Case-Shiller House Prices
by Calculated Risk on 2/23/2015 06:32:00 PM
A few excerpts from a preview of Yellen's Testimony by Goldman Sachs economists Kris Dawsey and Chris Mischaikow:
Fed Chair Yellen will be presenting her semi-annual monetary policy testimony—sometimes called the "Humphrey-Hawkins" testimony—on Tuesday and Wednesday of this week (February 24 and 25). We expect Yellen not to stray far from the message of the January FOMC statement and meeting minutes, and we do not think she will preempt the Committee by sending a strong signal on whether "patience" will be removed from the statement at the March meeting.Tuesday:
The testimony will probably not be a major market mover. Indeed, the average absolute yield change around the Fed Chair's semi-annual testimony has declined over time and is considerably lower than the average absolute change around post-FOMC press conferences. Nonetheless, to the extent there are risks to our "don't rock the boat" expectation, we think they are skewed toward a slightly more dovish tilt.
...
The Fed will also release its semi-annual Monetary Policy Report at 10:00AM on Tuesday February 24, which is a roughly fifty-page document that provides additional background, charts, etc. supporting the Chair's testimony. Typically, this document generates very little interest. However, the July statement that "valuation metrics in some sectors do appear substantially stretched—particularly those for smaller firms in the social media and biotechnology industries," received considerable attention.
• At 9:00 AM ET, S&P/Case-Shiller House Price Index for December. Although this is the December report, it is really a 3 month average of October, November and December prices. The consensus is for a 4.7% year-over-year increase in the National Index for December. The Zillow forecast is for the National Index to increase 4.7% year-over-year in December, and for prices to increase 0.5% month-to-month seasonally adjusted.
• At 10:00 AM, Testimony, Fed Chair Janet Yellen, Semiannual Monetary Policy Report to the Congress, Before the Senate Banking, Housing, and Urban Affairs Committee, Washington, D.C.
• Also at 10:00 AM, Richmond Fed Survey of Manufacturing Activity for February.
• Also at 10:00 AM, Conference Board's consumer confidence index for February. The consensus is for the index to decrease to 99.1 from 102.9.
A Few Comments on January Existing Home Sales
by Calculated Risk on 2/23/2015 03:41:00 PM
Inventory is still very low (down 0.5% year-over-year in January). This will be important to watch over the next few months at the start of the Spring buying season.
Note: As usually happens, housing economist Tom Lawler's estimate was closer than the consensus to the NAR reported sales rate.
Also, the NAR reported total sales were up 3.2% from January 2014, however normal equity sales were up even more, and distressed sales down sharply. From the NAR (from a survey that is far from perfect):
Distressed sales – foreclosures and short sales – were 11 percent of sales in January, unchanged from last month but down from 15 percent a year ago. Eight percent of January sales were foreclosures and 3 percent were short sales.Last year in December the NAR reported that 15% of sales were distressed sales.
A rough estimate: Sales in January 2014 were reported at 4.67 million SAAR with 15% distressed. That gives 701 thousand distressed (annual rate), and 3.97 million equity / non-distressed. In January 2015, sales were 4.82 million SAAR, with 11% distressed. That gives 530 thousand distressed - a decline of about 24% from January 2014 - and 4.29 million equity. Although this survey isn't perfect, this suggests distressed sales were down sharply - and normal sales up around 8%.
Important: If total existing sales decline a little, or move side-ways - due to fewer distressed sales- that is a positive sign for real estate.
The following graph shows existing home sales Not Seasonally Adjusted (NSA).
 Click on graph for larger image.
Sales NSA in January (red column) were slightly higher than last year (NSA), and below sales in January 2013.
Earlier:
• Existing Home Sales in January: 4.82 million SAAR, Inventory down slightly Year-over-year
Black Knight: House Price Index down slightly in December, Up 4.5% year-over-year
by Calculated Risk on 2/23/2015 12:45:00 PM
Note: I follow several house price indexes (Case-Shiller, CoreLogic, Black Knight, Zillow, FHFA, FNC and more). Note: Black Knight uses the current month closings only (not a three month average like Case-Shiller or a weighted average like CoreLogic), excludes short sales and REOs, and is not seasonally adjusted.
From Black Knight: U.S. Home Prices Down 0.1 Percent for the Month; Up 4.5 Percent Year-Over-Year
Today, the Data and Analytics division of Black Knight Financial Services released its latest Home Price Index (HPI) report, based on December 2014 residential real estate transactions. The Black Knight HPI combines the company’s extensive property and loan-level databases to produce a repeat sales analysis of home prices as of their transaction dates every month for each of more than 18,500 U.S. ZIP codes. The Black Knight HPI represents the price of non-distressed sales by taking into account price discounts for REO and short sales.The Black Knight HPI decreased 0.1% percent in December, and is off 10.2% from the peak in June 2006 (not adjusted for inflation).
The year-over-year increases had been getting steadily smaller since peaking in 2013 - as shown in the table below - but the YoY increase has been about the same for the last four months:
| Month | YoY House Price Increase |
|---|---|
| Jan-13 | 6.7% |
| Feb-13 | 7.3% |
| Mar-13 | 7.6% |
| Apr-13 | 8.1% |
| May-13 | 7.9% |
| Jun-13 | 8.4% |
| Jul-13 | 8.7% |
| Aug-13 | 9.0% |
| Sep-13 | 9.0% |
| Oct-13 | 8.8% |
| Nov-13 | 8.5% |
| Dec-13 | 8.4% |
| Jan-14 | 8.0% |
| Feb-14 | 7.6% |
| Mar-14 | 7.0% |
| Apr-14 | 6.4% |
| May-14 | 5.9% |
| June-14 | 5.5% |
| July-14 | 5.1% |
| Aug-14 | 4.9% |
| Sep-14 | 4.6% |
| Oct-14 | 4.5% |
| Nov-14 | 4.5% |
| Dec-14 | 4.5% |
The press release has data for the 20 largest states, and 40 MSAs.
Black Knight shows prices off 41.0% from the peak in Las Vegas, off 34.3% in Orlando, and 32.0% off from the peak in Riverside-San Bernardino, CA (Inland Empire). Prices are at new highs in Colorado and Texas (Denver, Austin, Dallas, Houston). Prices are also at new highs in Nashville, TN, and San Jose, CA.
Note: Case-Shiller for December will be released tomorrow.
Existing Home Sales in January: 4.82 million SAAR, Inventory down slightly Year-over-year
by Calculated Risk on 2/23/2015 10:00:00 AM
The NAR reports: Existing-Home Sales Cool in January As Available Inventory Remains Subdued
Total existing-home sale1, which are completed transactions that include single-family homes, townhomes, condominiums and co-ops, fell 4.9 percent to a seasonally adjusted annual rate of 4.82 million in January (lowest since last April at 4.75 million) from an upwardly-revised 5.07 million in December. Despite January’s decline, sales are higher by 3.2 percent than a year ago. ...
Total housing inventory at the end of January increased 0.5 percent to 1.87 million existing homes available for sale, but is 0.5 percent lower than a year ago (1.88 million). Unsold inventory is at a 4.7-month supply at the current sales pace – up from 4.4 months in December.
 Click on graph for larger image.
This graph shows existing home sales, on a Seasonally Adjusted Annual Rate (SAAR) basis since 1993.
Sales in January (4.82 million SAAR) were 4.9% lower than last month, and were 3.2% above the January 2014 rate.
The second graph shows nationwide inventory for existing homes.
 According to the NAR, inventory increased to 1.87 million in January from 1.86 million in December. Headline inventory is not seasonally adjusted, and inventory usually decreases to the seasonal lows in December and January, and peaks in mid-to-late summer.
The third graph shows the year-over-year (YoY) change in reported existing home inventory and months-of-supply. Since inventory is not seasonally adjusted, it really helps to look at the YoY change. Note: Months-of-supply is based on the seasonally adjusted sales and not seasonally adjusted inventory.
 Inventory decreased 0.5% year-over-year in January compared to January 2014.
 Months of supply was at 4.7 months in January.
This was below expectations of sales of 5.00 million. For existing home sales, a key number is inventory - and inventory is still low. I'll have more later ...
Chicago Fed: "Index shows economic growth picked up slightly in January"
by Calculated Risk on 2/23/2015 08:36:00 AM
The Chicago Fed released the national activity index (a composite index of other indicators): Index shows economic growth picked up slightly in January
Led by improvements in production-related indicators, the Chicago Fed National Activity Index (CFNAI) edged up to +0.13 in January from –0.07 in December. Three of the four broad categories of indicators that make up the index increased from December, and only one of the four categories made a negative contribution to the index in January.This graph shows the Chicago Fed National Activity Index (three month moving average) since 1967.
The index’s three-month moving average, CFNAI-MA3, ticked down to +0.33 in January from +0.34 in December. January’s CFNAI-MA3 suggests that growth in national economic activity was above its historical trend. The economic growth reflected in this level of the CFNAI-MA3 suggests modest inflationary pressure from economic activity over the coming year.
emphasis added
 Click on graph for larger image.
This suggests economic activity was above the historical trend in January (using the three-month average).
According to the Chicago Fed:
What is the National Activity Index? The index is a weighted average of 85 indicators of national economic activity drawn from four broad categories of data: 1) production and income; 2) employment, unemployment, and hours; 3) personal consumption and housing; and 4) sales, orders, and inventories.
A zero value for the index indicates that the national economy is expanding at its historical trend rate of growth; negative values indicate below-average growth; and positive values indicate above-average growth.
Sunday, February 22, 2015
Monday: Existing Home Sales
by Calculated Risk on 2/22/2015 07:16:00 PM
There are ships everywhere at anchor outside of Long Beach and Los Angeles. It sounds like it will take a few months to clear the backlog (although this article says six to eight weeks). From Bloomberg: West Coast Ports Come Back to Life
The Port of Los Angeles, the nation’s busiest, handled 29 percent less cargo in January 2015 compared with January 2014, and volumes were down 19 percent in neighboring Long Beach, the second-busiest, according to statements from both ports.Monday:
...
It will take six to eight weeks for West Coast ports to recover from the cargo backlog, according to the Port of Oakland and the National Retail Federation, which represents stores that resorted to stockpiling seasonal merchandise in warehouses and shifting to East and Gulf coast ports.
• At 8:30 AM ET, the Chicago Fed National Activity Index for January. This is a composite index of other data.
• At 10:00 AM, Existing Home Sales for January from the National Association of Realtors (NAR). The consensus is for sales of 5.00 million on seasonally adjusted annual rate (SAAR) basis. Sales in December were at a 5.04 million SAAR. Economist Tom Lawler estimates the NAR will report sales of 4.90 million SAAR.
• At 10:30 AM, Dallas Fed Manufacturing Survey for February.
Weekend:
• Schedule for Week of February 22, 2015
From CNBC: Pre-Market Data and Bloomberg futures: currently S&P futures are flat and DOW futures are down slightly (fair value).
Oil prices were down over the last week with WTI futures at $50.39 per barrel and Brent at $60.22 per barrel. A year ago, WTI was at $103, and Brent was at $110 - so prices are down close to half year-over-year.
Below is a graph from Gasbuddy.com for nationwide gasoline prices. Nationally prices are up to $2.30 per gallon (down over $1.00 per gallon from a year ago). If you click on "show crude oil prices", the graph displays oil prices for WTI, not Brent; gasoline prices in most of the U.S. are impacted more by Brent prices.
| Orange County Historical Gas Price Charts Provided by GasBuddy.com |


