by Calculated Risk on 6/05/2014 09:22:00 AM
Thursday, June 05, 2014
CoreLogic: Year Over Year, the Negative Equity Share Has Declined by 3.5 Million Properties
From CoreLogic: CoreLogic Reports 312,000 Residential Properties Regained Equity in Q1 2014
CoreLogic ... today released new analysis showing more than 300,000 homes returned to positive equity in the first quarter of 2014, bringing the total number of mortgaged residential properties with equity to more than 43 million. The CoreLogic analysis indicates that approximately 6.3 million homes, or 12.7 percent of all residential properties with a mortgage, were still in negative equity as of Q1 2014 compared to 6.6 million homes, or 13.4 percent for Q4 2013. As a year-over-year comparison, the negative equity share was 20.2 percent, or 9.8 million homes, in Q1 2013.
... Of the 43 million residential properties with equity, approximately 10 million have less than 20-percent equity. Borrowers with less than 20-percent equity, referred to as “under-equitied,” may have a more difficult time refinancing their existing home or obtaining new financing to sell and buy another home due to underwriting constraints. Under-equitied mortgages accounted for 20.6 percent of all residential properties with a mortgage nationwide in Q1 2014, with more than 1.5 million residential properties at less than 5-percent equity, referred to as near-negative equity. Properties that are near-negative equity are considered at risk if home prices fall. ...
Despite the massive improvement in prices and reduction in negative equity over the last few years, many borrowers still lack sufficient equity to move and purchase a home,” said Sam Khater, deputy chief economist for CoreLogic. “One in five borrowers have less than 10 percent equity in their property, which is not enough to cover the down payment and additional costs associated with a conventional mortgage.”
emphasis added
 Click on graph for larger image.
This graph shows the break down of negative equity by state. Note: Data not available for some states. From CoreLogic:
"Nevada had the highest percentage of mortgaged properties in negative equity at 29.4 percent, followed by Florida (26.9 percent), Mississippi (20.1 percent), Arizona (20.1 percent) and Illinois (19.7 percent). These top five states combined account for 31.1 percent of negative equity in the United States. "
Note: The share of negative equity is still very high in Nevada and Florida, but down significantly from a year ago (Q1 2013) when the negative equity share in Nevada was at 45.4 percent, and at 38.1 percent in Florida.
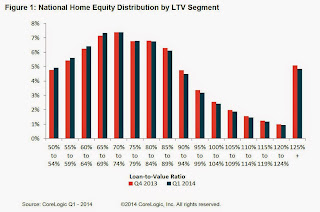
 The second graph shows the distribution of home equity in Q1 compared to Q4 2013. Close to 5% of residential properties have 25% or more negative equity, down slightly from Q4.
In Q1 2013, there were 9.8 million properties with negative equity - now there are 6.3 million. A significant change.
Weekly Initial Unemployment Claims increase to 312,000
by Calculated Risk on 6/05/2014 08:30:00 AM
The DOL reports:
In the week ending May 31, the advance figure for seasonally adjusted initial claims was 312,000, an increase of 8,000 from the previous week's revised level. The previous week's level was revised up by 4,000 from 300,000 to 304,000. The 4-week moving average was 310,250, a decrease of 2,250 from the previous week's revised average. This is the lowest level for this average since June 2, 2007 when it was 307,500. The previous week's average was revised up by 1,000 from 311,500 to 312,500.The previous week was revised up from 300,000.
There were no special factors impacting this week's initial claims.
The following graph shows the 4-week moving average of weekly claims since January 1971.
 Click on graph for larger image.
The dashed line on the graph is the current 4-week average. The four-week average of weekly unemployment claims decreased to 310,250.
This was close to the consensus forecast of 310,000. The 4-week average is at the lowest level since June 2007 and is at normal levels for an expansion.
Wednesday, June 04, 2014
Thursday: ECB, Unemployment Claims, Flow of Funds
by Calculated Risk on 6/04/2014 07:05:00 PM
A few analyst views on the ECB decision tomorrow via the WSJ: The Market Says the ECB Will Act. What to Expect Next. As an example from Credit Agricole economists:
“We do not believe the ECB can afford to do nothing this week after having intentionally raised hopes of further monetary easing. While the maximum impact from an ECB rate cut would come with a negative deposit rate and liquidity-boosting measures, […] there is no guarantee that negative rates alone would boost bank lending. However, credit easing measures are becoming increasingly likely, either indirectly, via LTRO, or directly, via private quantitative easing. Communication will be an important part of the June ‘package’. We expect ECB President Mario Draghi to leave the door open to unconventional action in case inflation fails to pick up by year-end.”Should be interesting!
Wednesday:
• 7:45 AM ET (1:45 PM CET) the ECB meets in Frankfurt. From Nomura:
We expect the ECB to deliver a package of measures on 5 June to ease monetary policy. We expect a 10bp cut to all key interest rates, taking the refi rate down to 0.15%, the deposit rate negative for the first time to -0.10% and the marginal lending facility rate down to 0.65%. We also expect an extension of the forward guidance on liquidity provisions, with the fixed-rate full-allotment procedure extended by a further 12 months to at least the end of June 2016. We also expect the ECB to launch a targeted LTRO programme in June (60% probability), to address credit weakness and risks to the recovery from this channel.• Early: the Trulia Price Rent Monitors for May. This is the index from Trulia that uses asking house prices adjusted both for the mix of homes listed for sale and for seasonal factors.
• At 8:30 AM, the initial weekly unemployment claims report will be released. The consensus is for claims to increase to 310 thousand from 300 thousand.
• At 12:00 PM, the Q1 Flow of Funds Accounts of the United States from the Federal Reserve.
Fed's Beige Book: Non-residential construction activity picking up, Residential is Mixed
by Calculated Risk on 6/04/2014 02:07:00 PM
Fed's Beige Book "Prepared at the Federal Reserve Bank of New York and based on information collected on or before May 23, 2014."
All twelve Federal Reserve Districts report that economic activity expanded during the current reporting period. The pace of growth was characterized as moderate in the Boston, New York, Richmond, Chicago, Minneapolis, Dallas, and San Francisco Districts, and modest in the remaining regions. Compared with the previous report, the pace of growth picked up in the Cleveland and St. Louis Districts but slowed slightly in the Kansas City District.And on real estate:
Residential real estate activity has been mixed since the last report, with a lack of inventory at times cited as a constraining factor. Boston, New York, and Kansas City indicated that existing home sales were being held back due to low or dwindling inventories. Sales rose modestly in the Cleveland, Richmond, Atlanta, Chicago, and Dallas Districts, with inventories described as low in Richmond and Chicago and declining in Cleveland. Sales activity, however, softened in the Philadelphia, St. Louis, Minneapolis, and San Francisco Districts, though Philadelphia did note some signs of improvement in May. San Francisco attributed some of the weakness to severe weather. Home prices continued to increase across most of the Districts; Boston reported some pullback in prices of single-family homes, though condo prices in that District, as well as in New York, rose. New York, Chicago, and Dallas reported strengthening demand for apartment rentals, whereas Boston noted some slackening in demand.Some more positive comments on commercial real estate. Residential is mixed.
Homebuilders gave mixed reports on new home sales and construction in recent weeks: Residential construction strengthened, to varying degrees in the New York, Richmond, Atlanta, Chicago, Kansas City, and Dallas Districts. However, Philadelphia, St. Louis, and Minneapolis indicated some weakening in new home sales and construction. Overall residential construction activity was mixed across the San Francisco District, though contacts there expect activity will increase over the next year. Both Boston and New York reported a good deal of recent multi-family development at the high end of the market, while Cleveland, Richmond, Atlanta, Chicago, and Dallas noted strength in multi-family construction more generally.
Non-residential construction activity was steady to stronger in most Districts over the latest reporting period, with strengthening reported in the Boston, St. Louis, and Kansas City Districts. Cleveland described pipeline activity as strong, and San Francisco noted that a number of public and commercial high rise projects have been announced or are underway. In contrast, Minneapolis reported a decline in non-residential construction activity, and Philadelphia characterized it as steady at a low level; Chicago described activity as mixed--with office construction weak but industrial and some segments of retail fairly strong. The commercial real estate market was mostly stronger since the last report. Leasing activity and vacancy rates improved in the Richmond, Atlanta, Chicago, Minneapolis, Kansas City, Dallas, and San Francisco Districts, and were generally steady in the Boston, New York, Philadelphia, and St. Louis Districts. Dallas described market conditions as robust.
emphasis added
ISM Non-Manufacturing Index increased in May to 56.3
by Calculated Risk on 6/04/2014 10:00:00 AM
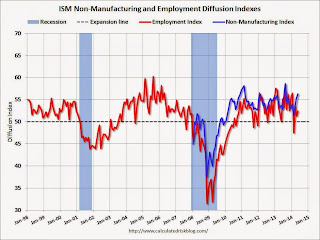
The May ISM Non-manufacturing index was at 56.3%, up from 55.5% in April. The employment index increased in May to 52.4%, up from 51.3% in April. Note: Above 50 indicates expansion, below 50 contraction.
From the Institute for Supply Management: May 2014 Non-Manufacturing ISM Report On Business®
Economic activity in the non-manufacturing sector grew in May for the 52nd consecutive month, say the nation's purchasing and supply executives in the latest Non-Manufacturing ISM® Report On Business®.
The report was issued today by Anthony Nieves, CPSM, C.P.M., CFPM, chair of the Institute for Supply Management® (ISM®) Non-Manufacturing Business Survey Committee. "The NMI® registered 56.3 percent in May, 1.1 percentage points higher than April are reading of 55.2 percent. This represents continued growth at a faster rate in the Non-Manufacturing sector and is the highest reading for the index since August 2013, when the index registered 57.9 percent. The Non-Manufacturing Business Activity Index increased to 62.1 percent, which is 1.2 percentage points higher than the April reading of 60.9 percent, reflecting growth for the 58th consecutive month at a faster rate. The New Orders Index registered 60.5 percent, 2.3 percentage points higher than the reading of 58.2 percent registered in April. The Employment Index increased 1.1 percentage points to 52.4 percent from the April reading of 51.3 percent and indicates growth for the third consecutive month and at a faster rate. The Prices Index increased 0.6 percentage point from the April reading of 60.8 percent to 61.4 percent, indicating prices increased at a faster rate in May when compared to April. According to the NMI®, 17 non-manufacturing industries reported growth in May. The majority of respondents' comments indicate that that there is steady incremental growth and project a positive outlook on business conditions."
emphasis added
 Click on graph for larger image.
This graph shows the ISM non-manufacturing index (started in January 2008) and the ISM non-manufacturing employment diffusion index.
This was above the consensus forecast of 55.3% and suggests faster expansion in May than in April.
Trade Deficit increased in April to $47.2 Billion
by Calculated Risk on 6/04/2014 08:30:00 AM
The Department of Commerce reported this morning:
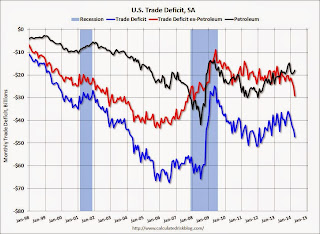
[T]otal April exports of $193.3 billion and imports of $240.6 billion resulted in a goods and services deficit of $47.2 billion, up from $44.2 billion in March, revised. April exports were $0.3 billion less than March exports of $193.7 billion. April imports were $2.7 billion more than March imports of $237.8 billion.The trade deficit was much larger than the consensus forecast of $41.0 billion.
The first graph shows the monthly U.S. exports and imports in dollars through April 2014.
 Click on graph for larger image.
Both imports and exports increased in April.
Exports are 17% above the pre-recession peak and up 3% compared to April 2013; imports are about 4% above the pre-recession peak, and up about 5% compared to April 2013.
The second graph shows the U.S. trade deficit, with and without petroleum, through April.
 The blue line is the total deficit, and the black line is the petroleum deficit, and the red line is the trade deficit ex-petroleum products.
Oil imports averaged $95.48 in April, up from $93.91 in March, and down from $97.74 in April 2013. The petroleum deficit has generally been declining and is the major reason the overall deficit has declined since early 2012.
The trade deficit with China increased to $27.3 billion in April, from $24.2 billion in April 2013. More than half of the trade deficit is related to China.
Overall it appears trade is picking up slightly.
ADP: Private Employment increased 179,000 in May
by Calculated Risk on 6/04/2014 08:21:00 AM
Private sector employment increased by 179,000 jobs from April to May according to the May ADP National Employment Report®. ... he report, which is derived from ADP’s actual payroll data, measures the change in total nonfarm private employment each month on a seasonally-adjusted basis.This was below the consensus forecast for 210,000 private sector jobs added in the ADP report.
...
Mark Zandi, chief economist of Moody’s Analytics, said, "Job growth moderated in May. The slowing in growth was concentrated in Professional/Business Services and companies with 50-999 employees. The job market has yet to break out from the pace of growth that has prevailed over the last three years.”
Note: ADP hasn't been very useful in directly predicting the BLS report on a monthly basis, but it might provide a hint. The BLS report for May will be released on Friday.
MBA: Mortgage Applications Decrease in Latest Survey, Mortgage Rates "lowest levels in close to a year"
by Calculated Risk on 6/04/2014 07:01:00 AM
From the MBA: Mortgage Applications Decrease in Latest MBA Weekly Survey
Mortgage applications decreased 3.1 percent from one week earlier, according to data from the Mortgage Bankers Association’s (MBA) Weekly Mortgage Applications Survey for the week ending May 30, 2014. This week’s results include an adjustment for the Memorial Day holiday. ...
The Refinance Index decreased 3 percent from the previous week. The seasonally adjusted Purchase Index decreased 4 percent from one week earlier. ...
...
Interest rates for most products fell to their lowest levels in close to a year.
The average contract interest rate for 30-year fixed-rate mortgages with conforming loan balances ($417,000 or less) decreased to 4.26 percent from 4.31 percent, with points decreasing to 0.13 from 0.15 (including the origination fee) for 80 percent loan-to-value ratio (LTV) loans.
emphasis added
 Click on graph for larger image.
The first graph shows the refinance index.
The refinance index is down 73% from the levels in May 2013 (one year ago).
As expected, refinance activity is very low this year.
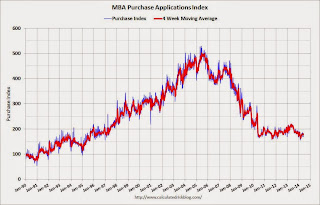
 The second graph shows the MBA mortgage purchase index.
 According to the MBA, the unadjusted purchase index is down about 17% from a year ago.
Note: It appears mortgage rates will be down year-over-year in a few weeks.
Tuesday, June 03, 2014
Wednesday: ADP Employment, Trade Deficit, ISM Service, Beige Book
by Calculated Risk on 6/03/2014 06:45:00 PM
From Jon Hilsenrath at the WSJ: Fed Officials Growing Wary of Market Complacency
[M]easures of risk aversion and market volatility show an especially striking sense of investor calm. The VIX, which tracks expected stock-market fluctuations based on options trading, has gone 74 straight weeks below its long-run average—a run of steadiness not seen since 2006 and 2007."Complacency" may be a problem, but this isn't 2006 and 2007. In January 2007 I predicted a recession would start that year as a result of the housing bust (made it by one month since the recession started in December 2007!). Now - I don't see a recession any time soon.
...
New York Fed President William Dudley warned in a question-and-answer session after a speech last month that he was nervous that unusually low volatility in markets was breeding too much risk-taking.
Wednesday:
• At 7:00 AM ET, the Mortgage Bankers Association (MBA) will release the results for the mortgage purchase applications index.
• At 8:15 AM, the ADP Employment Report for May. This report is for private payrolls only (no government). The consensus is for 210,000 payroll jobs added in May, down from 220,000 in April.
• At 8:30 AM, the Trade Balance report for April from the Census Bureau. The consensus is for the U.S. trade deficit to be at $41.0 billion in April from $40.4 billion in March.
• At 10:00 AM, the ISM non-Manufacturing Index for May. The consensus is for a reading of 55.3, up from 55.2 in April. Note: Above 50 indicates expansion.
• At 2:00 PM, the Federal Reserve Beige Book, an informal review by the Federal Reserve Banks of current economic conditions in their Districts.
U.S. Light Vehicle Sales increase to 16.7 million annual rate in May, Highest Rate since 2007
by Calculated Risk on 6/03/2014 02:42:00 PM
Based on an AutoData estimate, light vehicle sales were at a 16.77 million SAAR in May. That is up 9% from May 2013, and up 5% from the sales rate last month.
This is the highest sales rate since February 2007.
Note: WardsAuto is currently estimating 16.70 million SAAR (updated final), see: May 2014 Sales Thread: Late-Month Sales Send SAAR Soaring
This was above the consensus forecast of 16.1 million SAAR (seasonally adjusted annual rate).
 Click on graph for larger image.
This graph shows the historical light vehicle sales from the BEA (blue) and an estimate for May (red, light vehicle sales of 16.77 million SAAR from AutoData).
Severe weather clearly impacted sales in January and February. Since then vehicle sales have been solid.
The second graph shows light vehicle sales since the BEA started keeping data in 1967.
 Note: dashed line is current estimated sales rate.
Unlike residential investment, auto sales bounced back fairly quickly following the recession and were a key driver of the recovery.
Looking forward, the growth rate will slow for auto sales.


