by Calculated Risk on 11/05/2013 01:09:00 PM
Tuesday, November 05, 2013
Employment Preview: Upside Payroll Surprise?
There will be some ugly numbers in the October employment report to be released on Friday. The unemployment rate will probably increase sharply, and the number of part time workers for economic reasons will also increase. Excerpts from the BLS on the impact of the government shutdown:
For October 2013, the household survey reference week was Sunday, October 6, through Saturday, October 12. During this period, some federal government agencies were closed or were operating at reduced staffing levels because of the lapse in their funding. The federal employees and contractors who work for those agencies may have been off work for all or part of the week. ... Workers who indicate that they were not working during the entire survey reference week and expected to be recalled to their jobs should be classified in the household survey as unemployed, on temporary layoff.These shutdown related ugly numbers should be reversed in the November report (due early December).
Workers who usually work full time but indicate that they had worked fewer than 35 hours in the reference week because of the shutdown should be classified as employed part time for economic reasons.
However the impact on the October establishment survey is less certain. The consensus forecast is for an increase of 120,000 non-farm payroll jobs in October, down from the 148,000 non-farm payroll jobs added in September.
Here is a summary of recent data:
• The ADP employment report showed an increase of 130,000 private sector payroll jobs in October. This was below expectations of 138,000 private sector payroll jobs added. The ADP report hasn't been very useful in predicting the BLS report for any one month. But in general, this suggests employment growth close to expectations.
• The ISM manufacturing employment index decreased in October to 53.2% from 55.4% in September. A historical correlation between the ISM manufacturing employment index and the BLS employment report for manufacturing, suggests that private sector BLS manufacturing payroll jobs were mostly unchanged in October. The ADP report indicated a 5,000 increase for manufacturing jobs in October.
The ISM non-manufacturing employment index increased in October to 56.2% from 52.7% in September. A historical correlation between the ISM non-manufacturing index and the BLS employment report for non-manufacturing, suggests that private sector BLS reported payroll jobs for non-manufacturing increased by about 235,000 in October.
Taken together, these surveys suggest around 235,000 jobs added in October - well above the consensus forecast.
• Initial weekly unemployment claims averaged close to 356,000 in October. This was up sharply from an average of 305,000 in September. However there were some computer problems in California, and claims in September were probably too low - and claims in October too high. So this might not be useful this month.
• The final October Reuters / University of Michigan consumer sentiment index decreased to 73.2 from the September reading of 77.5. This is frequently coincident with changes in the labor market, but in this case the decline was probably related to the government shutdown.
• The small business index from Intuit showed a small decrease in small business employment in October.
• Conclusion: As usual the data was mixed. The ADP report was a little lower in October than in September, however the ISM surveys suggest an increase in hiring. Weekly claims for the reference week were higher (probably mostly due to computer issues), and consumer sentiment decreased (due to the government shutdown).
There is always some randomness to the employment report - and there are reasons for pessimism (ADP, unemployment claims, consumer sentiment), however with so many questions about the data, I'll lean towards the ISM surveys and my guess is the BLS will report more than the 120,000 consensus jobs added in October.
There are many questions about this employment report because of the government shutdown, and the November report will be much more important.
Trulia: Asking House Price Increases "Slowing Down"
by Calculated Risk on 11/05/2013 11:38:00 AM
From Trulia this morning: Trulia Reports Asking Home Prices Still Slowing Down Despite Rising 11.7 Percent Year-over-year in October
In October, asking home prices increased 0.6 percent month-over-month (M-o-M), the second-slowest monthly gain in seven months. This continued slowdown in asking prices is largely due to expanding inventory, rising mortgage rates, and declining investor activity. Asking prices could potentially slow further if consumer confidence suffers from the ongoing budget uncertainty and future shutdown and debt-default worries. Nevertheless, the monthly, quarterly, and yearly gains are all still high compared with historical norms. In fact, asking prices rose 11.7 percent year-over-year (Y-o-Y) – the highest increase since the housing bubble burst.Note: These asking prices are SA (Seasonally Adjusted) - and adjusted for the mix of homes - and this suggests further house price increases over the next few months on a seasonally adjusted basis (but the year-over-year increases will probably slow).
...
Nationally, rents rose 2.7 percent Y-o-Y. Among the 25 largest rental markets, rents rose most in San Francisco, Portland, and Seattle, while falling slightly in Washington D.C. and Philadelphia. Unfortunately for Bay Area renters, San Francisco now has the steepest Y-o-Y increase in rents and the highest median rent: $3,250 for a two-bedroom unit, edging out the New York metro area where the current median rent for a similarly-sized unit is $3,150 per month. At the other extreme, median rent for a two-bedroom unit is less than $1,000 in Phoenix, St. Louis, and Las Vegas.
“Although October’s asking home prices rose at the second-slowest pace in seven months, prices are still rising unsustainably fast,” said Jed Kolko, Trulia’s Chief Economist. “Even though the market is far from bubble territory, we still see the effects of fast-rising prices, including investors flipping homes and would-be sellers waiting longer to put their homes on the market.”
emphasis added
More from Kolko: Though Slowing, Asking Home Prices Still Climbing Fast
ISM Non-Manufacturing Index at 55.4 indicates faster expansion in October
by Calculated Risk on 11/05/2013 10:00:00 AM
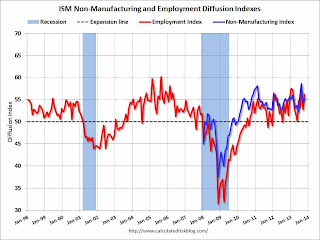
The October ISM Non-manufacturing index was at 55.4%, up from 54.4% in September. The employment index increased in October to 56.2%, down from 52.7% in September. Note: Above 50 indicates expansion, below 50 contraction.
From the Institute for Supply Management: October 2013 Non-Manufacturing ISM Report On Business®
Economic activity in the non-manufacturing sector grew in October for the 46th consecutive month, say the nation's purchasing and supply executives in the latest Non-Manufacturing ISM Report On Business®.
The report was issued today by Anthony Nieves, CPSM, C.P.M., CFPM, chair of the Institute for Supply Management™ Non-Manufacturing Business Survey Committee. "The NMI® registered 55.4 percent in October, 1 percentage point higher than September's reading of 54.4 percent. This indicates continued growth at a faster rate in the non-manufacturing sector. The Non-Manufacturing Business Activity Index increased to 59.7 percent, which is 4.6 percentage points higher than the 55.1 percent reported in September, reflecting growth for the 51st consecutive month. The New Orders Index decreased by 2.8 percentage points to 56.8 percent, and the Employment Index increased 3.5 percentage points to 56.2 percent, indicating growth in employment for the 15th consecutive month. The Prices Index decreased 1.1 percentage points to 56.1 percent, indicating prices increased at a slower rate in October when compared to September. According to the NMI®, 10 non-manufacturing industries reported growth in October. Respondents' comments are mixed with the majority reflecting an uptick in business. A number of respondents indicate that they are negatively impacted by the government shutdown."
emphasis added
 Click on graph for larger image.
This graph shows the ISM non-manufacturing index (started in January 2008) and the ISM non-manufacturing employment diffusion index.
This was above the consensus forecast of 54.5% and indicates faster expansion in October than in September.
CoreLogic: House Prices up 12.0% Year-over-year in September
by Calculated Risk on 11/05/2013 08:59:00 AM
Notes: This CoreLogic House Price Index report is for September. The recent Case-Shiller index release was for August. The CoreLogic HPI is a three month weighted average and is not seasonally adjusted (NSA).
From CoreLogic: CoreLogic Reports Home Prices Rise by 12 Percent Year Over Year in September
Home prices nationwide, including distressed sales, increased 12 percent on a year-over-year basis in September 2013 compared to September 2012. This change represents the 19th consecutive monthly year-over-year increase in home prices nationally. On a month-over-month basis, including distressed sales, home prices increased by 0.2 percent in September 2013 compared to August 2013.
Excluding distressed sales, home prices increased on a year-over-year basis by 10.8 percent in September 2013 compared to September 2012. On a month-over-month basis, excluding distressed sales, home prices increased 0.3 percent in September 2013 compared to August 2013. Distressed sales include short sales and real estate owned (REO) transactions.
 Click on graph for larger image.
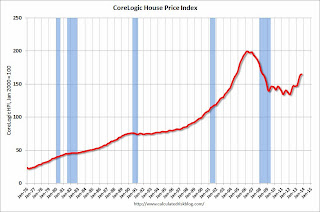
 This graph shows the national CoreLogic HPI data since 1976. January 2000 = 100.
The index was up 0.2% in September, and is up 12.0% over the last year. This index is not seasonally adjusted, and the month-to-month changes will be smaller for next several months.
The index is off 17.5% from the peak - and is up 22.8% from the post-bubble low set in February 2012.
 The second graph is from CoreLogic. The year-over-year comparison has been positive for nineteen consecutive months suggesting house prices bottomed early in 2012 on a national basis (the bump in 2010 was related to the tax credit).
This is the largest year-over-year increase since 2006.
I expect the year-over-year price increases to slow in the coming months.
Monday, November 04, 2013
Tuesday: ISM Service Index
by Calculated Risk on 11/04/2013 10:01:00 PM
Tuesday:
• At 10:0 AM ET, the ISM non-Manufacturing Index for October. The consensus is for a reading of 54.5, up slightly from 54.4 in September. Note: Above 50 indicates expansion, below 50 contraction.
• Also at 10:00 AM, the Trulia Price Rent Monitors for October. This is the index from Trulia that uses asking house prices adjusted both for the mix of homes listed for sale and for seasonal factors.
• Also at 10:00 AM, the Q3 Housing Vacancies and Homeownership report from the Census Bureau. This report is frequently mentioned by analysts and the media to report on the homeownership rate, and the homeowner and rental vacancy rates. However, this report doesn't track with other measures (like the decennial Census and the ACS).
Weekly Update: Housing Tracker Existing Home Inventory up 2.1% year-over-year on Nov 4th
by Calculated Risk on 11/04/2013 06:49:00 PM
Here is another weekly update on housing inventory ... for the third consecutive week, housing inventory is up year-over-year. This suggests inventory bottomed early this year.
There is a clear seasonal pattern for inventory, with the low point for inventory in late December or early January, and then peaking in mid-to-late summer.
The Realtor (NAR) data is monthly and released with a lag (the most recent data was for September). However Ben at Housing Tracker (Department of Numbers) has provided me some weekly inventory data for the last several years.
 Click on graph for larger image.
This graph shows the Housing Tracker reported weekly inventory for the 54 metro areas for 2010, 2011, 2012 and 2013.
In 2011 and 2012, inventory only increased slightly early in the year and then declined significantly through the end of each year.
Inventory in 2013 is now above the same week in 2012 (red is 2013, blue is 2012).
We can be pretty confident that inventory bottomed early this year, and I expect the seasonal decline to be less than usual at the end of the year - so the year-over-year change will continue to increase.
Inventory is still very low, but this increase in inventory should slow house price increases.
Fed Survey: Banks eased lending standards, "little change in loan demand"
by Calculated Risk on 11/04/2013 02:00:00 PM
From the Federal Reserve: The October 2013 Senior Loan Officer Opinion Survey on Bank Lending Practices
The October 2013 Senior Loan Officer Opinion Survey on Bank Lending Practices addressed changes in the standards and terms on, and demand for, bank loans to businesses and households over the past three months. Domestic banks, on balance, reported having eased their lending standards and having experienced little change in loan demand, on average, over the past three months. The survey contained two sets of special questions. Motivated by the increase in long-term interest rates since the spring, the first set of questions asked banks to describe whether they had experienced changes in the volume of applications for residential mortgages and whether they had changed lending policies for new home-purchase loans. The second set of questions examined the standards and terms on subprime auto loans over the past 12 months. This summary is based on the responses from 73 domestic banks and 22 U.S. branches and agencies of foreign banks.
Regarding loans to businesses, the October survey results generally indicated that banks eased their lending policies for commercial and industrial (C&I) loans and experienced little change in demand for such loans over the past three months.2 All domestic banks that eased their C&I lending policies cited increased competition for such loans as an important reason for having done so. ...
The survey results also indicated that banks, on average, did not substantially change standards or terms on lending to households. Modest net fractions of respondents reported having eased standards on prime residential mortgage loans, with a few large banks indicating they had eased standards on those loans.
emphasis added
 Click on graph for larger image.
Here are some charts from the Fed.
This graph shows the change in lending standards and for CRE (commercial real estate) loans.
Banks are loosening their standards for CRE loans, and for various categories of CRE (right half of graph).
The second graph shows the change in demand for CRE loans.
 Banks are seeing a pickup in demand for all categories of CRE.
This suggests (along with the Architecture Billing Index) that we will see an increase in commercial real estate development in the near future.
Fed's Bullard: Need to see "tangible evidence" inflation moving back towards 2% before Taper
by Calculated Risk on 11/04/2013 11:28:00 AM
St Louis Fed President James Bullard was on CNBC this morning. He made a few key points:
1) Inflation is too low, and Bullard would like to see "tangible evidence" that inflation is moving back towards the Fed's goal of 2%. (Note: This was one of the four points I mentioned yesterday for the Fed to start tapering in December).
2) Bullard thinks the Fed should mostly ignore the "bickering in Washington". From MarketWatch:
“It looks like they will be bickering in Washington for a long time to come. So I don’t think we can afford to wait until the political waters are completely calm before we decide to make a decision,” Bullard said.My view is the FOMC will be more inclined to taper if the budget conference committee reaches an agreement by December 13th.
3) Bullard says the October employment report will be "hard to interpret". I think we will see a sharp increase in the unemployment rate, but any increase related to the government shutdown should be unwound in the November report - so I don't think anyone will panic if the unemployment rate jumps from 7.2% to say 7.5% (since there was an obvious reason). Payroll growth will probably be lower in October too.
LPS on Mortgages: New Problem Loan Rates Close to Pre-crisis Levels
by Calculated Risk on 11/04/2013 08:15:00 AM
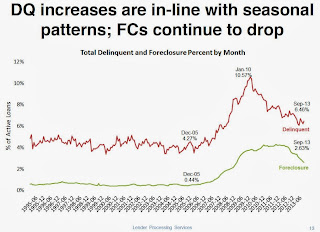
LPS released their Mortgage Monitor report for September today. According to LPS, 6.46% of mortgages were delinquent in September, up from 6.20% in August. LPS reports that 2.63% of mortgages were in the foreclosure process, down from 3.86% in September 2012.
This gives a total of 9.03% delinquent or in foreclosure. It breaks down as:
• 1,935,000 properties that are 30 or more days, and less than 90 days past due, but not in foreclosure.
• 1,331,000 properties that are 90 or more days delinquent, but not in foreclosure.
• 1,328,000 loans in foreclosure process.
For a total of 4,593,000 loans delinquent or in foreclosure in September. This is down from 5,640,000 in September 2012.

This graph from LPS shows percent of loans delinquent and in the foreclosure process over time.
From LPS:
• Delinquencies increased, but in-line with seasonal patternDelinquencies and foreclosures are still high, but moving down - and might be back to normal levels in a couple of years.
• Foreclosure inventories continue to improve with first time foreclosure starts at multi-year lows

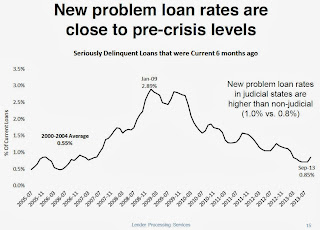
The second graph from LPS shows new problem loans. There are seriously delinquent loans that were current 6 months ago. This is good news going forward (although the lenders are still working through the backlog, especially in judicial foreclosure states).
There is much more in the mortgage monitor.
Sunday, November 03, 2013
Monday: Senior Loan Officer Opinion Survey
by Calculated Risk on 11/03/2013 08:42:00 PM
Monday:
• Early, the LPS September Mortgage Monitor report. This is a monthly report of mortgage delinquencies and other mortgage data.
• At 10:00 AM, the Manufacturers' Shipments, Inventories and Orders (Factory Orders) for both August and September. The consensus is for a 0.3% increase in August orders, and a 1.7% increase in September orders.
• At 2:00 PM, the October 2013 Senior Loan Officer Opinion Survey on Bank Lending Practices from the Federal Reserve. This might show some slight loosening in lending standards.
Weekend:
• Schedule for Week of November 3rd
• Will the Fed "Taper" in December?
From CNBC: Pre-Market Data and Bloomberg futures: the S&P futures are up slightly and DOW futures are up 15 (fair value).
Oil prices are down with WTI futures at $94.60 per barrel and Brent at $105.90 per barrel.
Below is a graph from Gasbuddy.com for nationwide gasoline prices. Nationally prices are around $3.26 per gallon. If you click on "show crude oil prices", the graph displays oil prices for WTI, not Brent; gasoline prices in most of the U.S. are impacted more by Brent prices.
| Orange County Historical Gas Price Charts Provided by GasBuddy.com |


