by Calculated Risk on 10/29/2013 08:30:00 AM
Tuesday, October 29, 2013
Retail Sales declined 0.1% in September
On a monthly basis, retail sales declined 0.1% from August to September (seasonally adjusted), and sales were up 3.2% from September 2012. From the Census Bureau report:
The U.S. Census Bureau announced today that advance estimates of U.S. retail and food services sales for September, adjusted for seasonal variation and holiday and trading-day differences, but not for price changes, were $425.9 billion, a decrease of 0.1 percent from the previous month, but 3.2 percent above September 2012. ... The July to August 2013 percent change was unrevised from +0.2 percent.
 Click on graph for larger image.
This graph shows retail sales since 1992. This is monthly retail sales and food service, seasonally adjusted (total and ex-gasoline).
Retail sales are up 28.5% from the bottom, and now 12.6% above the pre-recession peak (not inflation adjusted)
Retail sales ex-autos increased 0.4%.
Excluding gasoline, retail sales are up 25.6% from the bottom, and now 13.1% above the pre-recession peak (not inflation adjusted).
 The second graph shows the year-over-year change in retail sales and food service (ex-gasoline) since 1993.
Retail sales ex-gasoline increased by 4.1% on a YoY basis (3.2% for all retail sales).
This was slightly below the consensus forecast of no change for retail sales, however sales ex-autos were at forecast.
Monday, October 28, 2013
Tuesday: Retail Sales, Case-Shiller House Prices, PPI
by Calculated Risk on 10/28/2013 09:14:00 PM
From economist Shuyan Wu at Goldman Sachs: "How Much Noise in the October Employment Report?" A couple of excerpts:
Around 800,000 federal employees were furloughed on October 1. The Department of Defense (DoD) brought back roughly 350,000 by October 8, leaving about 450,000 federal employees still out of work during the reference week (Oct 6-12). The recalled DoD workers would be classified as employed; the non-DoD workers would be classified as unemployed on layoff since they did not work during the reference week but were expecting a recall. Assuming the October household sample was representative as usual, an additional 450,000 unemployed persons could add as much as 0.3 percentage points to the unemployment rate.Any impact on the unemployment rate and hiring would be reversed in the November report. We will have to wait until the December report (early January) for a report without shutdown distortions.
...
It is difficult to estimate the aggregate impact on private payrolls ...
Tuesday:
• At 8:30 AM ET, Retail sales for September. The consensus is for retail sales to be unchanged in September, and to increase 0.4% ex-autos.
• Also at 8:30 AM, the Producer Price Index for September. The consensus is for a 0.2% increase in producer prices (0.1% increase in core).
• At 9:00 AM, the S&P/Case-Shiller House Price Index for August. Although this is the August report, it is really a 3 month average of June, July and August. The consensus is for a 12.4% year-over-year increase in the Composite 20 index (NSA) for August.
• At 10:00 AM, Conference Board's consumer confidence index for October. The consensus is for the index to decrease to 75.0 from 79.7.
• Also at 10:00 AM, Manufacturing and Trade: Inventories and Sales (business inventories) report for August. The consensus is for a 0.3% increase in inventories.
Weekly Update: Housing Tracker Existing Home Inventory up 0.3% year-over-year on Oct 28th
by Calculated Risk on 10/28/2013 06:19:00 PM
Here is another weekly update on housing inventory ... for the second consecutive week, housing inventory is up slightly year-over-year.
There is a clear seasonal pattern for inventory, with the low point for inventory in late December or early January, and then peaking in mid-to-late summer.
The Realtor (NAR) data is monthly and released with a lag (the most recent data was for September). However Ben at Housing Tracker (Department of Numbers) has provided me some weekly inventory data for the last several years.
 Click on graph for larger image.
This graph shows the Housing Tracker reported weekly inventory for the 54 metro areas for 2010, 2011, 2012 and 2013.
In 2011 and 2012, inventory only increased slightly early in the year and then declined significantly through the end of each year.
Inventory in 2013 is increasing, and is now slightly above the same week in 2012 (red is 2013, blue is 2012).
We can be pretty confident that inventory bottomed early this year, and I expect the seasonal decline to be less than usual at the end of the year - so the year-over-year change will continue to increase.
Inventory is still very low, but this increase in inventory should slow house price increases.
Freddie Mac: Mortgage Serious Delinquency rate declined in September, Lowest since April 2009
by Calculated Risk on 10/28/2013 03:15:00 PM
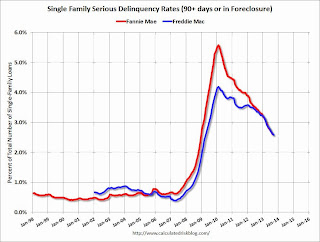
Freddie Mac reported that the Single-Family serious delinquency rate declined in September to 2.58% from 2.64% in August. Freddie's rate is down from 3.37% in September 2012, and this is the lowest level since April 2009. Freddie's serious delinquency rate peaked in February 2010 at 4.20%.
These are mortgage loans that are "three monthly payments or more past due or in foreclosure".
I'm frequently asked when the distressed sales will be back to normal levels, and that will happen when the percent of seriously delinquent loans (and in foreclosure) is closer to normal. Since very few seriously delinquent loans cure with the owner making up back payments - most of the reduction in the serious delinquency rate is from foreclosures, short sales, and modifications.
Note: Fannie Mae will report their Single-Family Serious Delinquency rate for September later this week.
 Click on graph for larger image
Although this indicates some progress, the "normal" serious delinquency rate is under 1%.
At the recent rate of improvement, the serious delinquency rate will not be under 1% until late 2015 or 2016. Therefore I expect an above normal level of distressed sales for 2 or 3 more years (mostly in judicial states).
Q2 2013: Mortgage Equity Withdrawal Strongly Negative
by Calculated Risk on 10/28/2013 01:31:00 PM
Note: This is not Mortgage Equity Withdrawal (MEW) data from the Fed. The last MEW data from Fed economist Dr. Kennedy was for Q4 2008.
The following data is calculated from the Fed's Flow of Funds data and the BEA supplement data on single family structure investment. This is an aggregate number, and is a combination of homeowners extracting equity - hence the name "MEW", but there is little MEW right now - and normal principal payments and debt cancellation.
For Q2 2013, the Net Equity Extraction was minus $75 billion, or a negative 2.4% of Disposable Personal Income (DPI).
 Click on graph for larger image in new window.
This graph shows the net equity extraction, or mortgage equity withdrawal (MEW), results, using the Flow of Funds (and BEA data) compared to the Kennedy-Greenspan method.
There are smaller seasonal swings right now, perhaps because there is a little actual MEW (this is heavily impacted by debt cancellation right now).
The Fed's Flow of Funds report showed that the amount of mortgage debt outstanding declined further in Q2. Mortgage debt has declined by over $1.3 trillion since the peak. This decline is mostly because of debt cancellation per foreclosures and short sales, and some from modifications. There has also been some reduction in mortgage debt as homeowners paid down their mortgages so they could refinance. With residential investment increasing, and a slower rate of debt cancellation, it is possible that MEW will turn positive again in the next year or two.
For reference:
Dr. James Kennedy also has a simple method for calculating equity extraction: "A Simple Method for Estimating Gross Equity Extracted from Housing Wealth". Here is a companion spread sheet (the above uses my simple method).
For those interested in the last Kennedy data included in the graph, the spreadsheet from the Fed is available here.
Dallas Fed: Texas Manufacturing Activity Strengthens in October
by Calculated Risk on 10/28/2013 10:30:00 AM
From the Dallas Fed: Texas Manufacturing Activity Strengthens
Texas factory activity picked up further in October, according to business executives responding to the Texas Manufacturing Outlook Survey. The production index, a key measure of state manufacturing conditions, rose from 11.5 to 13.3, suggesting output increased at a slightly faster pace than in September.Here is a graph comparing the regional Fed surveys and the ISM manufacturing index:
Other measures of current manufacturing activity also indicated a slightly stronger expansion in October. The new orders index came in at 6.2, slightly above its September level, and marked a sixth consecutive month of increased demand. ...
The general business activity index remained positive but fell to 3.6 after rising sharply to 12.8 in September. The company outlook index posted a fifth consecutive positive reading but moved down to 5.4.
Labor market indicators reflected continued employment growth and longer workweeks. The October employment index was 9.6, largely unchanged from its September level.
emphasis added
 Click on graph for larger image.
The New York and Philly Fed surveys are averaged together (dashed green, through October), and five Fed surveys are averaged (blue, through October) including New York, Philly, Richmond, Dallas and Kansas City. The Institute for Supply Management (ISM) PMI (red) is through September (right axis).
All of the regional surveys showed expansion in October, but at a somewhat slower pace overall than in September. The ISM index for October will be released Friday, November 1st and the consensus is for a decrease to 55.0 from 56.2 in September.
Pending Home Sales Index declines 5.6% in September
by Calculated Risk on 10/28/2013 10:00:00 AM
From the NAR: Pending Home Sales Continue Slide in September
The Pending Home Sales Index, a forward-looking indicator based on contract signings, fell 5.6 percent to 101.6 in September from a downwardly revised 107.6 in August, and is 1.2 percent below September 2012 when it was 102.8. The index is at the lowest level since December 2012 when it was 101.3; the data reflect contracts but not closings.Contract signings usually lead sales by about 45 to 60 days, so this would usually be for closed sales in October and November.
...
[Lawrence Yun, NAR chief economist] notes this is the first time in 29 months that pending home sales weren’t above year-ago levels. “This tells us to expect lower home sales for the fourth quarter, with a flat trend going into 2014. Even so, ongoing inventory shortages will continue to lift home prices, though at a slower single-digit growth rate next year.”
The PHSI in the Northeast dropped 9.6 percent to 76.7 in September, and is 6.4 percent below a year ago. In the Midwest the index fell 8.3 percent to 102.3 in September, but is 5.7 percent higher than September 2012. Pending home sales in the South slipped 0.4 percent to an index of 116.2 in September, but are 2.0 percent above a year ago. The index in the West dropped 9.0 percent in September to 97.3, and is 9.8 percent lower than September 2012.
emphasis added
Fed: Industrial Production increased 0.6% in September
by Calculated Risk on 10/28/2013 09:15:00 AM
From the Fed: Industrial production and Capacity Utilization
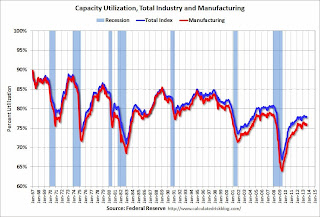
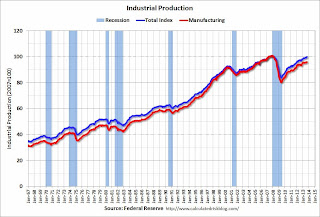
Industrial production increased 0.6 percent in September following a gain of 0.4 percent in August. For the third quarter as a whole, industrial production rose at an annual rate of 2.3 percent. Manufacturing output edged up 0.1 percent in September following a gain of 0.5 percent in August, and increased at an annual rate of 1.2 percent for the third quarter. Production at mines moved up 0.2 percent in September and advanced at an annual rate of 12.9 percent for the third quarter. The output of utilities rose 4.4 percent in September following declines in each of the previous five months. The level of the index for total industrial production in September was equal to its 2007 average and was 3.2 percent above its year-earlier level. Capacity utilization for total industry moved up 0.4 percentage point to 78.3 percent, a rate 1.9 percentage points below its long-run (1972-2012) average
emphasis added
 Click on graph for larger image.
This graph shows Capacity Utilization. This series is up 11.0 percentage points from the record low set in June 2009 (the series starts in 1967).
Capacity utilization at 78.3% is still 1.9 percentage points below its average from 1972 to 2010 and below the pre-recession level of 80.8% in December 2007.
Note: y-axis doesn't start at zero to better show the change.
 The second graph shows industrial production since 1967.
Industrial production increased 0.6% in September to 100.0. This is 19.4% above the recession low, but still 0.8% below the pre-recession peak.
The monthly change for both Industrial Production and Capacity Utilization were above expectations. The consensus was for a 0.4% increase in Industrial Production in September, and for Capacity Utilization to increase to 78.0%.
Sunday, October 27, 2013
Monday: Industrial Production, Pending Home Sales
by Calculated Risk on 10/27/2013 09:33:00 PM
A quick note: I started the year looking for around 2% GDP growth in 2013, with growth limited by significant fiscal tightening, and I thought the key downside risk was Congress. That looks about right (Congress was unfortunately worse than I expected).
Now I'm starting to look ahead to 2014, and there a few positive signs. Congress is still a downside risk, but I expect some sort of "small ball" budget agreement in December that will minimize the sequester spending cuts in 2014. Also I doubt there will be another government shutdown or debt ceiling showdown since it is an election year (many Congressmen are hoping Americans will forget what just happened).
The economy probably slowed in October - thanks to the House of Representatives - but I expect the economic numbers will start to improve in November or December, and that economic growth will pickup in 2014. I'll write more about this soon.
Monday:
• At 9:15 AM ET, the Fed is scheduled to release Industrial Production and Capacity Utilization for September. The consensus is for a 0.4% increase in Industrial Production, and for Capacity Utilization to increase to 78.0%.
• At 10:00 AM, the NAR will release Pending Home Sales Index for September. The consensus is for a no change in the index.
• At 10:30 AM, the Dallas Fed Manufacturing Survey for October will be released. This is the last of the regional Fed surveys. The consensus is a reading of 9.0, up from 12.8 in September (above zero is expansion).
Weekend:
• Schedule for Week of October 27th
From CNBC: Pre-Market Data and Bloomberg futures: the S&P futures are up 5 and DOW futures are up 45 (fair value).
Oil prices are down with WTI futures at $97.58 per barrel and Brent at $106.94 per barrel.
Below is a graph from Gasbuddy.com for nationwide gasoline prices. Nationally prices are around $3.30 per gallon. If you click on "show crude oil prices", the graph displays oil prices for WTI, not Brent; gasoline prices in most of the U.S. are impacted more by Brent prices.
| Orange County Historical Gas Price Charts Provided by GasBuddy.com |
DataQuick: Q3 California Foreclosure Starts Decline, Down 58.6% from Q3 2012
by Calculated Risk on 10/27/2013 10:14:00 AM
From DataQuick: California Foreclosure Starts Second-Lowest Since Early 2006
The number of California homeowners entering the foreclosure process fell last quarter to the second-lowest level in seven and a half years. The drop-off is the result of a stronger job market, home price appreciation, and a variety of government foreclosure avoidance efforts, a real estate information service reported.
Lenders filed 20,314 Notices of Default (NoDs) during the July-through-September period. That was down 21.1 percent from 25,747 during the previous quarter, and down 58.6 percent from 49,026 in third-quarter 2012, according to San Diego-based DataQuick.
Last quarter's NoDs were the lowest since 18,568 were filed in the first quarter of this year, and the second-lowest since 18,856 were filed in first-quarter 2006.
"Cleanup of the foreclosure mess is ongoing, but it's difficult to imagine a huge new wave. We still get asked about the long-feared 'shadow inventory' of distressed properties that some people predicted would trigger another big surge in foreclosures. Such warnings, which go back years, often reflected a worst-case scenario and didn't account for the breadth and depth of the government's eventual intervention in the crisis. Lots of legal, regulatory and political hurdles popped up, slowing the foreclosure rate. Then the economy stabilized and home prices started rising," said John Walsh, DataQuick president.
"Still, it's certainly possible that we could see foreclosure activity edge higher again," he added. "It will depend on the economy and how lenders manage their remaining distressed properties, and their success with mortgage modifications."
 Click on graph for larger image.
This graph shows the number of Notices of Default (NoD) filed in California each year. For 2013 (red), the bar is an estimated annual rate (since the California "Homeowner Bill of Rights" slowed foreclosure activity early this year, the estimated rate is Q1+Q2 + 2 times Q3).
It looks like this will be the lowest year for foreclosure starts since 2005, and also below the levels in 1997 through 1999 when prices were rising following the much smaller housing bubble / bust in California.
Some of the decline in foreclosure starts is related to the "Homeowner Bill of Rights" that slowed foreclosures, some to higher house prices and a better economy - but overall foreclosure starts are close to a normal level (foreclosure starts were over 50,000 in 2004 and 2005 when prices were rising quickly).
Note: Foreclosures are still higher than normal in states with a judicial foreclosure process.


