by Calculated Risk on 6/05/2013 10:00:00 AM
Wednesday, June 05, 2013
ISM Non-Manufacturing Index indicates slightly faster expansion in May
The May ISM Non-manufacturing index was at 53.7%, up from 53.1% in April. The employment index decreased in May to 50.1%, down from 52.0% in April. Note: Above 50 indicates expansion, below 50 contraction.
From the Institute for Supply Management: May 2013 Non-Manufacturing ISM Report On Business®
Economic activity in the non-manufacturing sector grew in May for the 41st consecutive month, say the nation's purchasing and supply executives in the latest Non-Manufacturing ISM Report On Business®.
The report was issued today by Anthony Nieves, C.P.M., CFPM, chair of the Institute for Supply Management™ Non-Manufacturing Business Survey Committee. "The NMI™ registered 53.7 percent in May, 0.6 percentage point higher than the 53.1 percent registered in April. This indicates continued growth at a slightly faster rate in the non-manufacturing sector. The Non-Manufacturing Business Activity Index registered 56.5 percent, which is 1.5 percentage points higher than the 55 percent reported in April, reflecting growth for the 46th consecutive month. The New Orders Index increased by 1.5 percentage points to 56 percent, and the Employment Index decreased 1.9 percentage points to 50.1 percent, indicating growth in employment for the 10th consecutive month. The Prices Index decreased 0.1 percentage point to 51.1 percent, indicating prices increased at a slower rate in May when compared to April. According to the NMI™, 13 non-manufacturing industries reported growth in May. The majority of respondents' comments are optimistic about business conditions. However, there is a degree of uncertainty about the long-term outlook."
emphasis added
 Click on graph for larger image.
This graph shows the ISM non-manufacturing index (started in January 2008) and the ISM non-manufacturing employment diffusion index.
This was at the consensus forecast of 53.8% and indicates slightly faster expansion in May than in April.
ADP: Private Employment increased 135,000 in May
by Calculated Risk on 6/05/2013 08:15:00 AM
Private sector employment increased by 135,000 jobs from April to May, according to the May ADP National Employment Report®, which is produced by ADP® ... in collaboration with Moody’s Analytics. The report, which is derived from ADP’s actual payroll data, measures the change in total nonfarm private employment each month on a seasonally-adjusted basis. April’s job gains were revised downward to 113,000 from 119,000.This was below the consensus forecast for 171,000 private sector jobs added in the ADP report. Note: The BLS reports on Friday, and the consensus is for an increase of 167,000 payroll jobs in May, on a seasonally adjusted (SA) basis.
...
Mark Zandi, chief economist of Moody’s Analytics, said, "The job market continues to expand, but growth has slowed since the beginning of the year. The slowdown is evident across all industries and all but the largest companies. Manufacturers are reducing payrolls. The softer job market this spring is largely due to significant fiscal drag from tax increases and government spending cuts."
Note: ADP hasn't been very useful in predicting the BLS report.
MBA: Mortgage Refinance Applications decline sharply as Mortgage Rates Increase above 4%
by Calculated Risk on 6/05/2013 07:43:00 AM
From the MBA: Mortgage Applications Decrease as Rates Jump in Latest MBA Weekly Survey
The Refinance Index decreased 15 percent from the previous week and is at its lowest level since the end of November 2011. The seasonally adjusted Purchase Index decreased 2 percent from one week earlier.
...
The average contract interest rate for 30-year fixed-rate mortgages with conforming loan balances ($417,500 or less) increased to 4.07 percent, the highest rate since April 2012, from 3.90 percent, with points decreasing to 0.35 from 0.39 (including the origination fee) for 80 percent loan-to-value ratio (LTV) loans. This was the largest single-week increase in this rate since the week ending July 1, 2011.
emphasis added
 Click on graph for larger image.
The first graph shows the refinance index.
With 30 year mortgage rates moving above 4%, refinance activity has fallen sharply.
This index is down almost 40% over the last four weeks, and this is the lowest level since November 2011.
 The second graph shows the MBA mortgage purchase index. The 4-week average of the purchase index has generally been trending up over the last year, and the 4-week average of the purchase index is up about 10% from a year ago.
Tuesday, June 04, 2013
Wednesday: ADP Employment, ISM Service Index, Fed's Beige Book
by Calculated Risk on 6/04/2013 07:25:00 PM
The earliest report tomorrow - the weekly mortgage survey from the Mortgage Bankers Association - is expected to show 30 year mortgage rates at or above 4%. Neil Irwin at the WaPo asks: Will higher mortgage rates kill the housing market? Maybe not!
[R]ising mortgage rates, if they’re rising for good reasons, could actually be net positives for the housing market if they result from more people having jobs and being confident in their prospects.I'm not a fan of "affordability" indexes, but I don't think an increase in mortgage rates will hurt the recovery for residential investment (mostly new home sales). However an increase in rates will sharply reduce refinance activity - something we are already seeing.
This gets at one of the realities of the housing market and interest rates: It doesn’t just matter whether mortgage rates are rising, but why they’re rising.
Stronger economic growth makes homebuying more attractive, as people are more confident in their jobs and incomes (Goldman estimates that a 1 percentage point in real GDP growth translates to 1.8 percentage points in annual home price appreciation). Higher inflation can make homebuying more desirable, as you are buying a large asset whose value should rise with inflation while taking on a debt that has a fixed interest rate (Goldman estimates that a 1 percentage point increase in inflation translates to an 0.9 percent rise in home prices).
That being the case, as long as home prices remain below the level where affordability is out of reach, and so long as mortgage rates are rising because the economy is on the mend, the housing market should be able to withstand the blow.
Wednesday economic releases:
• At 7:00 AM ET, The Mortgage Bankers Association (MBA) will release the results for the mortgage purchase applications index. Expect 30 year mortgage rates at or above 4%, and another sharp decline in refinance activity.
• At 8:15 AM, the ADP Employment Report for May will be released. This report is for private payrolls only (no government). The consensus is for 171,000 payroll jobs added in May.
• At 10:00 AM, the ISM non-Manufacturing Index for May. The consensus is for a reading of 53.8, up from 53.1 in April. Note: Above 50 indicates expansion, below 50 contraction.
• Also at 10:00 AM, the Manufacturers' Shipments, Inventories and Orders (Factory Orders) for April. The consensus is for a 1.4% increase in orders.
• At 2:00 PM, the Federal Reserve Beige Book will be released. This is an informal review by the Federal Reserve Banks of current economic conditions in their Districts. In the previous Beige Book, in early April, the report noted "economic activity expanded at a moderate pace".
Lawler: Single Family Homes Built/Sold in 2012: “Back to Bigger,” But on Very Low Volumes
by Calculated Risk on 6/04/2013 02:48:00 PM
Census released its estimates for the characteristics of single-family homes completed and sold in 2012.
CR Note: from the release:
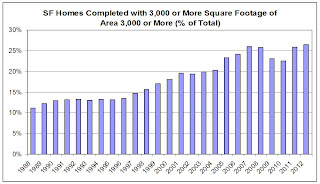
Of the 483,000 single-family homes completed in 2012:From Lawler: Here is a chart showing the % of SF homes completed with square feet of floor area of 3,000 or more.
• 432,000 had air-conditioning.
• 63,000 had two or fewer bedrooms and 198,000 had four bedrooms or more.
• 34,000 had one and one-half bathrooms or less, whereas 145,000 homes had three or more bathrooms.
• 142,000 had a full or partial basement, while 78,000 had a crawl space, and 263,000 had a slab or other type of foundation.
• 266,000 had two or more stories.
• 278,000 had a warm-air furnace and 183,000 had a heat pump as the primary heating system.
• 285,000 heating systems were powered by gas and 189,000 were powered by electricity.
The average single-family house completed was 2,505 square feet.

Click on graph for larger image.
There has been a long-term upward trend in the average and median square footage of SF homes built in the US, though “size” has had a bit of a cyclical component as well – generally rising more rapidly during strong markets, and more slowly during “soft” markets. The “dip” in 2009-10 may also have reflected a temporary increase in building targeted at first-time home buyers related to the home buyer tax credits, while the recent rebound reflects the post-tax-credit weakness in first-time home buyer demand.
Of course, the recent increase in the share of “large” SF homes built has been on very low overall volumes.

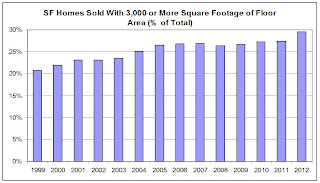
Census also released estimates of the characteristics of new SF homes sold (total SF completions include not just homes built for sale, but also owner- and contractor-built homes, as well as a small number of SF homes built for rent. These characteristics reflect SF homes sold based on contract signing/earnest money exchange, and not completions, and the square footage data only go back to 1999.

Here is a chart showing the % of new SF homes sold that had four or more bedrooms, with data going back to 1978.

And here is a chart showing the number of new SF homes sold with four or more bedrooms.

Existing Home Inventory is up 15.2% year-to-date on June 4th
by Calculated Risk on 6/04/2013 12:21:00 PM
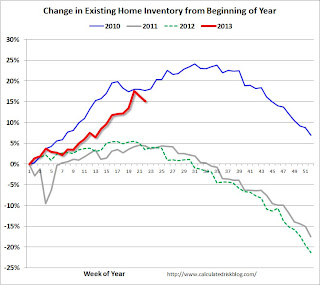
Weekly Update: One of key questions for 2013 is Will Housing inventory bottom this year?. Since this is a very important question, I'm tracking inventory weekly in 2013.
There is a clear seasonal pattern for inventory, with the low point for inventory in late December or early January, and then peaking in mid-to-late summer.
The Realtor (NAR) data is monthly and released with a lag (the most recent data was for April). However Ben at Housing Tracker (Department of Numbers) has provided me some weekly inventory data for the last several years. This is displayed on the graph below as a percentage change from the first week of the year (to normalize the data).
In 2010 (blue), inventory increased more than the normal seasonal pattern, and finished the year up 7%. However in 2011 and 2012, there was only a small increase in inventory early in the year, followed by a sharp decline for the rest of the year.
 Click on graph for larger image.
Note: the data is a little weird for early 2011 (spikes down briefly).
So far in 2013, inventory is up 15.2%. This is well above the peak percentage increases for 2011 and 2012 and suggests to me that inventory is near the bottom. It now seems likely - at least by this measure - that inventory bottomed early this year (it could still happen early next year).
It is important to remember that inventory is still very low, and is down 15.3% from the same week last year according to Housing Tracker. Once inventory starts to increase (more than seasonal), I expect price increases to slow.
CoreLogic: House Prices up 12.1% Year-over-year in April
by Calculated Risk on 6/04/2013 09:46:00 AM
Notes: This CoreLogic House Price Index report is for April. The recent Case-Shiller index release was for March. The CoreLogic HPI is a three month weighted average and is not seasonally adjusted (NSA).
From CoreLogic: CoreLogic Report Shows Home Prices Rise by 12.1 Percent Year Over Year in April
Home prices nationwide, including distressed sales, increased 12.1 percent on a year-over-year basis in April 2013 compared to April 2012. This change represents the biggest year-over-year increase since February 2006 and the 14th consecutive monthly increase in home prices nationally. On a month-over-month basis, including distressed sales, home prices increased by 3.2 percent in April 2013 compared to March 2013.
Excluding distressed sales, home prices increased on a year-over-year basis by 11.9 percent in April 2013 compared to April 2012. On a month-over-month basis, excluding distressed sales, home prices increased 3 percent in April 2013 compared to March 2013. Distressed sales include short sales and real estate owned (REO) transactions.
The CoreLogic Pending HPI indicates that May 2013 home prices, including distressed sales, are expected to rise by 12.5 percent on a year-over-year basis from May 2012 and rise by 2.7 percent on a month-over-month basis from April 2013. Excluding distressed sales, May 2013 home prices are poised to rise 13.2 percent year over year from May 2012 and by 3.1 percent month over month from April 2013.
...
“House price growth continues to surprise to the upside with an impressive 12.1 percent gain year over year in April,” said Dr. Mark Fleming, chief economist for CoreLogic. “Increasing demand for new and existing homes, coupled with low inventory, has created a virtuous cycle for price gains, most clearly seen in the Western states with year-over-year gains of 20 percent or more.”
 Click on graph for larger image.
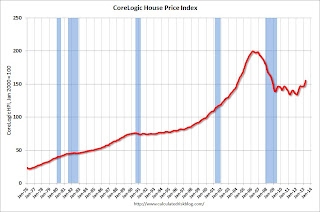
 This graph shows the national CoreLogic HPI data since 1976. January 2000 = 100.
The index was up 3.2% in April, and is up 12.1% over the last year. This index is not seasonally adjusted, and this is usually the strongest time of the year for price increases.
The index is off 22% from the peak - and is up 15.9% from the post-bubble low set in February 2012.
 The second graph is from CoreLogic. The year-over-year comparison has been positive for fourteen consecutive months suggesting house prices bottomed early in 2012 on a national basis (the bump in 2010 was related to the tax credit).
This is the largest year-over-year increase since 2006.
This was another very strong month-to-month increase. At some point more inventory will come on the market and slow the price increases. Note: CoreLogic notes that prices are up year-over-year in all 50 states excluding distressed sales.
Trade Deficit increased in April to $40.3 Billion
by Calculated Risk on 6/04/2013 08:46:00 AM
The Department of Commerce reported:
[T]otal April exports of $187.4 billion and imports of $227.7 billion resulted in a goods and services deficit of $40.3 billion, up from $37.1 billion in March, revised. April exports were $2.2 billion more than March exports of $185.2 billion. April imports were $5.4 billion more than March imports of $222.3 billion..The trade deficit was lower than the consensus forecast of $41.2 billion.
The first graph shows the monthly U.S. exports and imports in dollars through April 2013.
 Click on graph for larger image.
Both exports and imports increased in April. Imports rebounded from the decline in March that was partially due to the timing of the Chinese New Year.
Exports are 13% above the pre-recession peak and up 2% compared to April 2012; imports are 2% below the pre-recession peak, and down 1% compared to April 2012 (mostly moving sideways).
The second graph shows the U.S. trade deficit, with and without petroleum, through April.
 The blue line is the total deficit, and the black line is the petroleum deficit, and the red line is the trade deficit ex-petroleum products. Most of the recent improvement in the trade deficit is related to petroleum.
Oil averaged $97.82 in April, up from $96.95 per barrel in March, but down from $109.69 in April 2012. Oil import prices should decline in May.
The trade deficit with the euro area was $10.0 billion in April, up from $7.8 billion in April 2012.
The trade deficit with China decreased to $24.1 billion in April, down from $24.5 billion in April 2012. Most of the trade deficit is related to China.
Monday, June 03, 2013
Tuesday: Trade Deficit
by Calculated Risk on 6/03/2013 10:06:00 PM
An interesting article on investor buying from Nathaniel Popper at the NY Times Dealbook: Behind the Rise in House Prices, Wall Street Buyers
Large investment firms have spent billions of dollars over the last year buying homes in some of the nation’s most depressed markets. The influx has been so great, and the resulting price gains so big, that ordinary buyers are feeling squeezed out. Some are already wondering if prices will slump anew if the big money stops flowing.Investor buying has played a key role, but I don't expect investors to start selling in bulk (although the buying will probably slow down). Most of these large investors are planning on holding the properties for some time, but you never know ...
...
Blackstone ... has bought some 26,000 homes in nine states. Colony Capital, a Los Angeles-based investment firm, is spending $250 million each month and already owns 10,000 properties. ... Most of the firms are renting out the homes, with the possibility of unloading them at a profit when prices rise far enough.
While these investors have not touched many healthy real estate markets, they are among the biggest buyers in struggling areas of the country where housing prices have been increasing the fastest. Those gains, in turn, have been at the leading edge of rising home prices nationwide.
Tuesday economic releases:
• At 8:30 AM ET, Trade Balance report for April from the Census Bureau. The consensus is for the U.S. trade deficit to increase to $41.2 billion in April from $38.8 billion in March.
Fannie Mae, Freddie Mac: Mortgage Serious Delinquency rates declined in April, Lowest since early 2009
by Calculated Risk on 6/03/2013 06:11:00 PM
Fannie Mae reported that the Single-Family Serious Delinquency rate declined in April to 2.93% from 3.02% in March. The serious delinquency rate is down from 3.63% in April 2012, and this is the lowest level since January 2009.
The Fannie Mae serious delinquency rate peaked in February 2010 at 5.59%.
Freddie Mac reported that the Single-Family serious delinquency rate declined in April to 2.91% from 3.03% in March. Freddie's rate is down from 3.51% in April 2012, and this is the lowest level since June 2009. Freddie's serious delinquency rate peaked in February 2010 at 4.20%.
Note: These are mortgage loans that are "three monthly payments or more past due or in foreclosure".
 Click on graph for larger image
Although this indicates some progress, the "normal" serious delinquency rate is under 1%.
At the recent rate of improvement, the serious delinquency rate will not be under 1% until late 2016 or 2017.


