by Calculated Risk on 2/21/2012 08:24:00 PM
Tuesday, February 21, 2012
Home Depot on Housing
There were some interesting comments from the Home Depot CEO today (transcript with via Seeking Alpha). Home Dept CEO Francis Blake talked about the favorable weather, but he thought there was more:
There are some interesting challenges in setting expectations for 2012. First, the macro data on housing suggest uncertainty. ... The Fed has noted that housing remains a drag on economic recovery with factors such as delayed household formation and credit supply, contributing to a continued imbalance between housing supply and demand. The Fed has suggested the policy actions will be needed to fix this, but it wouldn't appear that any major policy changes are likely in the near-term.And in the Q&A:
Second, despite this, the performance of our business particularly in the back half of 2011, would suggest the strengthening market. This quarter's comps were achieved against a very strong fourth quarter comp in 2010 and exceeded our internal forecast. But we're mindful that this past December and January were the fourth warmest on record, with much of the nice weather occurring across the heavily populated eastern U.S. Better weather translates into improved sales for exterior categories like building materials and also translates into increased customer transactions, which lift the entire business.
Dennis McGill, Zelman & Associates: Just a question focused on some of the regions, you mentioned California being at the company average and Florida being above and 2 areas that we wouldn't normally attribute to being volatile from the weather standpoint. So just wondering if you could elaborate there, particularly in California, where it seemed like weather was pretty steady year-over-year, especially with some of the housing metrics improving in those markets?In other comments, Blake mentioned that we've seen a little improvement before, but those were policy related (like the housing tax credit).
CEO Blake: Dennis, I think that's exactly the point. I mean, wanted to call out California and Florida because they really aren't weather-related. And so that's an indication that there was more than just weather ... And I think just exactly as you said, that those markets are more reflective of not a housing recovery, but a stabilization in the markets that we've seen over the last 2 years, as they've just -- they've gotten kind off there, off the floor in effect on housing.
CEO Blake: [W]e are now not -- we have no government programs to cloud what's happening. ... And the way we look at it is, there are some positives that you definitely see on housing.He mentioned some negatives too, but it seems like they are seeing some improvement.
LPS: Number of delinquent mortgage loans declined in January, In foreclosure increases slightly
by Calculated Risk on 2/21/2012 04:02:00 PM
LPS released their First Look report for January today. LPS reported that the percent (and number) of loans delinquent declined in January from December, but that the percent (and number) of loans in the foreclosure process increased slightly.
The following table shows the LPS numbers for January 2012, and also for last month (Dec 2011) and one year ago (Jan 2011).
| LPS: Loans Delinquent and in Foreclosure | |||
|---|---|---|---|
| Jan-12 | Dec-11 | Jan-11 | |
| Delinquent | 7.97% | 8.15% | 8.90% |
| In Foreclosure | 4.15% | 4.11% | 4.16% |
| Less than 90 days | 2,226,000 | 2,309,000 | 2,551,000 |
| More than 90 days | 1,772,000 | 1,792,000 | 2,168,000 |
| In foreclosure | 2,084,000 | 2,066,000 | 2,203,000 |
| Total | 6,082,000 | 6,167,000 | 6,922,000 |
At the current rate of decline, the number of delinquent lonas will be back to "normal" in about three years (around 4.5% to 5% of loans are delinquent even in good times). However the number of loans in the foreclosure process hasn't change year-over-year - although that will probably change soon with the mortgage servicer settlement (around 0.5% of loans in foreclosure is "normal").
DOT: Vehicle Miles Driven increased 1.3% in December
by Calculated Risk on 2/21/2012 11:57:00 AM
Note: Vehicle miles have moved sideways for over four years. And gasoline consumption has declined slightly over the same period. For a discussion of the causes, see NDD's post at the Bonddad blog this morning: Why the decline in gasoline demand doesn't mean a recession -- yet. Among other points, NDD writes: "It appears that gasoline conservation is a top priority of consumers." and he provides a list (with data): Ridership of mass transit is up, online retail purchases have increased, automakers are selling more fuel efficient cars, teen driving is down, and more.
The Department of Transportation (DOT) reported:
• Travel on all roads and streets changed by +1.3% (3.2 billion vehicle miles) for December 2011 as compared with December 2010.The following graph shows the rolling 12 month total vehicle miles driven.
• Cumulative Travel for 2011 changed by -1.2% (-35.7 billion vehicle miles).
Even with a small year-over-year increase in December, the rolling 12 month total is mostly moving sideways.
 Click on graph for larger image.
In the early '80s, miles driven (rolling 12 months) stayed below the previous peak for 39 months.
Currently miles driven has been below the previous peak for 49 months - and still counting!
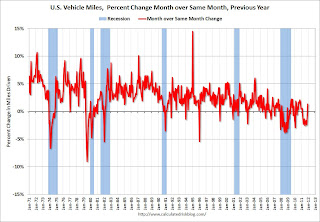
The second graph shows the year-over-year change from the same month in the previous year.
 This is the first year-over-year increase in miles driven since February 2011.
With the recent increases in gasoline prices, we might see year-over-year declines again in January or February. But this doesn't mean a recession - instead, as NDD notes, it appears that behavior is changing, and also that the fleet is becoming more efficient ... and, of course, growth is still sluggish and holding back driving too.
Lawler: Number of Seriously-Delinquent FHA-Insured SF Loans Jumped Again in January
by Calculated Risk on 2/21/2012 10:03:00 AM
From economist Tom Lawler: Number of Seriously-Delinquent FHA-Insured SF Loans Jumped Again in January; HUD Secretary “Fiddles” as FHA Burns
Data from the FHA’s Neighborhood Watch Early Warning System indicate that the number of FHA-insured loans that were seriously delinquent jumped again in January. According to report on the EWS for servicers who combined have an “active” FHA servicing portfolio of over 7.33 million loans, 732,775 of these loans were seriously delinquent at the end of January. While this report does not exactly match the SDQ numbers reported in various monthly FHA reports (which have not yet been released in January, it tracks the “official” numbers pretty closely. These data, combined with other data from the EWS (not shown here), suggest that the performance of the FHA’s pre-2010 book has continued to deteriorate significantly.
Based on this report, I estimate that the serious delinquency rate on FHA’s SF book in January (as measured by the FHA Monthly Outlook and/or FHA Monthly Report to the FHA commissioner) jumped to around 9.9% last month, up from 9.59% in December, 8.18% last June, and 8.89% last January.
As I noted last week, the pace of FHA loan modifications slowed dramatically in the latter part of last year, while the pace of property “conveyances” was shockingly low given the large number of seriously delinquent/in-foreclosure loans. Obviously, the slow pace of problem-loan “resolutions” has been at least partly behind the sharp increase in the number of seriously-delinquent FHA loans.
Many find it moderately disturbing that HUD Secretary Donovan has of late been working mainly on the big “mortgage settlement” -- and even worked to have part of the mortgage settlement money go to FHA – and has been “jawboning” Fannie and Freddie to “embrace” principal write-downs, while at the same time FHA’s problem-loan resolution activity plunged and the number of seriously delinquent FHA loans has surged. However, headlines such as “Donovan Fiddles as FHA Burns” seem a bit strong – but I used it anyway!
Chicago Fed: Economic Growth in January above Average
by Calculated Risk on 2/21/2012 08:30:00 AM
The Chicago Fed released the national activity index (a composite index of other indicators): Index shows economic growth in January again above average
The Chicago Fed National Activity Index decreased to +0.22 in January from +0.54 in December, but remained positive for the second straight month for the first time in a year. ...This graph shows the Chicago Fed National Activity Index (three month moving average) since 1967.
The index’s three-month moving average, CFNAI-MA3, increased from +0.06 in December to +0.14 in January, reaching its highest level since March 2011. January’s CFNAI-MA3 suggests that growth in national economic activity was slightly above its historical trend. The economic growth reflected in this level of the CFNAI-MA3 suggests limited inflationary pressure from economic activity over the coming year.
 Click on graph for larger image.
This suggests growth slightly above trend in January - but still not strong growth.
According to the Chicago Fed:
A zero value for the index indicates that the national economy is expanding at its historical trend rate of growth; negative values indicate below-average growth; and positive values indicate above-average growth.
Monday, February 20, 2012
Report: Greek Debt Deal Reached
by Calculated Risk on 2/20/2012 10:01:00 PM
Reuters (via Peter Spiegel) Euro zone finance ministers strike deal on second Greek package. Financing of 130 bln euros, debt-to-GDP of 121 pct by 2020
Update: From Reuters: Euro zone strikes deal on second Greek bailout package
Euro zone finance ministers struck a deal ... that includes new financing of 130 billion euros and aims to cut Greece's debt to 121 percent of GDP by 2020, two EU officials said.Press conference soon
"The financial volume (of the Greek package) is 130 billion euros and debt-to-GDP (will be) 121 percent. Now it's down to work on the statement," one official involved in the negotiations told Reuters.
...
Private sector holders of Greek debt are expected to take losses of up to 53.5 percent on the nominal value of their bonds as part of a debt exchange that will reduce Greece's debts by around 100 billion euros.
EU Press Releases (no statement yet)
Lawler: Update on Expectations for Existing Home Sales Report
by Calculated Risk on 2/20/2012 08:16:00 PM
While we wait for news from Europe, here is an update from economist Tom Lawler:
Several of the home sales reports I’ve seen since early last Friday showed materially stronger YOY growth than I had expected, especially in a number of Midwest markets. As a result, I have upped my estimate for January existing home sales as measured by the National Association of Realtors. Right now my regional tracking suggests that the NAR will report that existing home sales ran at a seasonally adjusted annual rate of about 4.76 million, up about 3.3% from December’s pace, and up about 2.6% from last January’s pace. Note that January is seasonally the weakest month of the year in terms of closed home sales. (The weakest month for contracts signed from a seasonal perspective is December).
On the inventory front, it is pretty clear that existing home listings fell again nationally last month, though various “trackers” differ on how much. In addition, the NAR’s reported monthly inventory drop of 9.2 in December was significantly larger than listings data seemed to suggest. My “best guess” is that the NAR will report a monthly inventory drop of about 2.2%, which would be a YOY drop of 20.0%. While most realtor groups/associations reported a decline in active listings from December to January, there were several that reported increases.
CR Note: This sales rate, combined with a decline in inventory, could put months-of-supply under 6 months for the first time since early 2006. Some of the decline is seasonal (inventory is always low in January and months-of-supply uses NSA inventory numbers). The NAR is scheduled to report existing home sales on Wednesday.
Eurogroup - press conference at 5 PM ET
by Calculated Risk on 2/20/2012 04:17:00 PM
Update2: Live video of meeting room (empty are 5 PM ET). A Greek site is reporting the main meeting has concluded, but they are still working on the Private Sector haircuts.
Resources here (Update: delayed as usual ...)
Press conference soon
This webcast is scheduled to start on 20 February 2012 23:00 CETEU Press Releases (no statement yet)
STARTING TIME SUBJECT TO CHANGE.
Mortgage Delinquencies by Loan Type
by Calculated Risk on 2/20/2012 12:54:00 PM
By request, the following graphs show the percent of loans delinquent by loan type: Prime, Subprime, FHA and VA. First a table comparing the number of loans in 2007 and Q4 2011 so readers can understand the shift in loan types.
Both the number of prime and subprime loans have declined over the last four years; the number of subprime loans is down by about one-third. Meanwhile the number of FHA loans has increased sharply.
Note: There are about 49 million total first-lien loans - the MBA survey is about 88% of the total.
| MBA National Delinquency Survey Loan Count | ||||
|---|---|---|---|---|
| Q2 2007 | Q4 2011 | Change | Q4 2011 Seriously Delinquent | |
| Prime | 33,916,830 | 30,660,085 | -3,256,745 | 1,631,117 |
| Subprime | 6,204,535 | 4,178,732 | -2,025,803 | 1,017,521 |
| FHA | 3,030,214 | 6,611,396 | 3,581,182 | 596,348 |
| VA | 1,096,450 | 1,442,416 | 345,966 | 69,813 |
| Survey Total | 44,248,029 | 42,892,629 | -1,355,400 | 3,314,799 |
 Click on graph for larger image.
First a repeat: This graph shows the percent of loans delinquent by days past due. Loans 30 days delinquent increased to 3.22% from 3.19% in Q3. This is at about 2007 levels. Delinquent loans in the 60 day bucket decreased to 1.25% from 1.30% in Q4. This is the lowest level since Q4 2007.
There was a decrease in the 90+ day delinquent bucket too. This decreased to 3.11% from 3.50% in Q3 2011. This is the lowest level since 2008, but still way above normal (probably around 1% would be normal). The percent of loans in the foreclosure process declined slightly to 4.38% from 4.43%.
Note: Scale changes for each of the following graphs.
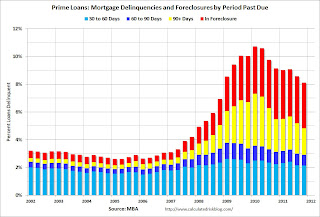
 The second graph is for all prime loans.
 This is the key category now ("We are all subprime!", Tanta).
Since there are far more prime loans than any other category (see table above), about half the loans seriously delinquent now are prime loans - even though the overall delinquency rate is lower than other loan types.
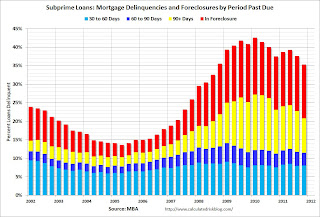
 This graph is for subprime. This category gets most of the attention - mostly because of all the terrible loans made through the Wall Street "originate-to-distribute" model and sold as Private Label Securities (PLS). Not all PLS was subprime, but the worst of the worst loans were packaged in PLS.
Although the delinquency rate is still very high, the number of subprime loans has declined sharply.
 This graph is for FHA loans. The delinquency rate increased in Q4. Most of the FHA loans were made in the last few years, not in the 2004 to 2006 period like subprime - but as those loans season, the delinquency rate is expected to increase.
The earlier improvement was a combination of the increase in number of loans (recent loans have lower delinquency rates) and eliminating Downpayment Assistance Programs (DAPs). These were programs that allowed the seller to give the buyer the downpayment through a 3rd party "charity" (for a fee of course). The buyer had no money in the house and the default rates were absolutely horrible.
 The last graph is for VA loans. This is a fairly small category (see table above).
There are still quite a few subprime loans that are in distress, but the real keys are prime loans and FHA loans.
Morning Greece: Eurozone finance ministers meet at 9 AM ET
by Calculated Risk on 2/20/2012 08:46:00 AM
From the Athens News: Venizelos: Bailout uncertainty to end
Finance Minister Evangelos Venizelos said on Monday technical issues on the country's new bailout package were still being discussed but that he expected the uncertainty to end at a meeting of eurozone finance ministers in Brussels.From the WSJ: Finance Ministers Look to Sign Off on Greek Deal
"We expect today the long period of uncertainty – which was in the interest of neither the Greek economy nor the euro zone as a whole – to end," Venizelos was quoted as saying in a finance ministry statement.
Finance ministers from the 17 euro-zone countries will meet in Brussels at 2 p.m. GMT on Monday, looking to sign off on a deal worth at least €130 billion ($170.9 billion) that will slash Greece's debt burden and allow it to stay in the euro zone, albeit under a degree of external control and scrutiny never witnessed in Europe in modern times.From the Financial Times: Eurozone crisis: live blog
Weekend:
• Summary for Week ending February 17th
• Schedule for Week of February 19th


