 RSS Feed
 by Calculated Risk on 8/30/2010 11:39:00 AM
Monday, August 30, 2010
Regional Fed Manufacturing Surveys and the ISM PMI
Now that all the regional Fed manufacturing surveys for August have been released, here is an update to the graph I posted last week: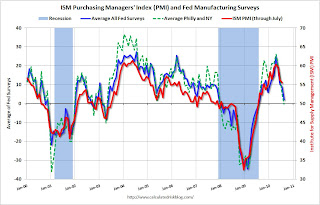 Click on graph for larger image in new window.
For this graph I averaged the New York and Philly Fed surveys (dashed green), and averaged five surveys including New York, Philly, Richmond, Dallas and Kansas City (blue).
The Institute for Supply Management (ISM) PMI (red) is through July (right axis).
ISM PMI for August will be released on Wednesday at 10 AM ET. The consensus is for a decline to 53.0 from 55.5 in July.
Based on the regional surveys, it appears that the PMI will decline in August - but will probably still be above 50 (indicating expansion in August).
Dallas Fed: Texas Manufacturing Activity Still Weak in August
by Calculated Risk on 8/30/2010 10:33:00 AM
From the Dallas Fed: Texas Manufacturing Activity Still Weak
Texas factory activity was unchanged in August, according to business executives responding to the Texas Manufacturing Outlook Survey. The production index, a key measure of state manufacturing conditions, came in at zero, posting a third consecutive month of little to no growth.This is the last of the regional Fed surveys for August, and they all showed manufacturing slowing or even contracting.
Most other indexes for current activity remained negative in August. The new orders index stayed at –9, implying incoming orders continue to fall. The capacity utilization and shipments indexes pushed deeper into negative territory, suggesting further contraction of business.
...
The employment index turned negative for the first time in six months, largely due to the share of firms reporting layoffs rising from 15 percent in July to 23 percent in August, and hours worked contracted again.
The national ISM manufacturing survey will be released on Wednesday.
Personal Income, Spending increase in July
by Calculated Risk on 8/30/2010 08:30:00 AM
From the BEA: Personal Income and Outlays, July 2010
Personal income increased $30.0 billion, or 0.2 percent ... Personal consumption expenditures (PCE) increased $44.1 billion, or 0.4 percent
...
Real PCE -- PCE adjusted to remove price changes -- increased 0.2 percent in July, compared with an increase of 0.1 percent in June.
...
Personal saving as a percentage of disposable personal income was 5.9 percent in July, compared with 6.2 percent in June.
 Click on graph for large image.
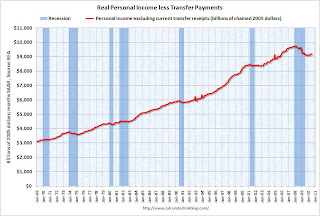
This graph shows real personal income less transfer payments since 1969.
This measure of economic activity is moving sideways - similar to what happened following the 2001 recession.
This month the saving rate decreased slightly ...
 This graph shows the saving rate starting in 1959 (using a three month trailing average for smoothing) through the July Personal Income report. The saving rate decreased to 5.9% in July from 6.2% in June (flat at 6.1% using a three month average).
 I expect the saving rate to rise further - perhaps to 8% or more.
The increase in income was good news, but personal income less transfer payments are still only 1.2% above the low of last year - and still 5.5% below the pre-recession peak.
Sunday, August 29, 2010
Another Housing Tax Credit?
by Calculated Risk on 8/29/2010 09:17:00 PM
From Reuters: No Decision on Reviving Homebuyer Credit: Donovan
"It's too early to say whether the tax credit will be revived," Donovan said in an interview on CNN's "State of the Union" program. He said the administration would "do everything we can" to stabilize the shaky U.S. housing market.The problem in housing is there is too much supply (at the current price). Incentivizing people to buy existing homes just shuffles households around - it does NOT reduce the overall supply unless the buyer is moving out of their parent's basement. I doubt that happened very often. Note: It is important to remember that rental units are part of the overall supply, so moving people from a rental unit to homeownership doesn't help.
And if the tax credit leads to more new home sales - that ADDS to the excess supply. And that makes the situation WORSE.
It would be far better for housing and the economy to announce "There will be no further housing tax credits."
Earlier today:
Foreclosures: Movin' on up!
by Calculated Risk on 8/29/2010 06:19:00 PM
This is a something we've been watching for some time ...
From Lauren Beale at the Los Angeles Times: Foreclosures of million-dollar-plus homes on the rise
Although the pace of foreclosures has slowed in the general housing market in Southern California and much of the nation, it's still rising for upper-tier homes.Earlier today:
The number of homes in the $1-million-and-up slice of the market that have become bank owned has tripled in the second quarter compared with the same period three years earlier in Los Angeles County, which has the majority of Southern California's high-priced REO houses. And the trend has shown little sign of slowing, according to data from ForeclosureRadar.
...
"We believe the high end is ready to fall apart," [Bryan Ochse of Media West Realty in Burbank, which works with 11 lending institutions and specializes in REO sales] said.
Schedule for Week of August 29th
by Calculated Risk on 8/29/2010 12:55:00 PM
This will be another busy week - the August employment report on Friday is the key economic release this week.
The previous post is the summary of last week.
8:30 AM ET: Personal Income and Outlays for July 2010. The consensus is for a 0.3% increase in both income and spending (compared to June). The core PCE Price Index is expected to increase 0.1%.
10:30 AM Dallas Fed Manufacturing Survey for August. The consensus is for a decrease in the index to flat (neither expanding or contracting) from 5 last month. These regional surveys are important now since it appears manufacturing is slowing (or contracting like the Philly Fed survey showed).
9:00 AM: S&P/Case Shiller Home Price Index for June (3 month average). The consensus is for prices to be mostly flat in the June report.
9:45 AM Chicago Purchasing Managers Index (PMI) for August. The consensus is for a decline to 56.0 from 62.3 in July.
10:00 AM Consumer confidence index from the Conference Board for August. The consensus is for a slight increase to 51.0 from 50.4.
2:00 PM: FOMC Minutes, Meeting of August 10, 2010
7:00 AM: The Mortgage Bankers Association (MBA) will release the mortgage purchase applications index. This index has been fairly flat over the last couple of months - suggesting reported existing home sales in August will not be much stronger than in July.
8:15 AM: ADP Employment Report for August. This report is for private payrolls only (no government). The consensus is for +20,000 payroll jobs in August, down from +42,000 in July.
10:00 AM: ISM Manufacturing Index for August. The regional Fed reports suggest a decline in the ISM manufacturing index. The consensus is for a decline to 53.0 from 55.5 in July.
10:00 AM: Construction Spending for July. The consensus is for a 0.6% decline in spending.
4:00 PM (approx): Light Vehicle Sales for August. The various manufacturers will report August sales in the morning. Usually around 4 PM I post an estimate of SAAR for the month. The consensus is for sales of 11.6 million, about the same as in July.
NOTE: There is a conference on Wednesday and Thursday in Washington, D.C. at the Federal Reserve: Federal Reserve REO and Vacant Properties Summit
8:30 AM: The initial weekly unemployment claims report will be released. Consensus is for a slight decrease to 470K from 473K last week. The increase in weekly claims is very concerning and the 4-week average is at the highest level since last November.
8:30 AM: Nonfarm Productivity for Q2 (Final)
10:00 AM: Manufacturers' Shipments, Inventories and Orders for July.
10:00 AM: Pending Home Sales Index for July. The consensus is for a slight increase (about 1.5%) in contracts signed. This index declined 2.6% in June (after collapsing in May). It usually takes 45 to 60 days to close, so this will provide an early indication of closings in September.
8:30 AM: Employment Report for August. The consensus is for about a loss of 90,000 payroll jobs, with 116,000 fewer Census jobs, or about +26,000 ex-Census increase in payrolls. The consensus is for the unemployment rate to increase slightly to 9.6% from 9.5% in July. For a preview, see: Will the unemployment rate spike higher?
10:00 AM: ISM Non-manufacturing Index for August. The consensus is for a decrease in the service index to 53.0 from 54.3 in July.
After 4:00 PM: The FDIC will probably have another busy Friday afternoon ...
Expected early in the week: Q2 Quarterly Banking Profile from the FDIC.
Expected on Thursday: August Personal Bankruptcy Filings
Summary for Week ending August 28th
by Calculated Risk on 8/29/2010 07:24:00 AM
It was a busy week ...
The NAR reported:
Existing-home sales, which are completed transactions that include single-family, townhomes, condominiums and co-ops, dropped 27.2 percent to a seasonally adjusted annual rate of 3.83 million units in July from a downwardly revised 5.26 million in June, and are 25.5 percent below the 5.14 million-unit level in July 2009.
...
Total housing inventory at the end of July increased 2.5 percent to 3.98 million existing homes available for sale, which represents a 12.5-month supply at the current sales pace, up from an 8.9-month supply in June.
 Click on graph for larger image in new window.
This graph shows existing home sales, on a Seasonally Adjusted Annual Rate (SAAR) basis since 1993.
Sales in July 2010 (3.83 million SAAR) were 27.2% lower than last month, and were 25.5% lower than July 2009 (5.14 million SAAR).
The next graph shows the year-over-year (YoY) change in reported existing home inventory and months-of-supply. Inventory is not seasonally adjusted, so it really helps to look at the YoY change.
 Although inventory increased from June 2010 to July 2010, inventory decreased 1.9% YoY in July. The slight year-over-year decline is probably because some sellers put their homes on the market in the Spring hoping to take advantage of the home buyer tax credit.
 Note: Usually July is the peak month for inventory.
A normal housing market usually has under 6 months of supply. The following graph shows the relationship between supply and house prices (using Case-Shiller).
 This graph show months of supply (through July 2010) and the annualized change in the Case-Shiller Composite 20 house price index (through May 2010).
Below 6 months of supply (blue line) house prices are typically rising (black line).
Above 6 or 7 months of supply, house prices are usually falling. This isn't perfect - it is just a guideline. This is a key reason why I expect house prices to fall further later this year as measured by the Case-Shiller and CoreLogic repeat sales house price indexes.
 The Census Bureau reports New Home Sales in July were at a seasonally adjusted annual rate (SAAR) of 276 thousand. This is an decrease from the record low of 315 thousand in June (revised down from 330 thousand).
This graph shows New Home Sales vs. recessions for the last 47 years.
And another long term graph - this one for New Home Months of Supply.
 Months of supply increased to 9.1 in July from 8.0 in June. The all time record was 12.4 months of supply in January 2009. This is still very high (less than 6 months supply is normal).
 The 276 thousand annual sales rate for July is the all time record low (May was revised up a little). This was another very weak report. New home sales are important for the economy and jobs - and this indicates that residential investment will be a sharp drag on GDP in Q3.
Here is my post on the MBA Q2 delinquency report: 14.42% of Mortgage Loans Delinquent or in Foreclosure . This graph (from the earlier post) shows the delinquency rate by "bucket" (30 days, 60 days, 90+ days, and in foreclosure process):
 The total percent of loans delinquent or in the foreclosure process declined only slightly in Q2 from Q1 - and the rate is the second highest on record.
Loans 30 days delinquent increased to 3.51%, and this is about the same levels as in Q4 2008 (slightly below the peak of 3.77% in Q1 2009).
Delinquent loans decreased in all other buckets - especially in the 90+ day bucket. MBA Chief Economist Jay Brinkmann suggested the decline in the 90+ day bucket was because of some successful modifications - since the lenders reported the loans as delinquent until the modification was made permanent.
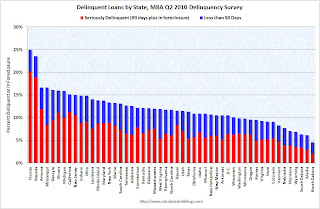 The second graph shows the delinquency rate by state (red is seriously delinquent: 90+ days or in foreclosure, blue is delinquent less than 90 days).
 Clearly Florida and Nevada have a large percentage of loans delinquent or in foreclosure. But the delinquency problem is widespread with 36 states and D.C. all having total delinquency rates above 10%.
With house prices falling - and growth slowing - the delinquency rate will probably increase later this year.
 Here is my post CoreLogic: 11 Million U.S. Properties with Negative Equity in Q2
This graph shows the negative equity and near negative equity by state.
Although Nevada, Arizona, Florida, Michigan and California, have the largest percentage of homeowners underwater, there is a negative equity problem in most states. In 33 states and the D.C., 10 percent or more of homeowners with mortgages have negative equity.
Best wishes to all.
Saturday, August 28, 2010
"Muddling through ... the prescription of the moment"
by Calculated Risk on 8/28/2010 10:31:00 PM
A couple of earlier post that might be of interest:
From Peter Goodman at the NY Times: What Can Be Done to Cure the Ailing Economy?
THE American economy is once again tilting toward danger. ..."Muddling through" and "hoping that things somehow get better" seems very defeatist - but I think it is an apt characterization of the current situation. There is always more that can be done ... and I think some people are confusing cyclical deficits with structural deficits. Oh well ...
Yet even as vital signs weaken ... a sense has taken hold that government policy makers cannot deliver meaningful intervention. That is because nearly any proposed curative could risk adding to the national debt — a political nonstarter. The situation has left American fortunes pinned to an uncertain remedy: hoping that things somehow get better.
...
The growing impression of a weakening economy combined with a dearth of policy options has reinvigorated concerns that the United States risks sinking into the sort of economic stagnation that captured Japan during its so-called Lost Decade in the 1990s.
...
Six months ago, Alan Blinder, a former vice chairman of the Federal Reserve, and now an economist at Princeton, dismissed the idea that America’s political system would ever allow the country to sink into a Japan-style quagmire. “Now I’m looking at the political system turning itself into a paralyzed beast,” he says, adding that a lost decade now looms as “a much bigger risk.”
...
By default, muddling through has emerged as the prescription of the moment.
Petruno: Time to let home prices fall?
by Calculated Risk on 8/28/2010 06:01:00 PM
From Tom Petruno at the LA Times: Time to let home prices fall?
A few excerpts:
[A] grim reality has set in: Despite the still-rich basket of tax breaks for residential property owners, and the lowest mortgage rates in a generation, the pool of willing or able buyers is dwindling. [CR note: These are the lowest mortgage rates in far more than a generation - these are the lowest since at least the '50s if not even longer. Freddie Mac's surveys only go back to 1971.]Supporting house prices has helped the banks, but I think the idea was generally flawed. The key to the housing market is to absorb the excess inventory. That means more households and fewer new housing units. Luckily housing starts are very low right now, but unfortunately there is very little job growth (and therefore little new household formation).
...
Government policy has been aimed at slowing or stopping the decline in prices, for obvious reasons: A further drop in home values would push more owners underwater, meaning their homes would be worth less than their mortgage balance.
...
Dean Baker, co-director of the Center for Economic Policy and Research in Washington, believes home prices still are overvalued by 15% to 20% in many areas.
For government to stand in the way of a further price decline is unfair to the next generation of buyers, he said. "The people who get hurt the most are those who are overpaying for houses today," he said.
Robert Shiller, co-creator of the S&P/Case-Shiller price indexes, said that although he doesn't forecast prices, "I think the scenario of declining home prices for years to come is underemphasized by people."
Petruno quotes NAHB economist David Crowe:
Historically, housing has led the way in recoveries. "But this is a case where housing is going to follow the economy, not lead it," [said David Crowe, chief economist for the National Assn. of Home Builders].This is correct. Usually housing is a key engine of recovery, especially for jobs. But this time housing is going to follow the economy.
That means policy needs to be aimed at making sure that many existing households stay in place (like unemployment benefits, although I'd prefer something along the lines of Minsky's approach) and trying to add new jobs (like infrastructure jobs). More jobs mean more households. More households will absorb the excess inventory. And then eventually housing will recover and help the economy.
Let house prices fall.
Employment Report Preview: Will the unemployment rate spike higher?
by Calculated Risk on 8/28/2010 01:05:00 PM
The August employment report will be released next Friday, Sept 3rd. The consensus is for the loss of around 90,000 payroll jobs, and an increase in the unemployment rate to 9.6% (from 9.5% in July).
The decennial Census will subtract about 116,000 payroll jobs in August (estimate here), so the consensus is for about +26,000 payroll jobs ex-Census.
I will take the under on the number of payroll jobs. I think it is possible that we will see a negative payroll number, ex-Census, because of weak private hiring combined with state and local layoffs.
And I will also take the over on the unemployment rate. Here is why:
The unemployment rate is from the household survey, and is impacted by the participation rate - the percent of the civilian population in the labor force. The following graph shows the sharp decline in the participation rate during the current employment recession.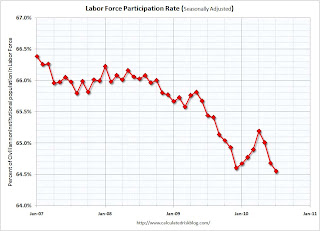 Click on graph for larger image in new window.
Note: y-axis starts at 64% to show the change.
The increase in the participation rate earlier this year was good news. This meant some workers who had given up were rejoining the labor force. The increase in the participation rate pushed up the unemployment rate, since the economy wasn't adding jobs fast enough to employ all the workers rejoining the labor force. But it was still good news that the participation rate was increasing.
However it was bad news when the participation rate started falling again over the last few months. The decline in the unemployment rate - from 9.9% in April to 9.5% in June and July - was related to the decline in the participation rate. And workers leaving the labor force is not great news.
But what will happen to the participation rate in August? The first guess, with the weak economy, is that the participation rate declined further in August, putting downward pressure on the unemployment rate.
But there are two reasons I think the participation rate might have increased.
Summer teen employment: As I noted in June, the record low number of teens joining the labor force appeared to push down the seasonally adjusted participation rate (and therefore pushed down the unemployment rate). I think this will start to unwind in August. As a lower than normal number of teens leave the labor force, the seasonally adjusted teen labor force will probably increase - my guess is by 100,000 to 150,000 workers. All else being equal, this would push up the participation rate, and also push up the unemployment rate to around 9.6%.
Unemployment Benefits: At the end of July, the qualification dates for the various tiers of Federal unemployment benefits were extended through November 30th. This extension was also made retroactive to June 2nd. Some people who have given up, might rejoin the labor force to collect additional benefits. If this happens, the participation rate might increase in August - and that would push up the unemployment rate. Although the number is uncertain, if 250,000 workers rejoin the labor force to collect benefits that would push the unemployment rate to 9.7%. If 500,000 workers rejoin the labor force, plus the 125,000 from the teen adjustment, the unemployment rate would increase to around 9.9%.
As noted above, the weak economy would normally lead to a lower participation rate, but these two reasons might push the participation rate up - and that could mean a higher than expected increase in the unemployment rate.


