 RSS Feed
 by Calculated Risk on 4/26/2010 08:36:00 AM
Monday, April 26, 2010
Greece: 10-Year debt yield spread widens to new record
From The Times: Pressure mounts on Greek Government as cost of borrowing rises above 9 per cent
The bond markets hammered Greek government debt this morning, raising the cost of borrowing for the eurozone nation above 9 per cent.From the WSJ: Cost of Insuring Greek Debt Soars
[T]he gap in yields between 10-year debt from Greece and Germany—the euro-zone's most solid borrower—swinging out to a new record of 6.11 percentage points. That yield spread stood at 5.63 percentage points after Greece asked to activate the aid package Friday.On May 19th, €8.5bn of Greece's bonds mature - so there is very little time left to work out the details of a loan package.
Sunday, April 25, 2010
Krugman: "Berating the Raters"
by Calculated Risk on 4/25/2010 11:59:00 PM
From Paul Krugman in the NY Times: Berating the Raters
[T]he e-mail messages you should be focusing on are the ones from employees at the credit rating agencies, which bestowed AAA ratings on hundreds of billions of dollars’ worth of dubious assets, nearly all of which have since turned out to be toxic waste. And no, that’s not hyperbole: of AAA-rated subprime-mortgage-backed securities issued in 2006, 93 percent — 93 percent! — have now been downgraded to junk status.The rating agencies played a key role in the housing bubble. They used models based on historical performance for mortgages, and didn't account for the "innovations" in lending such as the entire chain of the originate-to-distribute model: automated underwriting, reliance on FICO scores instead of the 3 Cs (creditworthiness, capacity, and collateral), agency issues with the widespread use of independent mortgage brokers, expanded securitization, non-traditional mortgage products, etc.
What those e-mails reveal is a deeply corrupt system.
...
The Senate subcommittee has focused its investigations on the two biggest credit rating agencies, Moody’s and Standard & Poor’s; what it has found confirms our worst suspicions. In one e-mail message, an S.& P. employee explains that a meeting is necessary to “discuss adjusting criteria” for assessing housing-backed securities “because of the ongoing threat of losing deals.” Another message complains of having to use resources “to massage the sub-prime and alt-A numbers to preserve market share.”
Of course the rating agencies just offered "opinions", and unknown to investors, those valued opinions were apparently quite malleable.
How does the new financial regulation fix this problem?
China Real Estate
by Calculated Risk on 4/25/2010 09:08:00 PM
First - here is the weekly summary and a look ahead ...
From David Pierson at the LA Times: In China, real estate fever is rising
Hundreds of miles inland from the booming real estate markets of Beijing and Shanghai, an unlikely property fever is gripping this middling industrial outpost.And on speculators:
...
Taxi drivers boast of owning multiple flats for investment. Billboards hawk developments with names such as Villa Glorious and Rich Country. Frenzied crowds pack sales events with bags of cash, buying units that exist only on blueprints. Average home values in Hefei soared 50% last year.
...
"No one had any idea real estate would get this hot here," said Huang Qingyuan, a sales agent for one of Hefei's most expensive housing estates — they go for about $120,000 per apartment.
While pricey by local standards, that's still a fraction of what homes cost in the capital.
[In a building that is sold out, Guo Hongbing, a marketing consultant for several developers] was interested in estimating how many were left empty by investors. His unscientific method? Looking for curtains.A few key points:
"See, less than half that building is occupied," he said, pointing to one block with several bare windows. "These speculators want to buy as many possible."
Of course the rules could change. From Esther Fund at the WSJ: China Considers U.S.-Style Property Tax
China is considering introducing new or higher taxes on real estate, possibly even a U.S.-style property tax, which would mark a significant escalation of its struggle to cool down a booming property market now widely being described as a bubble.This is different than the loose credit driven bubble in the U.S. Per my friend Michael in China:
How authorities handle any kind of property tax—the prospect of which is fiercely opposed by some property developers—will have significant implications for China's economy ...
The majority of homes in China are purchased with down payments between 30-40%, which is required by the banks, and nearly 25% of homes are purchased with all cash. Only those qualifying for low-cost housing can purchase a home with a minimum down payment as low as 20%.If anything the lending is stricter now. But this property tax proposal (or something similar) could have a real impact.
Sunday afternoon Greece: "Most important week of Europe’s monetary union"
by Calculated Risk on 4/25/2010 04:04:00 PM
The previous post was the weekly summary and a look ahead ...
On Greece, from the Financial Times: Greek aid depends on budget cut plans
Greece has been told to produce detailed plans this week to meet its budget deficit reduction targets in 2011 and 2012, as well as this year, before it can qualify for a ... rescue package ...And from Wolfgang Münchau at the Financial Times: Greece is Europe’s very own subprime crisis
excerpt with permission
This is going to be the most important week in the 11-year history of Europe’s monetary union. By the end of it we will know whether the Greek fiscal crisis can be contained or whether it will metastasise to other parts of the eurozone.Münchau suggests three things to watch: 1) to see if Greece presents a credible plan (Münchau says what he has heard is "deeply discouraging"), 2) that the loan package has to be substantially more than €45bn (Münchau says €80bn) and 3) the situation in Germany (Angela Merkel is still struggling for support).
Meanwhile from Bloomberg: Papaconstantinou Tells Investors Don’t Attack Greece
[Greek Finance Minister George Papaconstantinou] expressed confidence the talks will be “concluded rather soon” and said his country wouldn’t restructure its debt.A key date is May 19th when €8.5bn of Greece's bonds mature.
Weekly Summary and a Look Ahead
by Calculated Risk on 4/25/2010 11:45:00 AM
The key economic stories this week will be house prices, the FOMC meeting and the “advance estimate” for Q1 GDP to be released on Friday.
On Monday the LoanPerformance house price index (for February) will probably be released. Also on Monday, the Census Bureau report on Housing Vacancies and Homeownership for Q1 will be released at 10 AM. Although noisy quarter-to-quarter, this report has been showing a declining homeownership rate. The vacancy rates for homeowners and renters have probably peaked, but both will still be near record levels.
On Tuesday the February Case-Shiller Home Price Index will be released at 9 AM by S&P. This will be confused by the recent S&P release cautioning about the seasonal adjustment. Also on Tuesday the Conference Board will release consumer confidence at 10 AM, and Fed Chairman Bernanke, budget director Peter Orszag, and others will speak at President Obama’s debt-reduction commission.
The Federal Open Market Committee (FOMC) is meeting on Tuesday and Wednesday, and the FOMC statement will be released on Wednesday at around 2:15 PM . Although there will be no change to the Fed Funds rate, or to the “extended period” language, there might be a few minor changes to the statement – perhaps a little more upbeat on the economy, maybe some discussion of eventual asset sales to appease a few hawkish members (not going to happen any time soon), and perhaps a comment on disinflation or the weak housing market.
On Thursday the closely watched initial weekly unemployment claims will be released. The consensus is for a decline to 446K this week from 456K last week. Also on Thursday (or earlier in the week) the ATA Truck Tonnage Index for March will be released.
And on Friday, the Advance Q1 GDP report will be released by the BEA at 8:30 AM. The consensus is for an annualized increase of 3.4%. Also on Friday, the Chicago Purchasing Managers Index for April, and the March Restaurant Performance index will be released. And of course the FDIC will probably be busy Friday afternoon ...
And a summary of last week:
The Census Bureau reported New Home Sales in March were at a seasonally adjusted annual rate (SAAR) of 411 thousand. This was an increase from the revised rate of 324 thousand in February (revised from 308 thousand).
 Click on graphs for larger image in new window.
The first graph shows monthly new home sales (NSA - Not Seasonally Adjusted).
Note the Red columns for 2010. In March 2010, 38 thousand new homes were sold (NSA).
The record low for March was 31 thousand in 2009.
 Months of supply declined to 6.7 in March from 8.6 in February. This is significantly below the all time record of 12.4 months of supply set in January 2009, but still higher than normal.
New home sales are counted when the contract is signed, so this pickup in activity is probably related to the tax credit. Note that that a few thousand extra sales NSA in March can make a huge difference in the SAAR.
The NAR reported: Existing-Home Sales Rise
Existing-home sales ... rose 6.8 percent to a seasonally adjusted annual rate of 5.35 million units in March.
 This graph shows existing home sales, on a Seasonally Adjusted Annual Rate (SAAR) basis since 1993.
 Sales in March 2010 (5.35 million SAAR) were 6.8% higher than last month, and were 16.1% higher than March 2009 (4.61 million SAAR).
Note: existing home sales are counted at closing, so even though contracts must be signed in April to qualify for the tax credit, buyers have until June 30th to close.
 This graph shows the year-over-year change in reported existing home inventory and months-of-supply.
The YoY inventory has been decreasing for the last 20 months. However the YoY decline is getting smaller - only 1.8% in March.
This slow decline in the inventory is especially concerning with the large reported inventory and 8.0 months of supply in March - well above normal.
 This graph shows NSA monthly existing home sales for 2005 through 2010 (see Red columns for 2010).
 Sales (NSA) in March 2010 were 19.6% higher than in March 2009, and also higher than in March 2008.
We will probably see an increase in sales in May and June - perhaps to the levels of 2006 or 2007 - because of the tax credit, however I expect to see existing home sales below last year in the 2nd half of this year.
 From the AIA: Billings Index Inches Up in March
Note: This index is a leading indicator for Commercial Real Estate (CRE) investment.
This graph shows the Architecture Billings Index since 1996. The index has remained below 50, indicating falling demand, since January 2008.
 The Department of Transportation (DOT) reported that vehicle miles driven declined year-over-year in February.
This graph shows the percent change from the same month of the previous year as reported by the DOT.
Miles driven in February 2010 were down -2.9% compared to February 2009.
The Moody’s/REAL All Property Type Aggregate Index declined 2.6% in February. This is a repeat sales measure of commercial real estate prices.
 CRE prices only go back to December 2000.
The Case-Shiller Composite 20 residential index is in blue (with Dec 2000 set to 1.0 to line up the indexes).
Commercial real estate values are now down 25.8% over the last year, and down 41.8% from the peak in August 2007.
Senate panel: Ratings agencies rolled over for Wall Street
Best wishes to all.
Morning Greece: Germany and France Talk Tough
by Calculated Risk on 4/25/2010 09:01:00 AM
From Reuters: Germany, France signal hard line with Greece (ht Jonathan)
German Finance Minister Wolfgang Schaeuble warned Greece that a tough restructuring of its economy was "unavoidable and an absolute prerequisite" if Berlin and the EU were to approve the aid Greece has requested.There will probably be some more news later today.
"The fact that neither the EU nor the German government have taken a decision (on providing aid) means the response can be positive as well as negative," Schaeuble told the Sunday edition of German daily Bild.
...
Schaeuble's French counterpart Christine Lagarde promised to hold Greece accountable for "unsuitable economic policies" ... She described the aid package as a "cocktail of indulgence and great strictness," telling the Journal du Dimanche weekly that Greece's partners would closely monitor its progress in restoring order to its creaking finances.
"We will (release the aid) according to their needs and in the case of default on repayment, we will immediately put the foot on the brake," Lagarde said.
Saturday, April 24, 2010
U.S. Trade: Wham-O Moves back to America
by Calculated Risk on 4/24/2010 09:07:00 PM
From the Daily Show ... Wham-O Moves to America
| The Daily Show With Jon Stewart | Mon - Thurs 11p / 10c | |
| Wham-O Moves to America | ||
| ||
Puerto Rico Banking News
by Calculated Risk on 4/24/2010 04:08:00 PM
From Martha Dreyer Duperray at Caribbean Business: Frank Stipes out as Westernbank chief
Westernbank President and CFO Frank Stipes ... resigned [on Friday] ... sources told caribbeanbusinesspr.com that agreement has been reached by the troubled bank to sell several branches to Banco Popular ...From the Unofficial Problem Bank List - there are three banks in Puerto Rico operating under Cease & Desist orders:
1) Westernbank Puerto Rico in Mayaguez with $11.9 billion in assets.
2) R-G Premier Bank of Puerto Rico in Hato Rey with $6.6 billion in assets.
3) Eurobank in Hato Rey with $2.6 billion in assets
All three are rumored to be out for bid. Last week the FDIC was busy in Illinois. Is this the week for Puerto Rico?
'Betting Against the American Dream'
by Calculated Risk on 4/24/2010 11:49:00 AM
An update from David Kestenbaum at Planet Money on their toxic asset: Toxie Update: Our Latest Check Arrives. Oh No.
As you know, we purchased our own toxic asset so we could watch it die.And some music ...
And she, Toxie, is dying. We just got our latest monthly check, and it's for just $72.41.
We'd been hoping for about $180, but there's been less money coming in from those 2,000-plus mortgages. All the investors in this thing are basically standing in line to get paid. We're near the back of the line, so we take the hit.
But that's not the real problem.
Toxie soon will be actually wasting away. Every month some of the houses that had been foreclosed upon, actually get sold and sold for a loss. As those losses accumulate, Toxie shrinks and eventually there's nothing left.
Our online folks just updated the graphic. Check out the "how long we have left" bar chart. It looks like next month the losses will actually eat into our Toxie, and she'll start to shrink.
I've been thinking of this like we are standing in line to get paid. We're at the back of the line, and there's this monster eating the people behind us. Next month the monster starts chewing on our heels.
Vehicle Sales: Fleet Turnover Ratio
by Calculated Risk on 4/24/2010 08:49:00 AM
Way back, during the darkest days of the recession, I wrote a couple of optimistic posts about auto sales - Vehicle Sales (Jan 2009) and Looking for the Sun (Feb 2009). By request, here is an update to the U.S. fleet turnover graph.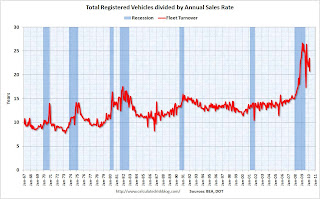 Click on graph for larger image in new window.
This graph shows the total number of registered vehicles in the U.S. divided by the sales rate through March 2010 - and gives a turnover ratio for the U.S. fleet (this doesn't tell you the age or the composition of the fleet).
The recent wild gyrations were due to the cash-for-clunkers program. Note: We are getting used to wild gyrations in economic numbers - just watch the housing numbers over the next few months!
The estimated ratio for March was just under 21 years - still very high, but well below the peak of almost 27 years. The turnover ratio will probably decline further over the next few years.
As expected some vehicles were removed from the fleet during the recession (scrappage exceeded sales), from RL Polk: Polk Finds More Vehicles Scrapped than Added to Fleet:
More than 14.8 million cars and light trucks were retired from the fleet between July 1, 2008 and September 30, 2009, compared to new registrations of slightly more than 13.6 million, resulting in an overall scrap rate of 6.1 percent. This includes thousands of units scrapped during last year’s CARS program, known as ‘Cash for Clunkers,’ and follows a trend seen by Polk over the past five years.Removing vehicles from the fleet reduces the turnover ratio, but most of the expected decline in the ratio will come from further increases in sales.
Polk also reports an increase in the average age of light vehicles on the road, up 21 percent in the past 14 years. The average age for all light vehicles during the 15-month period is 10.2 years ...
 The second graph shows light vehicle sales since the BEA started keeping data in 1967.
 Light vehicle sales were at a 11.8 million SAAR in March. To bring the turnover ratio down to more normal levels, unit sales will probably have to rise to 14 or 15 million SAAR eventually. Of course cars are lasting longer - note the general uptrend in the first graph - so the turnover ratio probably will not decline to the previous level. Also this says nothing about the composition of the fleet (perhaps smaller cars).


