 RSS Feed
 by Calculated Risk on 4/27/2010 11:42:00 AM
Tuesday, April 27, 2010
S&P Downgrades Greece and Portugal
From MarketWatch: S&P cuts Greece ratings to junk status
Standard & Poor's said Tuesday it cut Greece's ratings to junk status. The ratings agency lowered the long-term sovereign credit rating on Greece to BB+ from BBB+. The outlook is negative.From CNBC:
S&P downgraded its rating on Portugal's debt by two notches to A-minus.
Video: Goldman's Blankfein Testifies to Congress
by Calculated Risk on 4/27/2010 09:55:00 AM
Goldman executives, including Chief Executive Lloyd Blankfein, will testify before the Senate Permanent Subcommittee on Investigations at 10 AM ET. There is apparently some interest in this testimony.
Here is the CNBC feed.
Here is the C-Span3 Link
Case-Shiller House Prices "mixed" in February
by Calculated Risk on 4/27/2010 09:00:00 AM
IMPORTANT: These graphs are Seasonally Adjusted (SA). S&P has cautioned that the seasonal adjustment is probably being distorted by irregular factors. These distortions could include distressed sales and the various government programs.
S&P/Case-Shiller released the monthly Home Price Indices for February (actually a 3 month average).
The monthly data includes prices for 20 individual cities, and two composite indices (10 cities and 20 cities).
From S&P: Home Prices Mixed in February 2010
Data through February 2010, released today by Standard & Poor’s for its S&P/Case-Shiller Home Price Indices, the leading measure of U.S. home prices, show that the annual rates of decline of the 10-City and 20-City Composites improved in February compared to January 2010. For the first time since December 2006, the annual rates of change for the two Composites are positive. The 10-City Composite is up 1.4% from where it was in February 2009, and the 20-City Composite is up 0.6% versus the same time last year. However, 11 of 20 cities saw year-over-year declines.
 Click on graph for larger image in new window.
 The first graph shows the nominal not seasonally adjusted Composite 10 and Composite 20 indices (the Composite 20 was started in January 2000).
The Composite 10 index is off 30.0% from the peak, and up slightly in February (SA).
The Composite 20 index is off 29.3% from the peak, and down slightly in February (SA).
 The second graph shows the Year over year change in both indices.
The Composite 10 is up 1.4% compared to February 2009.
The Composite 20 is up 0.6% compared to February 2009.
These are the first YoY price increases since 2006.
The third graph shows the price declines from the peak for each city included in S&P/Case-Shiller indices.
 Prices decreased (SA) in 15 of the 20 Case-Shiller cities in February.
 Prices in Las Vegas are off 55.7% from the peak, and prices in Dallas only off 6.0% from the peak.
Note: Congratulations to S&P: the new release format is excellent.
Morning Greece: Contagion Concerns
by Calculated Risk on 4/27/2010 08:24:00 AM
Greek government debt yields increased again this morning (ht Mike), from Bloomberg:
 |
From Bloomberg: Portugal Suffering Greek Contagion Pressures EU Bonds
With a higher debt burden and a slower 10-year growth rate than Greece, Western Europe’s poorest country is being punished by investors as the sovereign debt crisis spreads. ... Portugal’s credit default swaps show investors rank its debt as the world’s eighth-riskiest, worse than for Lebanon and Guatemala.From Bloomberg: Greece Bond Losses to Be ‘Significant,’ Buiter Says
Greece is likely to default or inflict “significant” losses on bondholders unless it receives more generous terms on its planned aid package, according to Willem Buiter, chief economist at Citigroup Inc.
Shanghai Composite index down 2.1%
by Calculated Risk on 4/27/2010 12:34:00 AM
Since I haven't posted a graph of the Shanghai index in some time ...
From MarketWatch: Shanghai Composite index down 2.1% at midday break
Mainland Chinese shares extend losses in the Tuesday morning session, with sharp retreats in commodity producers further pressuring markets already weighed by fears of policy tightening, especially in the property sector.
 Click on graph for larger image in new window.
This graph shows the Shanghai SSE Composite Index and the S&P 500 (in blue).
The SSE Composite Index is at 2,906.35 mid-day.
Monday, April 26, 2010
Home Tax Credit a Costly Failure
by Calculated Risk on 4/26/2010 09:40:00 PM
From David Kocieniewski at the NY Times: Home Tax Credit Called Successful, but Costly
Though the Treasury Department and the real estate industry have termed the program a success, helping 1.8 million people buy homes, many tax policy experts say it has been singularly cost-ineffective: most of the $12.6 billion in credits through end of February was collected by people who would have bought homes anyway or who in some cases were not even eligible.There is no question this program was very costly. And why is the Treasury confusing activity with accomplishment? Sure sales briefly surged, but were new households formed? How many new jobs were created?
“We were happy in our apartment, but $8,000 was just too much to pass up,” said [Mr. James Green, a student at Purdue University], 29, who shopped furiously with his wife for two months before signing a contract in March to buy a three-bedroom ranch.This is very optimistic - the ratio was probably 5-to-1 for the initial credit and even higher for the extension. But this shows two failures of the tax credit: 1) the high cost, and 2) it was just moving people from apartments to homes and didn't reduce the excess housing inventory (yes, rentals count as housing inventory too).
“We bid on a couple places that didn’t work out,” he said, “but we always made sure we had a backup plan because we didn’t want to miss the deadline for the credit. And when we finally agreed to a contract, it was this huge relief.”
For every home buyer like the Greens, real estate agents say there are at least three others who collected the credit even though they would have bought without it. That means for each new buyer who was truly lured into the market by the credit, the federal government paid more than $30,000.
“The tax credit helped to stanch the price declines, which had substantial benefit for the entire economy,” said Mark Zandi at Moody’s Economy.com.And this has been the policy - support asset prices by limiting the supply (all the foreclosure delays), and pushing demand (low mortgage rates and the tax credit). This has helped the banks significantly, and Zandi argues this has boosted confidence. Maybe ... but I'm not convinced that supporting house prices above the market clearing level to help the banks and boost consumer confidence makes sense. I think targeting jobs - and therefore household formation - would have been a far more cost effective program.
Yield on Greek Two-Year Bonds jumps to 13.5%
by Calculated Risk on 4/26/2010 05:49:00 PM
From the Financial Times: Greek bond markets plunge again
The yield on two-year Greek government bonds ... jumped 3 percentage points ... to close at 13.522 per cent.This is now higher than Venezuela at 11%.
This is the highest yield on short-dated government debt in the world ...
excerpt with permission
The yields jumped for some of the other PIIGS too (Portugal, Ireland, Italy, Greece and Spain). For Portugal the two-year yield increased more than 3/4 of a point to 3.98%.
New Offering: Bullet Proof Mortgage Backed Securities
by Calculated Risk on 4/26/2010 01:45:00 PM
There was an article on Bloomberg last week about "the first new-mortgage securities without government-backed guarantees in more than two years": Redwood, Citigroup End Two-Year Mortgage-Bond Drought (ht Brian)
My reaction was that these will be all low LTV mortgages with stellar credit ratings. I guessed the mortgages were essentially "bullet proof" ... Sure enough, here is the SEC filing: Sequoia Mortgage Trust 2010-H1 (ht Ramsey Su)
The details of the mortgages and the borrowers start on page 16. This is for 255 mortgages with an aggregate principal balance of $238 million. The weighted FICO score is 768, and the average Loan-to-Value is 56%.
Most are just refis of existing mortgage on owner occupied properties. There are 52 purchase mortgage with an average of just over 30% down.
This deal will close this week. Ramsey is concerned the media will hype this transaction. He points out that the sponsors cherry picked the mortgages and he wrote "these are the crème de la crème of mortgages". In addition the sponsors are taking the first loss positions:
"The sponsor (or affiliates of the sponsor) will initially retain the following certificates: (i) all of the Non-Offered Certificates, representing 6.50% of the original principal balance of the securitization, and (ii) 5% of the original principal balance of Offered Certificates."There are plenty of details - heck, 22 of the borrowers make over $100,000 per month (yes, per month).
This is as close to bulletproof as it gets.
First American CoreLogic: House Prices Decline 2.0% in February
by Calculated Risk on 4/26/2010 10:48:00 AM
The Fed's favorite house price indicator from First American CoreLogic’s LoanPerformance ...
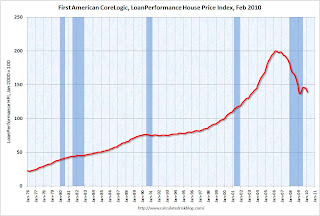
From LoanPerformance: Home Price Index Shows First Annual Increase in Over Three Years, But Shadow Inventory and End of Tax Credit Program May Result in Further Declines
National home prices, including distressed sales, increased by 0.3 percent in February 2010 compared to February 2009, according to First American CoreLogic and its LoanPerformance Home Price Index (HPI). This was an improvement over January’s year-over-year price decline of 0.5 percent. Excluding distressed sales, year-over-year prices increased in February by 0.6 percent; an improvement over the January non-distressed HPI which fell by 1.1 percent year-over-year.
On a month-over-month basis, the national average home price index fell by 2.0 percent in February 2010 compared to January 2010, which was steeper than the previous one-month decline of 1.6 percent from December to January. Prices are typically weak in the winter months, so seasonal effects may be driving this one-month change.
 Click on graph for larger image in new window.
 This graph shows the national LoanPerformance data since 1976. January 2000 = 100.
The index is up 0.3% over the last year, and off 30.6% from the peak.
House prices are off 4.9% from the recent peak in August 2009 (although some of the decline is seasonal).
With all the distressed sales and government programs, it is hard to separate the seasonal factors from other distortions. However I expect that we will see lower prices on this index later this year - as does CoreLogic (from the press release):
After a modest increase this spring and summer, the national single-family combined index is projected to decline by 3.4 percent from February 2010 to February 2011 assuming the expiration of current Federal Housing Stimulus programs.
Q1 2010: Homeownership Rate Lowest Since Q1 2000
by Calculated Risk on 4/26/2010 10:00:00 AM
The Census Bureau reported the homeownership and vacancy rates for Q1 2010 this morning. Here are a few graphs ...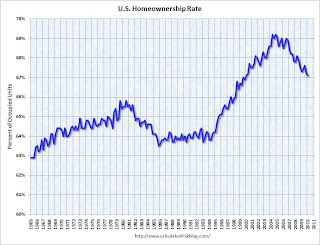 Click on graph for larger image in new window.
The homeownership rate declined to 67.1%. This is the lowest level since Q1 2000.
Note: graph starts at 60% to better show the change.
The homeownership rate increased in the '90s and early '00s because of changes in demographics and "innovations" in mortgage lending. The increase due to demographics (older population) will probably stick, so I've been expecting the rate to decline to the 66% to 67% range - and not all the way back to 64% to 65%.  The homeowner vacancy rate was 2.6% in Q1 2010.
A normal rate for recent years appears to be about 1.7%.
This leaves the homeowner vacancy rate about 0.9% above normal. This data is not perfect, but based on the approximately 75 million homeowner occupied homes, we can estimate that there are close to 675 thousand excess vacant homes.
The rental vacancy rate was 10.6% in Q1 2010.  It's hard to define a "normal" rental vacancy rate based on the historical series, but we can probably expect the rate to trend back towards 8%. According to the Census Bureau there are close to 41 million rental units in the U.S. If the rental vacancy rate declined from 10.6% to 8%, there would be 2.6% X 41 million units or over 1 million units absorbed.
This suggests there are still about 1.7 million excess housing units, and these excess units will keep pressure on housing starts, rents and house prices for some time.


