by Calculated Risk on 9/30/2009 09:40:00 PM
Wednesday, September 30, 2009
Summary: Today and Tomorrow
A quick summary and a look ahead ...
CIT Group Inc. upped the ante with its creditors by drawing up a prepackaged bankruptcy plan, two people familiar with the matter said Wednesday. ... Another person familiar with the matter said CIT likely wouldn't roll out the debt-exchange offer and prepackaged bankruptcy solicitation until late Thursday night.CIT would be the fifth largest bankruptcy in U.S. history behind Lehman Brothers, Washington Mutual, WorldCom and General Motors.
Tomorrow
And Bernanke testifies on financial reform.
So I apologize in advance for all the posts.
BofA CEO Ken Lewis to Retire
by Calculated Risk on 9/30/2009 05:48:00 PM
From Bloomberg: Bank of America’s Chief Executive Ken Lewis to Retire Dec. 31
No successor named.
Not sure what to make of this.
BofA Press Release: Ken Lewis Announces His Retirement
"Bank of America is well positioned to meet the continuing challenges of the economy and markets," said Lewis. "I am particularly heartened by the results that are emerging from the decisions and initiatives of the difficult past year-and-a-half."
"The Merrill Lynch and Countrywide integrations are on track and returning value already," Lewis noted. "Our board of directors and our senior management include more talent, and more diversity of talent, than at any time in this company's history. We are in position to begin to repay the federal government's TARP investments. For these reasons, I decided now is the time to begin to transition to the next generation of leadership at Bank of America."
OCC and OTS: Modification Re-Default Rates
by Calculated Risk on 9/30/2009 04:02:00 PM
Here is some more data from the Office of the Comptroller of the Currency and the Office of Thrift Supervision: OCC and OTS Release Mortgage Metrics Report for Second Quarter 2009
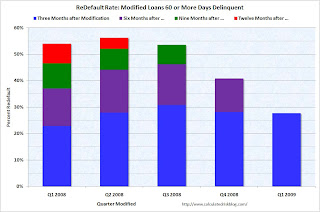
Modified Loan Performance ... [T]he percentage of loans that were 60 or more days delinquent or in the process of foreclosure rose steadily in the months subsequent to modification for all vintages for which data were available. Modifications made in third quarter 2008 showed the highest percentage of modifications that were 60 or more days past due following the modification. Modifications made during fourth quarter 2008 and first quarter 2009 performed better in the first three to six months after the modification than those made in the third quarter 2008.Note: This doesn't include HAMP yet because all of those modifications are still in the "trial period". That raises a question: If a borrower re-defaults during the trial, will they still be considered a "re-default"? Something to watch for if the re-default rate drops sharply next quarter - they might be excluding the trial period re-defaulters.
 Click on graph for larger image.
This graph shows the cumulative re-default rate by quarter of modifications. About 25% to 30% of modifications fail in the first three months.
For Q1 and Q2 2008, about 55% of borrowers have re-defaulted. Q3 2008 will probably be worse, and Q4 2008 and Q1 2009 about the same.
Over time, I expect a very high re-default rate since many of these modifications are just "extend and pretend" (the missed payments and fees are added to the principal, and the rate is reduced for a few years), although about 10% of borrowers received a principal reduction in Q2 (more than double as in Q1).
Restaurants: 24th Consecutive Month of Contraction
by Calculated Risk on 9/30/2009 02:11:00 PM
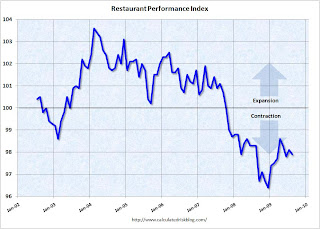
Note: Any reading below 100 shows contraction for this index.
From the National Restaurant Association (NRA): Restaurant Performance Index Declined in August as Same-Store Sales and Customer Traffic Slipped
Restaurant industry performance softened in August, as the National Restaurant Association’s comprehensive index of restaurant activity posted a modest decline. The Association’s Restaurant Performance Index (RPI) – a monthly composite index that tracks the health of and outlook for the U.S. restaurant industry – stood at 97.9 in August, down 0.2 percent from July and its third decline in the last four months.
...
The Current Situation Index, which measures current trends in four industry indicators (same-store sales, traffic, labor and capital expenditures), stood at 96.0 in August – down 0.9 percent from July and its sharpest decline in nearly a year. In addition, August represented the 24th consecutive month below 100, which signifies contraction in the current situation indicators.
The sharp decline in Current Situation Index was the result of deteriorating sales and traffic levels in August.
emphasis added
 Click on graph for larger image in new window.
Unfortunately the data for this index only goes back to 2002.
The restaurant business is still contracting ...
No Green Shoots for you!
OCC and OTS: Foreclosures, Delinquencies increase in Q2
by Calculated Risk on 9/30/2009 11:32:00 AM
From the Office of the Comptroller of the Currency and the Office of Thrift Supervision: OCC and OTS Release Mortgage Metrics Report for Second Quarter 2009
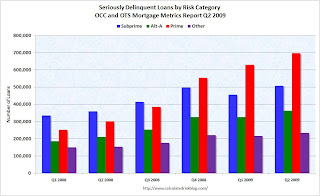
This OCC and OTS Mortgage Metrics Report for the second quarter of 2009 provides performance data on first lien residential mortgages serviced by national banks and federally regulated thrifts. The report covers all types of first lien mortgages serviced by most of the industry’s largest mortgage servicers, whose loans make up approximately 64 percent of all mortgages outstanding in the United States. The report covers nearly 34 million loans totaling almost $6 trillion in principal balances and provides information on their performance through the end of the second quarter of 2009 (June 30, 2009).Much of the report focuses on modifications and recidivism, but this report also shows far more seriously delinquent prime loans than subprime loans (by number, not percentage).
The mortgage data reported for the second quarter of 2009 continued to reflect negative trends influenced by weakness in economic conditions including high unemployment and declining home prices in weak housing markets. As a result, the number of seriously delinquent mortgages and foreclosures in process continued to increase. However, a lull in newly initiated foreclosures occurred as servicers worked to implement the “Making Home Affordable” program during the second quarter.
...
The percentage of current and performing mortgages in the portfolio decreased by 1.4 percent from the previous quarter to 88.6 percent of all mortgages in the portfolio. All categories of delinquencies increased from the previous quarter, with serious delinquencies—loans 60 or more days past due and loans to delinquent bankrupt borrowers—reaching 5.3 percent of all mortgages in the portfolio, an increase of 11.5 percent from the previous quarter. Foreclosures in process reached 2.9 percent of all mortgages, a 16.2 percent increase.
...
In the second quarter, 15.2 percent of Payment Option ARMs were seriously delinquent, compared with 5.3 percent of all mortgages, and 10 percent were in the process of foreclosure, more than triple the 2.9 percent rate for all mortgages.
...
Mortgages guaranteed by the U.S. government, primarily through the Federal Housing Administration (FHA) or the Department of Veterans Affairs (VA), also showed higher delinquencies than the overall servicing portfolio. Serious delinquencies increased to 7.5 percent of all government guaranteed mortgages, up from 6.8 percent in the previous quarter.
emphasis added
 Click on graph for larger image.
We're all subprime now!
Note: "Approximately 13 percent of loans in the data were not accompanied by credit scores and are classified as “other.” This group includes a mix of prime, Alt-A, and subprime. In large part, the loans were result of acquisitions of loan portfolios from third parties where borrower credit scores at the origination of the loans were not available."
This report covers about two-thirds of all mortgages. There are far more prime loans than subprime loans - and the percentage of delinquent prime loans is much lower than for subprime loans. However, there are now significantly more prime loans than subprime loans seriously delinquent. And prime loans tend to be larger than subprime loans, so the losses from each prime loan will probably be higher.

The second graph shows foreclosure activity.
Notice that foreclosure in process are increasing sharply, but completed foreclosures were only up slightly.
The only reason initiated foreclosures declined slightly was because Q1 was revised up significantly. Short sales remain mostly irrelevant.
The next wave of completed foreclosures is about to break, but the size of the wave depends on the modification programs.
Chicago Purchasing Managers Index Declines in September
by Calculated Risk on 9/30/2009 09:54:00 AM
From MarketWatch: Business activity declines in Chicago area
The Chicago purchasing managers index fell to 46.1% in September from 50.0% in August ... The new orders index backtracked to 46.3% from 52.5% in August. The employment index was essentially unchanged at 38.8% ...Readings below 50% indicate contraction.
This index is for both manufacturing and service activity in the Chicago region. In general the Chicago area is considered representative of the mix of manufacturing and non-manufacturing business activity in the nation, so a decline in the Chicago PMI is significant.
The national ISM manufacturing index will be released tomorrow, and the ISM non-manufacturing index on Monday.
MBA: 30 Year Mortgage Rate Falls to 4.94 Percent
by Calculated Risk on 9/30/2009 08:42:00 AM
The MBA reports: Mortgage Applications Decrease
The Market Composite Index, a measure of mortgage loan application volume, decreased 2.8 percent on a seasonally adjusted basis from one week earlier. ...
The Refinance Index decreased 0.8 percent from the previous week and the seasonally adjusted Purchase Index decreased 6.2 percent from one week earlier.
...
The average contract interest rate for 30-year fixed-rate mortgages decreased to 4.94 percent from 4.97 percent ...
 Click on graph for larger image in new window.
This graph shows the MBA Purchase Index and four week moving average since 2002.
The Purchase index declined to 270.4, and the 4-week moving average declined to 283.9.
Note: The increase in 2007 was due to the method used to construct the index: a combination of lender failures, and borrowers filing multiple applications pushed up the index in 2007, even though activity was actually declining.
Tuesday, September 29, 2009
Survey: Home Purchase Market by Homebuyer Category
by Calculated Risk on 9/29/2009 11:20:00 PM
Here is some national data on the types of homebuyers in August. This is from a survey by Campbell Communications (excerpted with permission).
Source: Tracking Real Estate Market Conditions, a whitepaper regarding the Campbell/Inside Mortgage Finance Monthly Survey on Real Estate Market Conditions. Click on graph for larger image in new window.
The Campbell survey breaks out sales by buyer type.
According to the Campbell survey about 64% of sales in August were to first-time buyers and investors.
Survey results show that first-time homebuyers, motivated by first-time homebuyer tax credit, made up the largest component of demand in August 2009. In the summer months, current homeowners also make up a significant component of demand. (Note: rounding on graph figures precludes totaling to 100%.)
 For comparison, here is the same breakdown for Q2.
According to the Campbell survey over 70% of sales in Q2 were to first-time buyers and investors.
Whenever the tax credit expires (whether or not is extended), the percent of first time buyers will decline.
Report: CIT Preparing Plan to Hand Control to Bondholders
by Calculated Risk on 9/29/2009 07:46:00 PM
From the WSJ: CIT in Last-Ditch Rescue Bid
CIT is preparing a sweeping exchange offer that would eliminate 30% to 40% of its more than $30 billion in outstanding debt ... The plan would offer bondholders new debt secured by CIT assets, as well as nearly all of the equity in a restructured company. ... If not enough bondholders agreed to the plan, the company could seek to execute the restructuring in bankruptcy court, the person said. The result could potentially be one of the largest Chapter 11 bankruptcy-court filings in U.S. history.The writing was on the wall in July when CIT obtained a $3 billion emergency loan secured by all of their assets. As I noted in July, the emergency loan just kicked the can down the road.
Now it appears CIT is at the end of the road ...
Citi Still Using FDIC TLGP
by Calculated Risk on 9/29/2009 07:26:00 PM
From Dow Jones: Citi Prices $5B Four-Part FDIC-Backed Deal-Source
Citigroup Inc. priced a $5 billion government-backed bond Tuesday, its second benchmark-sized bond offering this month under the U.S. Federal Deposit Insurance Corp.'s Temporary Liquidity Guarantee Program ... Since November of last year, when the FDIC program was launched, Citi has issued $49.6 billion of these deals ...If the TLGP is extended, Citi might be the only user.
Also, the FDIC earlier today announced a plan to "require insured institutions to prepay their estimated quarterly risk-based assessments" for the next three years. This plan would raise approximately $45 billion.
Bloomberg has a story on the costs: Bank of America, 3 Other Banks’ FDIC Fees May Top $10 Billion
Bank of America, the biggest U.S. lender by deposits, may owe $3.5 billion under the FDIC proposal for banks to prepay three years of premiums, based on the lowest assessment rate multiplied by the bank’s $900 billion in second-quarter U.S. deposits.Ouch.
...
U.S. bank premiums range from 12 cents per $100 in deposits for the safest lenders to 45 cents for banks the U.S. considers risky, said Chris Cole, senior regulatory counsel for the Independent Community Bankers of America.
...
Based on the current assessment and each bank’s deposits, Wells Fargo & Co.’s fee may be $3.2 billion based on its $814 billion in deposits, JPMorgan Chase & Co. may pay $2.4 billion and Citigroup Inc. $1.2 billion.


