 RSS Feed
 by Calculated Risk on 12/09/2012 04:08:00 PM
Sunday, December 09, 2012
Labor Force Participation Rate Update
I've written extensively about the participation rate, see: Understanding the Decline in the Participation Rate and Further Discussion on Labor Force Participation Rate.
A key point: The recent decline in the participation rate was expected, and most of the decline in the participation rate was due to changing demographics, as opposed to economic weakness.
Here is an update to a few graphs I've posted before. Tracking the participation rate for various age groups monthly is a little like watching grass grow, but the trends are important.
 Click on graph for larger image in graph gallery.
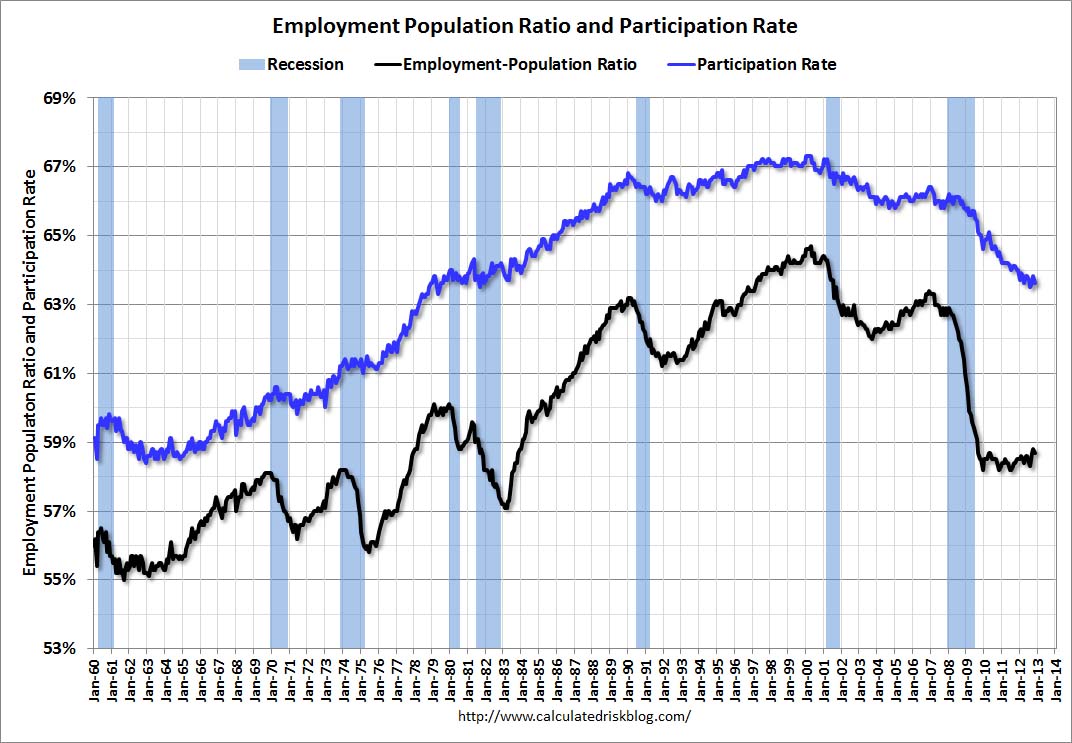
Here is a repeat of the graph I posted Friday showing the participation rate and employment-to-population ratio.
The Labor Force Participation Rate decreased to 63.6% in November (blue line. This is the percentage of the working age population in the labor force.
Here is a look at some of the long term trends (updating graphs through November 2012):
 This graph shows the changes in the participation rates for men and women since 1960 (in the 25 to 54 age group - the prime working years).
The participation rate for women increased significantly from the mid 30s to the mid 70s and has mostly flattened out. The participation rate for women was unchanged in November at 74.7%.
The participation rate for men decreased from the high 90s decades ago, to 88.2% in November 2012.
This is the lowest level recorded for prime working age men.
 This graph shows that participation rates for several key age groups.
There are a few key long term trends:
• The participation rate for the '16 to 19' age group has been falling for some time (red). This was unchanged in November at 34.7%, up from the record low of 33.5% in February 2011.
• The participation rate for the 'over 55' age group has been rising since the mid '90s (purple), although this has stalled out a little recently.
• The participation rate for the '20 to 24' age group fell recently too (more education before joining the labor force). This appears to have stabilized.
 The third graph shows the participation rate for several over 55 age groups. The red line is the '55 and over' total seasonally adjusted. All of the other age groups are Not Seasonally Adjusted (NSA).
The participation rate is generally trending up for all older age groups, and the 55 and over participation rate is at a record high.
The increase in participation of older cohorts might push up the '55 and over' participation rate over the next few years, however eventually the 'over 55' participation rate will start to decline as the oldest baby boomers move into even older age groups.
I've been expecting some small bounce back in the participation rate, but I don't think the bounce back will be huge - and that means it is taking fewer jobs than some expected to lower the unemployment rate. This will be a key number to watch over the next few years.
Earlier on employment:
• November Employment Report: 146,000 Jobs, 7.7% Unemployment Rate
• Employment Report: More Positives than Negatives
• All Employment Graphs
FOMC Projections Preview
by Calculated Risk on 12/09/2012 10:15:00 AM
There are two key topics for the FOMC meeting this week: 1) What action to take when Operation Twist concludes at the end of year, and 2) whether or not to adopt a threshold rule for the Feds Fund Rate based on inflation and unemployment, and remove the forward guidance sentence from the statement.
My expectation is the FOMC will announce additional security purchases starting in January after the conclusion of Operation Twist. This will probably be announced this week and will be funded with reserve creation that will expand the Fed balance sheet. Note: Operation Twist didn't increase the Fed's balance sheet, but changed the composition of their securities holdings by selling short-term Treasury securities and buying longer-term Treasury securities.
The key questions are: the size of the additional purchases (some FOMC members have argued for $45 billion per month), the composition and maturity of the assets (Treasuries and MBS), and how long the purchases will continue (along with QE3). Goldman Sachs estimates:
"Looking further ahead, based on our economic forecasts the Fed may purchase up to $2 trillion in Treasury securities and MBS under QE3, before the first fed funds rate hike in early 2016."On thresholds: Currently the Fed has been including projections of when participants think the first rate increase will happen, and the FOMC statement includes the sentence: "[the FOMC] currently anticipates that exceptionally low levels for the federal funds rate are likely to be warranted at least through mid-2015". The could be replaced with general rules based on the unemployment rate and inflation.
Here are a couple of excerpts from the FOMC minutes for the October meeting:
Participants generally favored the use of economic variables, in place of or in conjunction with a calendar date, in the Committee's forward guidance, but they offered different views on whether quantitative or qualitative thresholds would be most effective. Many participants were of the view that adopting quantitative thresholds could, under the right conditions, help the Committee more clearly communicate its thinking about how the likely timing of an eventual increase in the federal funds rate would shift in response to unanticipated changes in economic conditions and the outlook.So the FOMC is leaning towards changing to thresholds, but it appears there is more work to do. This communication change could happen at the meeting this week, but my feeling is the FOMC will wait until early 2013.
...
Participants generally agreed that the Committee would need to resolve a number of practical issues before deciding whether to adopt quantitative thresholds to communicate its thinking about the timing of the initial increase in the federal funds rate. These issues included whether to specify such thresholds in terms of realized or projected values of inflation and the unemployment rate and, in either case, what values for those thresholds would best balance the Committee's objectives of promoting maximum employment and price stability. Another open question was whether to supplement thresholds expressed in terms of the unemployment rate and inflation with additional indicators of economic and financial conditions that might signal a need either to raise the federal funds rate before a threshold is crossed or to delay until well afterward.
emphasis added
In advance of the meeting, here is a look back at the previous projections from the September meeting.
 Click on graph for larger image.
The first two charts are when participants project the initial increase in the target federal funds rate should occur, and the participants view of the appropriate path of the federal funds rate.
"The shaded bars represent the number of FOMC participants who project that the initial increase in the target federal funds rate (from its current range of 0 to ¼ percent) would appropriately occur in the specified calendar year."
If the FOMC moves to thresholds, this graph might be removed. However I expect the FOMC to wait until next year for thresholds, and the key will be to see if the views have shifted for when the first rate hike will occur.
 "The dots represent individual policymakers’ projections of the appropriate federal funds rate target at the end of each of the next several years and in the longer run. Each dot in that chart represents one policymaker’s projection."
Most participants still think the Fed Funds rate will be in the current range through 2014.
On the projections, it looks like GDP and inflation will be close to the September FOMC projections. However the unemployment rate will be lower than projected. The key will be to look for changes in the 2013 and 2014 forecasts.
| GDP projections of Federal Reserve Governors and Reserve Bank presidents | |||
|---|---|---|---|
| Change in Real GDP1 | 2012 | 2013 | 2014 |
| Sept 2012 Projections | 1.7 to 2.0 | 2.5 to 3.0 | 3.0 to 3.8 |
Fiscal policy uncertainty makes it even more difficult to forecast GDP for 2013, but I expect the FOMC will revise down their 2013 forecasts.
The unemployment rate was at 7.9% in October and 7.7% in November (average of 7.8%). This is below the September projections, and suggests the unemployment rate projections for 2013 and 2014 will be revised down.
| Unemployment projections of Federal Reserve Governors and Reserve Bank presidents | |||
|---|---|---|---|
| Unemployment Rate2 | 2012 | 2013 | 2014 |
| Sept 2012 Projections | 8.0 to 8.2 | 7.6 to 7.9 | 6.7 to 7.3 |
Both measures of inflation will be close to the September projections, and I expect the forecasts for inflation will show the FOMC is still not concerned about inflation going forward.
| Inflation projections of Federal Reserve Governors and Reserve Bank presidents | |||
|---|---|---|---|
| PCE Inflation1 | 2012 | 2013 | 2014 |
| Sept 2012 Projections | 1.7 to 1.8 | 1.6 to 2.0 | 1.6 to 2.0 |
Here is core inflation:
| Core Inflation projections of Federal Reserve Governors and Reserve Bank presidents | |||
|---|---|---|---|
| Core Inflation1 | 2012 | 2013 | 2014 |
| Sept 2012 Projections | 1.7 to 1.9 | 1.7 to 2.0 | 1.8 to 2.0 |
Conclusion: I expect the FOMC to announce additional asset purchases at the meeting this week (to start at the conclusion of Operation Twist). It seems the FOMC will move to thresholds, but probably not until next year. On projections, I expect GDP to be revised down for 2013, and the unemployment rate to be revised lower for 2013 and 2014.
Saturday, December 08, 2012
Unofficial Problem Bank list declines to 849 Institutions
by Calculated Risk on 12/08/2012 07:05:00 PM
The first unofficial problem bank list was published in August 2009 with 389 institutions. The number of unofficial problem banks grew steadily and peaked at 1,002 institutions on June 10, 2011. The list has been declining since then.
This is an unofficial list of Problem Banks compiled only from public sources.
Here is the unofficial problem bank list for Dec 7, 2012.
Changes and comments from surferdude808:
Nothing to report this week than removals to the Unofficial Problem Bank List. Seven institutions were removed, which leaves the list at 849 institutions with assets of $316.2 billion. From last week, assets dropped by $10.2 billion, but $4.9 billion of the decline came from balance sheet shrinkage during the third quarter. A year ago, the list held 977 institutions with assets of $399.5 billion.Earlier:
The Federal Reserve terminated actions against Hanmi Bank, Los Angeles, CA ($2.8 billion Ticker: HAFC) and Anadarko Bank and Trust Company, Anadarko, OK ($67 million).
The following institutions were removed through voluntary merger -- Southern Community Bank and Trust, Winston Salem, NC ($1.4 billion); South Valley Bank & Trust, Klamath Falls, OR ($836 million); Flatbush Federal Savings and Loan Association, Brooklyn, NY ($137 million Ticker: FLTB); Bank 1st, Albuquerque, NM ($61 million); and Lone Summit Bank, Lake Lotawana, MO ($21 million).
Next week's activity likely will be mostly removals as the OCC probably will wait until the 17th to publish its actions through November.
• Summary for Week Ending Dec 7th
• Schedule for Week of Dec 9th
Hotel Occupancy Rate above pre-recession levels at end of November
by Calculated Risk on 12/08/2012 03:40:00 PM
From HotelNewsNow.com: STR: US results for week ending 1 December
In year-over-year comparisons, occupancy was up 2.5 percent to 52.2 percent, average daily rate rose 3.5 percent to US$103.00 and revenue per available room increased 6.2 percent to US$53.74.The 4-week average is above the pre-recession levels (the 4-week average is at 56.0% - for the same week in 2007, the 4-week average was at 54.8%).
Note: ADR: Average Daily Rate, RevPAR: Revenue per Available Room.
The following graph shows the seasonal pattern for the hotel occupancy rate using a four week average.
 Click on graph for larger image.
The red line is for 2012, yellow is for 2011, blue is "normal" and black is for 2009 - the worst year since the Great Depression for hotels.
The occupancy rate will continue to decline over the next month as business travel slows for the holidays. The next key period is for spring business travel.
Data Source: Smith Travel Research, Courtesy of HotelNewsNow.com
Earlier:
• Summary for Week Ending Dec 7th
• Schedule for Week of Dec 9th
Schedule for Week of Dec 9th
by Calculated Risk on 12/08/2012 01:11:00 PM
Earlier:
• Summary for Week Ending Dec 7th
The key event this week is the two day FOMC meeting on Tuesday and Wednesday. With the coming conclusion of Operation Twist, there is a very strong possibility that the Fed will announce additional accommodation.
The key reports for this week will be the October trade balance report on Tuesday, the November retail sales report on Thursday, Industrial Production on Friday, and November CPI also on Friday.
No economic releases scheduled.
7:30 AM ET: NFIB Small Business Optimism Index for November. The consensus is for a decrease to 92.5 from 93.1 in October.
 8:30 AM: Trade Balance report for October from the Census Bureau.
 This graph is through September. Both exports and imports increased in September, and exports were at a new high.
The consensus is for the U.S. trade deficit to increase to $42.8 billion in October, up from from $41.5 billion in September. Export activity to Europe will be closely watched due to economic weakness. Note: the strike at the ports of Long Beach and Los Angeles started in late November, and this report is for October.
 10:00 AM: Job Openings and Labor Turnover Survey for October from the BLS.
 This graph shows job openings (yellow line), hires (purple), Layoff, Discharges and other (red column), and Quits (light blue column) from the JOLTS.
Jobs openings decreased in September to 3.561 million, down slightly from 3.661 million in August. The number of job openings (yellow) has generally been trending up, and openings are only up about 2% year-over-year compared to September 2011.
10:00 AM: Monthly Wholesale Trade: Sales and Inventories for October. The consensus is for a 0.4% increase in inventories.
7:00 AM: The Mortgage Bankers Association (MBA) will release the mortgage purchase applications index.
8:30 AM: Import and Export Prices for November. The consensus is a 0.4% decrease in import prices.
12:30 PM: FOMC Meeting Announcement. With Operation Twist ending in a few weeks, the FOMC will probably announce additional policy accommodation that will start in January.
2:00 PM: FOMC Forecasts The will include the Federal Open Market Committee (FOMC) participants' projections of the appropriate target federal funds rate along with the quarterly economic projections.
2:15 PM: Fed Chairman Ben Bernanke holds a press briefing following the FOMC announcement.
8:30 AM: The initial weekly unemployment claims report will be released. The consensus is for claims to be unchanged at 370 thousand.
8:30 AM: Producer Price Index for November. The consensus is for a 0.5% decrease in producer prices (0.2% increase in core).
 8:30 AM ET: Retail sales for November will be released. October retail sales (especially auto sales) were impacted by Hurricane Sandy, and auto sales bounced back in November.
This graph shows retail sales since 1992. This is monthly retail sales and food service, seasonally adjusted (total and ex-gasoline). Retail sales are up 24.2% from the bottom, and now 8.6% above the pre-recession peak (not inflation adjusted)
The consensus is for retail sales to increase 0.6% in November, and to be unchanged ex-autos.
8:30 AM: Consumer Price Index for November. The consensus is for CPI to decrease 0.2% in November and for core CPI to increase 0.2%.
 9:15 AM: The Fed will release Industrial Production and Capacity Utilization for November.
This shows industrial production since 1967.
The consensus is for a 0.3% increase in Industrial Production in November, and for Capacity Utilization to increase to 78.0%.


