 RSS Feed
 by Calculated Risk on 7/15/2011 01:13:00 PM
Friday, July 15, 2011
Key Measures of Inflation ease in June
This week Fed Chairman Bernanke reiterated the Fed's position that further easing (i.e. QE3) would require both persistent economic weakness and a greater risk of deflation. From Bernanke's testimony:
[T]he possibility remains that the recent economic weakness may prove more persistent than expected and that deflationary risks might reemerge, implying a need for additional policy support.One thing to watch will be the following key measures.
Earlier today the BLS reported:
The Consumer Price Index for All Urban Consumers (CPI-U) decreased 0.2 percent in June on a seasonally adjusted basis, the U.S. Bureau of Labor Statistics reported today. ... The gasoline index declined sharply in June, falling 6.8 percent. ... In contrast, the index for all items less food and energy increased 0.3 percent for the second consecutive month.The Cleveland Fed released the median CPI and the trimmed-mean CPI this morning:
According to the Federal Reserve Bank of Cleveland, the median Consumer Price Index rose 0.1% (1.7% annualized rate) in June. The 16% trimmed-mean Consumer Price Index increased 0.1% (1.7% annualized rate) during the month.Note: The Cleveland Fed has a discussion of a number of measures of inflation: Measuring Inflation. You can see the median CPI details for June here.
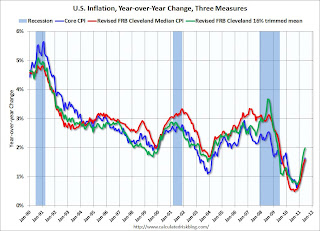
Over the last 12 months, the median CPI rose 1.6%, the trimmed-mean CPI rose 2.0%, the CPI rose 3.6%, and the CPI less food and energy rose 1.6%.
 Click on graph for larger image in graph gallery.
On a year-over-year basis, these measures of inflation are increasing, but still mostly below the Fed's target. The trimmed-mean is at 2.0% year-over-year; at the Fed's target.
On a monthly basis, the median Consumer Price Index increased 1.7% at an annualized rate, down from 2.1% annualized in May. The 16% trimmed-mean Consumer Price Index also increased 1.7% annualized in June, down from 2.8% annualized in May. And core CPI increased 3.1% annualized, down from 3.5% annualized in May.
With the slack in the system, the year-over-year measures will probably stay near or be below 2% this year.
Earlier:
• From the NY Fed: Empire State Manufacturing Survey indicates conditions deteriorated in July
• Consumer Sentiment declines sharply in July
• Industrial Production increased 0.2% in June, Capacity Utilization unchanged
• Eight Banks Fail European Stress Tests
Eight Banks Fail European Stress Tests
by Calculated Risk on 7/15/2011 12:20:00 PM
Here is the page for the European Banking Authority (EBA)
EBA Press release (pdf)
Stress Test Summary report (pdf)
From the WSJ: 8 Banks Fail EU 'Stress Tests'
Eight banks flunked the European Union's "stress tests," with a combined shortfall of €2.5 billion ($3.54 billion) in capital under a simulated worst-case economic scenario, the European Banking Authority said.Only €2.5 billion in capital needed? And the banks are reported to hold an aggregate €1.1 trillion euros in government debt from Greece, Ireland, Portugal and Spain? I think investors will remain skeptical.
The EU regulator said Friday that another 16 banks narrowly passed the tests, which examined the abilities of 90 top lenders across Europe to endure a deteriorating economy and strained financial system.
By awarding a relatively clean bill of health to the vast majority of Europe's banking industry, the tests are likely to be greeted with skepticism.
Consumer Sentiment declines sharply in July
by Calculated Risk on 7/15/2011 09:55:00 AM
The preliminary July Reuters / University of Michigan consumer sentiment index declined sharply to 63.8 from 71.5 in June.

Click on graph for larger image in graphic gallery.
In general consumer sentiment is a coincident indicator and is usually impacted by employment (and the unemployment rate) and gasoline prices. However, even with lower gasoline prices, consumer sentiment declined sharply - possible because of the heavy coverage of the debt ceiling charade.
This was well below the consensus forecast of 71.0 and definitely in the recession range.
Industrial Production increased 0.2% in June, Capacity Utilization unchanged
by Calculated Risk on 7/15/2011 09:15:00 AM
From the Fed: Industrial production and Capacity Utilization
Industrial production increased 0.2 percent in June after having edged down 0.1 percent in May. For the second quarter as a whole, total industrial production increased at an annual rate of 0.8 percent. Manufacturing output was unchanged in June. In the second quarter, supply chain disruptions following the earthquake in Japan curtailed the production of motor vehicles and parts and restrained output in related industries; the production index for overall manufacturing was little changed for the quarter. The output of mines rose 0.5 percent in June, while the output of utilities climbed 0.9 percent. At 93.1 percent of its 2007 average, total industrial production in June was 3.4 percent above its year-earlier level. The capacity utilization rate for total industry remained unchanged at 76.7 percent in June, a rate 2.2 percentage points above the rate from a year earlier but 3.7 percentage points below its average from 1972 to 2010.
 Click on graph for larger image in graph gallery.
This graph shows Capacity Utilization. This series is up 9.4 percentage points from the record low set in June 2009 (the series starts in 1967).
Capacity utilization at 76.7% is still "3.7 percentage points below its average from 1972 to 2010" - and below the pre-recession levels of 81.2% in November 2007.
Note: y-axis doesn't start at zero to better show the change.
 The second graph shows industrial production since 1967.
Industrial production increased in June to 93.1.
Both industrial production and capacity utilization have been moving sideways recently. This was below the consensus forecast of a 0.4% increase in Industrial Production in June, and an increase to 76.9% for Capacity Utilization.
There is still significant excess capacity.
Empire State Survey indicates contraction, Core CPI increases 0.3 percent
by Calculated Risk on 7/15/2011 08:30:00 AM
• From the NY Fed: Empire State Manufacturing Survey
The July Empire State Manufacturing Survey indicates that conditions for New York manufacturers deteriorated for a second consecutive month. The general business conditions index remained below zero, at -3.8.The index increased from -7.8 in June, but was well below expectations of a reading of 8.0. This is the first regional survey released for July and shows that manufacturing in the NY region is still contracting.
The new orders index also remained negative, while the shipments index increased to a level slightly above zero. The indexes for both prices paid and prices received were positive but lower than last month, suggesting that price increases slowed. The index for number of employees fell to a level near zero, indicating that employment levels held steady, while the average workweek index dropped well into negative territory. Future indexes bounced up after declining steeply in June—a sign that conditions were generally expected to improve over the next six months—but the level of optimism was well below the levels observed earlier this year.
• From the BLS:
The Consumer Price Index for All Urban Consumers (CPI-U) decreased 0.2 percent in June on a seasonally adjusted basis, the U.S. Bureau of Labor Statistics reported today. ... The gasoline index declined sharply in June, falling 6.8 percent. ... In contrast, the index for all items less food and energy increased 0.3 percent for the second consecutive month.Headline CPI declined because of the sharp decline in gasoline prices, but the core index increased 0.3 percent and is now up 1.6 percent over the last year. I'll have more on inflation later.


