 RSS Feed
 by Calculated Risk on 11/01/2010 10:53:00 AM
Monday, November 01, 2010
Private Construction Spending Flat in September: July and August Revised Down
The Census Bureau reported overall construction spending increased in September compared to August.
[C]onstruction spending during September 2010 was estimated at a seasonally adjusted annual rate of $801.7 billion, 0.5 percent (±1.9%)* above the revised August estimate of $797.5 billion.However private construction spending was about the same as the downwardly revised August rate:
Spending on private construction was at a seasonally adjusted annual rate of $482.0 billion, nearly the same as (±1.1%)* the revised August estimate of $481.9 billion. [revised down from $498.2 billion]
 Click on graph for larger image in new window.
This graph shows private residential and nonresidential construction spending since 1993. Note: nominal dollars, not inflation adjusted.
Residential spending is 65.7% below the peak early 2006, and non-residential spending is 39.5% from the peak in January 2008.
The downward revisions to construction spending in July and August were significant.
These downward revisions will negatively impact Q3 GDP for both residential investment, and non-residential investment in structures.
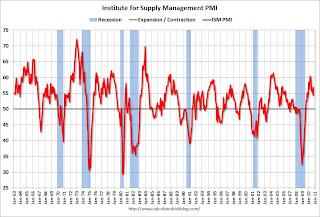
ISM Manufacturing Index increases to 56.9 in October
by Calculated Risk on 11/01/2010 10:00:00 AM
PMI at 56.9% in October, up from 54.4% in September. The consensus was for an increase to 54.5%.
From the Institute for Supply Management: October 2010 Manufacturing ISM Report On Business®
The report was issued today by Norbert J. Ore, CPSM, C.P.M., chair of the Institute for Supply Management™ Manufacturing Business Survey Committee. "The manufacturing sector grew during October, with both new orders and production making significant gains. Since hitting a peak in April, the trend for manufacturing has been toward slower growth. However, this month's report signals a continuation of the recovery that began 15 months ago, and its strength raises expectations for growth in the balance of the quarter. Survey respondents note the recovery in autos, computers and exports as key drivers of this growth. Concerns about inventory growth are lessened by the improvement in new orders during October. With 14 of 18 industries reporting growth in October, manufacturing continues to outperform the other sectors of the economy."
 Click on graph for larger image in new window.
Here is a long term graph of the ISM manufacturing index.
In addition to the increase in the PMI, the ISM's new orders index was up sharply to 58.9 from 51.1 in September.
The employment index increased to 57.7 from 56.5 in September.
And the inventory index declined to 53.9 from 55.6, but this was the 4th month in a row of increasing inventories.
The internals were stronger this month. It was just last month that Ore cautioned that the new orders and inventory indexes were "sending strong negative signals of weakening performance in the [manufacturing] sector".
The increase in the ISM index was in line with the increases in the regional Fed manufacturing surveys.
Personal income declines 0.1%, Spending increases 0.2% in September
by Calculated Risk on 11/01/2010 08:30:00 AM
From the BEA: Personal Income and Outlays, June 2010
Personal income decreased $16.8 billion, or 0.1 percent, and disposable personal income (DPI) decreased $20.3 billion, or 0.2 percent, in September ... Personal consumption expenditures (PCE) increased $17.3 billion, or 0.2 percent.
...
Real PCE -- PCE adjusted to remove price changes -- increased 0.1 percent in September, compared with an increase of 0.3 percent in August.
...
Personal saving as a percentage of disposable personal income was 5.3 percent in September, compared with 5.6 percent in August.
 Click on graph for large image.
This graph shows real personal income less transfer payments since 1969.
This measure of economic activity is moving sideways - similar to what happened following the 2001 recession.
This month the saving rate decreased ...
 This graph shows the saving rate starting in 1959 (using a three month trailing average for smoothing) through the Setpember Personal Income report.
 In September, income declined 0.1%, and spending increased 0.2% - so the saving rate decreased to 5.3% in September (5.5% using a three month average).
I expect the saving rate to rise some more over the next year, perhaps to 8% or so - keeping the pace of PCE growth below income growth.
Sunday, October 31, 2010
Two Extremes: Paying on Underwater Mortgages, and Living in Default
by Calculated Risk on 10/31/2010 09:22:00 PM
Earlier posts:
The following articles illustrate two extremes we've discussed before. The first is about borrowers with significant negative equity who are still paying their mortgage. They can't refinance. They can't sell. And it is difficult to move for new employment. This is probably a drag on economic growth.
And at the other extreme are borrowers staying in their homes for extended periods without paying their mortgage or property taxes. This might be providing some "stealth stimulus" for the economy. Note: Some people call this the "squatter stimulus", but I think that term is demeaning since many of these people are facing serious financial problems and living with uncertainty.
From Don Lee at the LA Times: Millions of homeowners keep paying on underwater mortgages
Of the estimated 15 million homeowners underwater, about 7.8 million owed at least 25% more than their properties were worth in the first quarter of this year ... More than 4 million borrowers ... were underwater more than 50%.The borrowers with negative equity are still receiving the same housing service, and making the same payment, as a few years ago. In that sense it isn't a drag on the economy. However they can't take advantage of low rates to refinance, they can't sell, it is difficult to move, and they are frequently reluctant to invest in home improvements - and they might even forgo needed repairs. And there is probably a negative wealth effect impacting their overall consumption.
... They still have jobs and can afford to make the payments. ... But they can't refinance because they owe too much.
And from Mark Whitehouse at the WSJ: The Stealth Stimulus of Defaulters Living for Free
Defaulters living in their homes are getting a subsidy worth about $2.6 billion a month, according to a Wall Street Journal analysis based on mortgage data from LPS Applied Analytics and rent data from the Commerce Department.For the borrowers in default, many are probably unemployed or facing other serious financial issues. If they weren’t living “rent free”, they’d probably move in with friends or relatives, or even live in their cars or worse. So the "free" housing service they are currently receiving will probably be replaced with another low cost housing alternative. And if even if they move into an apartment, they will probably still be spending the same amount (just on different items). So for many people in this situation, I don't think there is really much "stealth stimulus".
Music: Quantitative Easin'
by Calculated Risk on 10/31/2010 05:45:00 PM
Earlier posts:
For your enjoyment, from singer Curtis Threadneedle (in the style of Barry White), a song co-written by Curtis Threadneedle and Merle Hazard, and produced by Merle Hazard.


