 RSS Feed
 by Calculated Risk on 9/28/2010 04:22:00 PM
Tuesday, September 28, 2010
Meredith Whitney on state budget crisis
From Jeff Cox at CNBC: States Are Poised to Be Next Credit Crisis for US: Whitney
"The similarities between the states and the banks are extreme to the extent that states have been spending dramatically and are leveraged dramatically," [Meredith Whitney] said. "Municipal debt has doubled since 2000, spending has grown way faster than revenues."Many states have serious budget and debt issues, but I doubt it will result in a "near-trillion-dollar bailout" (note that Whitney is saying an "attempt" at a bailout). More likely the states will raise some taxes and cut more services - and this will be a drag on growth for some time.
...
"You have to look at the states and the risk that the states pose, because the crisis with the states will result in an attempt at least for the third near-trillion-dollar bailout."
...
[On banks] "We think October, after the banks report, you'll see a really ugly Case-Shiller number, which means the fourth quarter is going to be very tough for banks."
I think Whitney is correct on the timing of the Case-Shiller numbers, but I don't think the numbers will be anywhere near as "ugly" as earlier price declines.
Misc: Case-Shiller, Manufacturing Surveys, QE2 and Europe
by Calculated Risk on 9/28/2010 12:26:00 PM
The headlines on Case-Shiller seemed contradictory this morning. Here are a few examples:
From the Financial Times: US home prices slip in July
From the WSJ: Home Prices Rose in July
From CNBC: US Home Prices Slipped In July And May Stabilize Near Lows
From MarketWatch: Home price growth slows in July
From HousingWire: S&P/Case-Shiller 20-city composite index rose 0.6% for July
The reason for the confusion is S&P Case-Shiller reports both seasonally adjusted (SA), and not seasonally adjusted (NSA) data. Because of concerns about the impact of foreclosures and government programs on prices, S&P switched to reporting NSA numbers in their press release, but many analysts are still using the SA numbers (I reported the SA numbers - see this post for the SA graphs from earlier this morning).
The important points are:
1) this is a three month average of May, June, and July. Seasonally this is the strongest time of the year for house prices.
2) sales collapsed in July, so the next report (for June, July and August) will probably show falling prices.
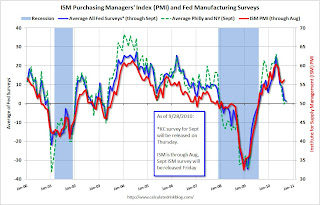
Here is an update to the graph comparing the regional Fed surveys with the ISM manufacturing survey, including the Richmond survey released this morning (Kansas City will be released Thursday):
 Click on graph for larger image in new window.
For this graph I averaged the New York and Philly Fed surveys (dashed green, through September), and averaged five surveys including New York, Philly, Richmond, Dallas and Kansas City (blue, through September - KC through August).
The Institute for Supply Management (ISM) PMI (red) is through August (right axis).
Last month, when the ISM survey came in slightly better than expected, I wrote: "Based on this graph, I'd expect either the Fed surveys to bounce back in September - or the ISM to decline." So far there has been little "bounce back" in the Fed surveys - so I expect a decline in the ISM survey.
The consensus is for a decline in ISM Manufacturing Index to 54.5 in September from 56.3 in August.
There was a very important article from Jon Hilsenrath at the WSJ yesterday: Fed Weighs New Tactics to Bolster Recovery (note: many people think that Hilsenrath has taken over Greg Ip's role (now at the Economist) and leaks to Hilsenrath might be part of the Fed's communication strategy).
I reviewed the article here, but the key points are the Fed is debating between announcing "massive bond purchases with a finite end" and a "smaller-scale program that they could adjust" over time. Based on the article, it appears the Fed is leaning towards the latter (small-scale program).
Although QE2 isn't a done deal, the odds are very high that the next round will be announced on November 3rd at 2:15 PM ET.
The crisis is not over in Europe.
From Reuters: Ireland Faces Threat of New Downgrades
Two more credit rating agencies warned Ireland on Tuesday that its debt was at risk of being downgraded further, setting off another leap in borrowing costs and heaping pressure on the government to accelerate the planned late-October release of a budget preview.The Ireland and Portugal to Germany bond spreads have hit new highs again today.
Richmond Fed: Regional manufacturing activity contracted after seven months of expansion
by Calculated Risk on 9/28/2010 10:00:00 AM
Note: Usually I don't post all the regional manufacturing surveys, however with the inventory adjustment over, export growth slowing, and domestic consumer demand sluggish, these surveys provide an early look at weakness in the manufacturing sector.
From the Richmond Fed: Manufacturing Activity Pulled Back in September, But Expectations Upbeat
Manufacturing activity in the central Atlantic region pulled back in September after expanding during the previous seven months, according to the Richmond Fed's latest survey. The index of overall activity was pushed lower as shipments and employment edged into negative territory. Other indicators also suggested softer activity. District contacts reported that the volume of new orders flattened, order backlogs turned negative, and delivery times held steady. Furthermore, manufacturers reported growth in capacity utilization flat lined, while inventories grew at a slightly quicker pace.This is further evidence of the slowdown in manufacturing.
...
In September, the seasonally adjusted composite index of manufacturing activity — our broadest measure of manufacturing — turned negative, losing thirteen points to −2 from August's reading of 11. Among the index's components, shipments fell fifteen points to −4, new orders lost ten points to finish at 0, and the jobs index declined fifteen points to −3.
Other indicators also suggested weaker activity. The backlogs of orders measure turned negative losing eleven points to −11, and the index for capacity utilization flattened declining fourteen points to 0. The delivery times index held steady at 8, while our gauges for inventories were somewhat higher in September.
...
Labor market activity also weakened in September. The manufacturing employment index registered a −3 versus August's reading of 12, and the average workweek measure lost fourteen points to 0. In addition, wage growth posted a five-point loss to 8.
Also, from CNBC: Consumer Confidence Falls to Lowest Level Since February
The Conference Board, an industry group, said its index of consumer attitudes fell to 48.5 in September from a revised 53.2 in August.
Case-Shiller: "Home Prices Stable in July"
by Calculated Risk on 9/28/2010 09:00:00 AM
S&P/Case-Shiller released the monthly Home Price Indices for July (actually a 3 month average of May, June and July).
This includes prices for 20 individual cities, and two composite indices (10 cities and 20 cities).
Note: Case-Shiller reports NSA, I use the SA data.
From S&P: Home Prices Remain Stable Around Recent Lows According to the S&P/Case-Shiller Home Price Indices
Data through July 2010, released today by Standard & Poor’s for its S&P/Case-Shiller Home Price Indices, the leading measure of U.S. home prices, show that the annual growth rates in 16 of the 20 MSAs and the 10- and 20-City Composites slowed in July compared to June 2010. The 10-City Composite is up 4.1% and the 20-City Composite is up 3.2% from where they were in July 2009. For June they were reported as +5.0% and +4.2%, respectively. Although home prices increased in most markets in July versus June, 15 MSAs and both Composites saw these monthly rates moderate in July.
 Click on graph for larger image in new window.
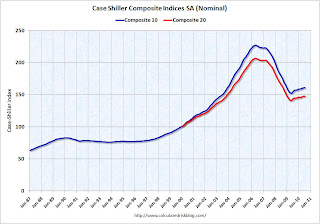
 The first graph shows the nominal seasonally adjusted Composite 10 and Composite 20 indices (the Composite 20 was started in January 2000).
The Composite 10 index is off 29.0% from the peak, and flat in July (SA).
The Composite 20 index is off 28.6% from the peak, and down 0.1% in July (SA).
 The second graph shows the Year over year change in both indices.
The Composite 10 is up 4.0% compared to July 2009.
The Composite 20 is up 3.1% compared to July 2009.
The year-over-year changes appear to be rolling over - and will probably be negative later this year.
The third graph shows the price declines from the peak for each city included in S&P/Case-Shiller indices.
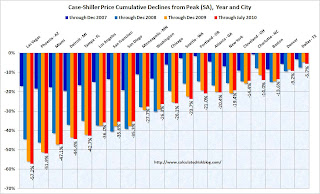 Prices increased (SA) in only 4 of the 20 Case-Shiller cities in July seasonally adjusted.
Prices in Las Vegas are off 57.2% from the peak, and prices in Dallas only off 5.7% from the peak.
Prices probably declined just about everywhere in July, but this will not be evident in the Case-Shiller index until next month since the Case-Shiller index is an average of three months.
Monday, September 27, 2010
Bank of England official to savers: 'Start spending'
by Calculated Risk on 9/27/2010 10:28:00 PM
From the Telegraph: Savers told to stop moaning and start spending
[Bank of England deputy governor Charles Bean said] "Savers shouldn't necessarily expect to be able to live just off their income in times when interest rates are low. It may make sense for them to eat into their capital a bit."In the U.K., savers are receiving about £18 billion a year less in interest. In the U.S., using the monthly personal interest income data from the BEA, interest income is off about $143 billion from the peak - and falling ...
...
Mr Bean said that encouraging Britons to spend was one reason why the Bank had cut interest rates.


