
 RSS Feed
 by Calculated Risk on 8/31/2010 04:14:00 PM
Tuesday, August 31, 2010
Restaurant Index shows contraction in July
This is one of several industry specific indexes I track each month.  Click on graph for larger image in new window.
Same store sales and customer traffic both declined in July (on a year-over-year basis). This is the fourth consecutive month of declines.
Unfortunately the data for this index only goes back to 2002.
Note: Any reading above 100 shows expansion for this index.
From the National Restaurant Association (NRA): Restaurant Industry Outlook Remained Uncertain in July as Restaurant Performance Index Remains Essentially Flat
As a result of soft sales and traffic levels and a deteriorating outlook among restaurant operators, the National Restaurant Association’s comprehensive index of restaurant activity remained essentially flat in July. The Association’s Restaurant Performance Index (RPI) – a monthly composite index that tracks the health of and outlook for the U.S. restaurant industry – stood at 99.4 in July, down 0.1 percent from June and its fourth consecutive decline. In addition, the RPI stood below 100 for the third consecutive month, which signifies contraction in the index of key industry indicators.Restaurants are a discretionary expense, and this contraction could be because of the sluggish recovery or might suggest further weakness in consumer spending in the months ahead.
...
Restaurant operators reported negative same-store sales for the fourth consecutive month in July, with the overall results similar to the June performance.
...
Restaurant operators also reported a net decline in customer traffic levels in July.
...
Restaurant operators have become less optimistic about their prospects for sales growth in recent months.
emphasis added
FOMC August Minutes: Both employment and inflation to fall short of dual mandate
by Calculated Risk on 8/31/2010 02:00:00 PM
From the Fed: Minutes of the Federal Open Market Committee
Economic outlook:
Members still saw the economic expansion continuing, and most believed that inflation was likely to stabilize near recent low readings in coming quarters and then gradually rise toward levels they consider more consistent with the Committee's dual mandate for maximum employment and price stability. Nonetheless, members generally judged that the economic outlook had softened somewhat more than they had anticipated, particularly for the near term, and some saw increased downside risks to the outlook for both growth and inflation. Some members expressed a concern that in this context any further adverse shocks could have disproportionate effects, resulting in a significant slowing in growth going forward. While no member saw an appreciable risk of deflation, some judged that the risk of further near-term disinflation had increased somewhat. More broadly, members generally saw both employment and inflation as likely to fall short of levels consistent with the dual mandate for longer than had been anticipated.And on policy:
All but one member concluded that it would be appropriate to begin reinvesting principal received from agency debt and MBS held in the SOMA by purchasing longer-term Treasury securities in order to keep constant the face value of securities held in the SOMA and thus avoid the upward pressure on longer-term interest rates that might result if those holdings were allowed to decline. Several members emphasized that in addition to continuing to develop and test instruments to facilitate an eventual exit from the period of unusually accommodative monetary policy, the Committee would need to consider steps it could take to provide additional policy stimulus if the outlook were to weaken appreciably further. Given the softer tone of recent data and the more modest near-term outlook, members agreed that some changes to the statement's characterization of the economic and financial situation were necessary.Not much new ...
On Case-Shiller House Prices: October is the "Witching Hour"
by Calculated Risk on 8/31/2010 12:54:00 PM
As we've discussed for some time, the Case-Shiller index is seriously lagged to real time data. The release today was for "June", but it is really an average of April, May and June.
Home sales were strong in April, May and June, and then collapsed in July. And prices have probably been falling for two months now - but that won't show up in Case-Shiller until the end of next month or even October (the Case-Shiller release at the end of October will be for June, July and August).
Note: The title for this post is from Rolfe Winkler at the WSJ's Heard on the Street (last week): Housing's Witching Hour
[T]he S&P/Case-Shiller home-price index ... could be set for another leg down. The index is computed using a three-month rolling average, meaning last month's weakness really should assert itself in late October.RadarLogic released a statement today: As Predicted, June S&P/Case-Shiller Home Price Indices Overstate Housing Market Strength
[T]he latest S&P/Case-Shiller home price indices show healthy improvement in home prices while other housing market indicators, including the RPX Composite price, show that housing markets are starting to weaken.The CoreLogic repeat sales index showed prices were flat from May to June (CoreLogic uses a weighted 3 month average and picks up the trend change a little quicker than Case-Shiller).
... We believe that these figures overstate the current strength of the U.S. housing markets. As we reported in this month’s RPX Monthly Housing Market Report, the RPX 25-MSA Composite Price declined 0.2% through the end of June on a year-over-year basis. ...
The conflict between the strength expressed in the S&P/Case-Shiller indices and the weakness apparent in other housing market indicators likely arises from the fact that the S&P/Case-Shiller indices are calculated using data from transactions that occur over a three-month period. As a result, the indices smooth over recent price movements and can take a number of months to reflect price fluctuations.
... Our concern is that, as we saw in spring 2009, the only effective stimulus of new housing demand will prove to be a precipitous decline in home prices. Our current analysis shows early signs that such a dynamic is approaching.
FDIC Q2 Banking Profile: 829 Problem Banks
by Calculated Risk on 8/31/2010 11:12:00 AM
The FDIC released the Q2 Quarterly Banking Profile today.
The FDIC listed 829 banks with $403 billion in assets as “problem” banks in Q2, up from 775 banks in Q1 2010, but the total assets declined from $431 billion in assets in Q1 2010.
There were 702 banks with $403 billion in assets on the list at the end of 2009.
Note: Not all problem banks will fail - and not all failures will be from the problem bank list - but this shows the problem is significant and still growing.
The Unofficial Problem Bank List shows 840 problem banks with $410 billion in assets - the difference is timing of releases of formal actions (or hints of pending actions). 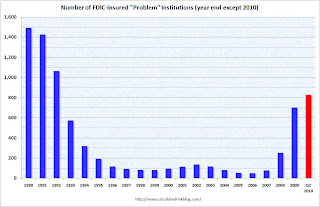 Click on graph for larger image in new window.
This graph shows the number of FDIC insured "problem" banks since 1990.
All data is year end except Q1 2010.
The 829 problem banks reported at the end of Q2 is the highest since 1992.
The FDIC is just behind the pace for 1,000 problem banks by the end of the year, although it also depends on how many banks are removed from the list.
On the Deposit Insurance Fund: The fund had an ending balance of -$15.2 billion at the end of Q2, an improvement from -$20.7 billion at the end of Q1. However the fund has plenty of cash because of the prepaid assessments last year - but those assessments will not be accounted for until they were originally due.
Case-Shiller: Home Price indices increase in June
by Calculated Risk on 8/31/2010 09:00:00 AM
IMPORTANT: These graphs are Seasonally Adjusted (SA). S&P has cautioned that the seasonal adjustment is probably being distorted by irregular factors. These distortions could include distressed sales and the various government programs.
S&P/Case-Shiller released the monthly Home Price Indices for June (actually a 3 month average of April, May and June).
This includes prices for 20 individual cities, and two composite indices (10 cities and 20 cities) and the quarterly national index.
From S&P: For the Past Year Home Prices Have Generally Moved Sideways
Data through June 2010, released today by Standard & Poor’s for its S&P/Case-Shiller Home Price Indices, the leading measure of U.S. home prices, show that the U.S. National Home Price Index rose 4.4% in the second quarter of 2010, after having fallen 2.8% in the first quarter. Nationally, home prices are 3.6% above their year-earlier levels. In June, 17 of the 20 MSAs covered by S&P/Case-Shiller Home Price Indices and both monthly composites were up; and the two composites and 15 MSAs showed year-over-year gains. Housing prices have rebounded from crisis lows, but other recent housing indicators point to more ominous signals as tax incentives have ended and foreclosures continue.
 Click on graph for larger image in new window.
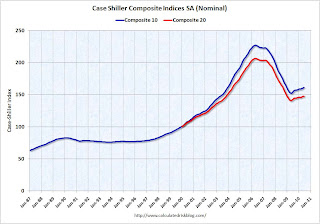
 The first graph shows the nominal seasonally adjusted Composite 10 and Composite 20 indices (the Composite 20 was started in January 2000).
The Composite 10 index is off 29.0% from the peak, and up 0.3% in June (SA).
The Composite 20 index is off 28.4% from the peak, and up 0.3% in June (SA).
 The second graph shows the Year over year change in both indices.
The Composite 10 is up 5.0% compared to June 2009.
The Composite 20 is up 4.2% compared to June 2009.
This is the fifth month with YoY price increases in a row.
The third graph shows the price declines from the peak for each city included in S&P/Case-Shiller indices.
 Prices increased (SA) in 9 of the 20 Case-Shiller cities in June seasonally adjusted.
Prices in Las Vegas are off 56.5% from the peak, and prices in Dallas only off 4.8% from the peak.
Prices are probably falling right now (starting in July), but this will not show up in the Case-Shiller index for a few months since this an average of three months.



