 RSS Feed
 by Calculated Risk on 10/16/2010 03:19:00 PM
Saturday, October 16, 2010
Fed's Evans suggests a Price Level Target
From Chicago Fed President Charles Evans: Monetary Policy in a Low-Inflation Environment: Developing a State-Contingent Price-Level Target
I think there are special circumstances when price-level targeting would be a helpful complement to our current and prospective strategies in the U.S. ... There are quite a number of academic studies of liquidity trap crises that find either price-level targeting or temporary above-average inflation to be nearly optimal policies; and yet, central bankers and the public generally loathe the idea that even a temporarily higher inflation rate could be beneficial or be consistent with price stability over the longer term.Evans suggests committing to low rates until the price level target is achieved. That way investor know that rates will stay low even with an increase in inflation. Once the price level is achieved, the Fed will move back to a 2% inflation target.
...
In my opinion, much more policy accommodation is appropriate today. In a speech two weeks ago, I stated that I believe the U.S. economy is best described as being in a bona fide liquidity trap.
...
In this setting, even a moderate expansion without a double dip will not lead to appropriate labor market improvement. Accordingly, highly plausible projections are 1 percent for core Personal Consumption Expenditure Price Index (PCE) inflation at the end of 2012 and 8 percent for the unemployment rate. For me, the Fed’s dual mandate misses are too large to shrug off, and there is currently no policy conflict between improving employment and inflation outcomes.
[CR Note: the currect FOMC forecast is for the unemployment rate to be in the 7.1% to 7.5% range in 2012, so clearly Evans is even more pessimistic]
...
If the Federal Reserve decided to increase the degree of policy accommodation today, two avenues could be: 1) additional large-scale asset purchases, and 2) a communication that policy rates will remain at zero for longer than “an extended period.”
A third and complementary policy tool would be to announce that, given the current liquidity trap conditions, monetary policy would seek to target a path for the price level. Simply stated, a price-level target is a path for the price level that the central bank should strive to hit within a reasonable period of time. For example, if the slope of the price path, which I will refer to as P*, is 2 percent and inflation has been underrunning the path for some time, monetary policy would strive to catch up to the path: Inflation would be higher than 2 percent for a time until the path was reattained. I refer to this as a state-contingent policy because the price-level targeting regime is only intended for the duration of the liquidity trap episode.
Fed's Rosengren: Important to "insure against the risk of deflation"
by Calculated Risk on 10/16/2010 12:12:00 PM
From Boston Fed President Eric Rosengren: Revisiting Monetary Policy in a Low Inflation Environment. Rosengren reviewed the Japanese experience and the 1999 Boston Fed conference on monetary policy in a low inflation environment. He noted:
From a policy perspective I take several lessons from the Japanese experience. First, should deflation occur, it can be quite difficult to overcome. Second, insuring against the risk of deflation may be much cheaper than waiting until it has occurred and then trying to address it. Finally, financially fragile economies may be particularly vulnerable to negative impacts from premature austerity measures.He also said
[A] policy of gradually adjusting monetary and fiscal policy, as conducted in Japan after deflation first occurred, may not be as effective as an active policy response taken before deflation has become embedded in the economy. Of course, it should depend on the given situation and incoming data.Also of interest, Rosengren discussed the policy channels of the Fed's Large Scale Asset Purchase or “LSAP” program. In his view there were several channels:
LSAP ChannelsRosengren is current on the FOMC.
LSAP can successfully reduce long-term rates
Cross-correlation of assets implies other rates will fall
Does signal intent to keep rates low –medium term Treasuries did move
Exchange rate channel may be important
Lending channel –firms with access to markets leave banks, providing more capacity for banks to focus
Unofficial Problem Bank List at 875 Institutions
by Calculated Risk on 10/16/2010 09:09:00 AM
Note: this is an unofficial list of Problem Banks compiled only from public sources.
Here is the unofficial problem bank list for Oct 15, 2010.
Changes and comments from surferdude808:
The Unofficial Problem Bank List shrank this week in both the number of institutions and assets. There were eight removals and six additions leaving the list at 875 institutions, down from 877 last week.
The removal of mid-size regional contributed to the decline in aggregate assets to $401.6 billion from $417.3 billion.
The removals include two of the three failed banks -- Security Savings Bank, F.S.B. ($508 million) and Westbridge Bank and Trust ($91 million). Interestingly, the other failure this week -- Premier Bank ($1.2 billion) was not subject to a published enforcement action.
Eastern National Bank ($446 million) had its action terminated. Carolina First Bank ($11.6 billion) merged into TD Bank, N.A. at the end of September. Three subsidiaries of Lauritzen Corporation (Ticker FINN) -- First National Bank, Fort Collins, CO ($1.9 billion); Castle Bank, National Association, Dekalb, IL ($1.1 billion); and First National Bank of Kansas, Overland, KS ($745 million) merged into their affiliate First National Bank of Omaha, which leaves one affiliate, First National Bank South Dakota, still on the list. We anticipate other multi-bank holding companies such as Premier Financial Bancorp (Ticker: PFBI) to merge its weak subsidiaries into a stronger affiliate. The other removal was an unassisted merger of First Bank, Farmersville, TX ($95 million) into Independent Bank, McKinney, TX.
As anticipated last week, the OCC released its enforcement actions for late August/early September. Six national banks were added this week include First Texoma National Bank, Durant, TX ($215 million); The First National Bank of Eagle River, Eagle Rover, WI ($158 million); North Georgia National Bank, Calhoun, GA ($142 million); The Camden National Bank, Camden, AL ($119 million); First National Bank, Groesbeck, TX ($50 million); and Nevada National Bank, Las Vegas, NV ($39 million).
Other modifications this week include a Prompt Corrective Action order issued by the OTS against Appalachian Community Bank ($90 million), and a name change and charter flip for Bay Cities National Bank ($273 million) to Opus Bank and state non-member status.
Friday, October 15, 2010
Bank Failure #132: Premier Bank, Jefferson City, Missouri
by Calculated Risk on 10/15/2010 07:07:00 PM
Bank C.E.O.'s breath relief sigh.
Joe "Coors" hangs his head.
by Soylent Green is People
From the FDIC: Providence Bank, Columbia, Missouri, Assumes All of the Deposits of Premier Bank, Jefferson City, Missouri
As of June 30, 2010, Premier Bank had approximately $1.18 billion in total assets and $1.03 billion in total deposits. ... The FDIC estimates that the cost to the Deposit Insurance Fund (DIF) will be $406.9 million. ... Premier Bank is the 132nd FDIC-insured institution to fail in the nation this year, and the sixth in Missouri.That makes 3 today ... almost 40% loss on Premier.
Bank Failure #130 & 131: Kansas and Missouri
by Calculated Risk on 10/15/2010 06:16:00 PM
Collides with the Hindenburg
It's really that bad.
by Soylent Green is People
From the FDIC: Simmons First National Bank, Pine Bluff, Arkansas, Assumes All of the Deposits of Security Savings Bank, F.S.B., Olathe, Kansas
As of June 30, 2010, Security Savings Bank, F.S.B. had approximately $508.4 million in total assets and $397.0 million in total deposits. ... The FDIC estimates that the cost to the Deposit Insurance Fund (DIF) will be $82.2 million. .... Security Savings Bank, F.S.B. is the 130th FDIC-insured institution to fail in the nation this year, and the second in Kansas.From the FDIC: Midland States Bank, Effingham, Illinois, Assumes All of the Deposits of WestBridge Bank and Trust Company, Chesterfield, Missouri
As of June 30, 2010, WestBridge Bank and Trust Company had approximately $91.5 million in total assets and $72.5 million in total deposit ... The FDIC estimates that the cost to the Deposit Insurance Fund (DIF) will be $18.7 million. ... WestBridge Bank and Trust Company is the 131st FDIC-insured institution to fail in the nation this year, and the fifth in Missouri.The FDIC is back to work ...
LA Port Traffic in September: Imports Strong, Exports Stalled
by Calculated Risk on 10/15/2010 04:18:00 PM
Notes: this data is not seasonally adjusted. There is a very distinct seasonal pattern for imports, but not for exports. LA area ports handle about 40% of the nation's container port traffic.
The following graph shows the loaded inbound and outbound traffic at the ports of Los Angeles and Long Beach in TEUs (TEUs: 20-foot equivalent units or 20-foot-long cargo container). Although containers tell us nothing about value, container traffic does give us an idea of the volume of goods being exported and imported.
 Click on graph for larger image in new window.
Loaded inbound traffic was up 24% compared to September 2009.
Loaded outbound traffic was up 5% from September 2009.
For imports, there is a clear seasonal pattern and frequently a double peak - first in late summer, and then in October as retailers build inventory for the holiday season - so part of this decrease in September imports is just the normal seasonal pattern. And imports will probably increase in October.
For exports there is no clear seasonal pattern, and it appears exports have stalled or even be declining.
Not only have the pre-crisis global imbalances returned, but exports appear to have peaked in May (no clear seasonal pattern), and have moved down over the last 7 months.
Inflation: Core CPI, Median CPI, 16% trimmed-mean CPI all very low
by Calculated Risk on 10/15/2010 12:56:00 PM
From Fed Chairman Ben Bernanke:
The significant moderation in price increases has been widespread across many categories of spending, as is evident from various measures that exclude the most extreme price movements in each period. For example, the so-called trimmed mean consumer price index (CPI) has risen by only 0.9 percent over the past 12 months, and a related measure, the median CPI, has increased by only 0.5 percent over the same period.The Cleveland Fed released the measures of inflation that Bernanke mentioned for September this morning:
According to the Federal Reserve Bank of Cleveland, the median Consumer Price Index was virtually unchanged at 0.0% (0.6% annualized rate) in September. The 16% trimmed-mean Consumer Price Index increased 0.1% (0.9% annualized rate) during the month. The median CPI and 16% trimmed-mean CPI are measures of core inflation calculated by the Federal Reserve Bank of Cleveland based on data released in the Bureau of Labor Statistics' (BLS) monthly CPI report.So these three measures: core CPI, median CPI and trimmed-mean CPI, were all below 1% in September, and also under 1% for the last 12 months.
Earlier today, the BLS reported that the seasonally adjusted CPI for all urban consumers rose 0.1% (1.2% annualized rate) in September. The CPI less food and energy was unchanged at 0.0% (0.0% annualized rate) on a seasonally adjusted basis.
Over the last 12 months, the median CPI rose 0.5%, the trimmed-mean CPI rose 0.8%, the CPI rose 1.1%, and the CPI less food and energy rose 0.8%
 Click on graph for larger image in new window.
This graph shows these three measure of inflation on a year-over-year basis.
They all show that inflation has been falling, and that measured inflation is up less than 1% year-over-year. Core CPI and median CPI were flat in September, and the 16% trimmed mean CPI was up 0.1%.
Note: The Cleveland Fed has a discussion of a number of measures of inflation: Measuring Inflation
Misc: Consumer Sentiment dips, CPI-W, and NY Fed Manufacturing Survey
by Calculated Risk on 10/15/2010 10:03:00 AM
So much data ...
From MarketWatch: Consumer sentiment edges lower in October
The preliminary Reuters-University of Michigan consumer sentiment index edged lower in October, falling to 67.9 ... from 68.2 last month.
 Click on graph for larger image in new window.
Consumer sentiment is a coincident indicator - and this suggests a sluggish economy.
This was a big story in July when consumer sentiment collapsed to the lowest level since late 2009. It has moved sideways since then ...
From the NY Fed: Empire State Manufacturing Survey
The Empire State Manufacturing Survey indicates that conditions improved in October for New York State manufacturers. The general business conditions index rose 12 points, to 15.7. The new orders and shipments indexes were also positive and well above their September levels.
...
The index for number of employees climbed for a third consecutive month, although the average workweek index dipped slightly.
 Here is a graph from the NY Fed.
These regional surveys had been showing a slowdown in manufacturing and are being closely watched right now. This was above expectations.
Retail Sales increase in September
by Calculated Risk on 10/15/2010 09:15:00 AM
On a monthly basis, retail sales increased 0.6% from August to September (seasonally adjusted, after revisions - August sales were revised up), and sales were up 7.3% from September 2009. This is an easy YoY comparison because of the slump in auto sales last September following Cash-for-Clunkers.
Retail sales increased 0.4% ex-autos - about at expectations.
 Click on graph for larger image in new window.
This graph shows retail sales since 1992. This is monthly retail sales, seasonally adjusted (total and ex-gasoline).
Retail sales are up 9.6% from the bottom, but still off 3.2% from the pre-recession peak.
Retail sales had moved mostly moved sideways for six months, but this is now the high for the year.
 The second graph shows the year-over-year change in retail sales (ex-gasoline) since 1993.
Retail sales ex-gasoline increased by 7.0% on a YoY basis (7.3% for all retail sales).
Here is the Census Bureau report:
The U.S. Census Bureau announced today that advance estimates of U.S. retail and food services sales for September, adjusted for seasonal variation and holiday and trading-day differences, but not for price changes, were $367.7 billion, an increase of 0.6 percent (±0.5%) from the previous month, and 7.3 percent (±0.7%) above September 2009. ... The July to August 2010 percent change was revised from +0.4 percent (±0.5%)* to +0.7 percent (±0.3%).
Bernanke: "Appears to be a case for further action"
by Calculated Risk on 10/15/2010 08:15:00 AM
From Fed Chairman Ben Bernanke: Monetary Policy Objectives and Tools in a Low-Inflation Environment
Given the Committee's objectives, there would appear--all else being equal--to be a case for further action. However, as I indicated earlier, one of the implications of a low-inflation environment is that policy is more likely to be constrained by the fact that nominal interest rates cannot be reduced below zero.This is less of a framework than I expected. There was one key paragraph on inflation:
...
For example, a means of providing additional monetary stimulus, if warranted, would be to expand the Federal Reserve's holdings of longer-term securities. Empirical evidence suggests that our previous program of securities purchases was successful in bringing down longer-term interest rates and thereby supporting the economic recovery.
...
Central bank communication provides additional means of increasing the degree of policy accommodation when short-term nominal interest rates are near zero. For example, FOMC postmeeting statements have included forward policy guidance since December 2008, and the most recent statements have reflected the FOMC's anticipation that exceptionally low levels of the federal funds rate are likely to be warranted "for an extended period," contingent on economic conditions. A step the Committee could consider, if conditions called for it, would be to modify the language of the statement in some way that indicates that the Committee expects to keep the target for the federal funds rate low for longer than markets expect. Such a change would presumably lower longer-term rates by an amount related to the revision in policy expectations. A potential drawback of using the FOMC's statement in this way is that, at least without a more comprehensive framework in place, it may be difficult to convey the Committee's policy intentions with sufficient precision and conditionality. The Committee will continue to actively review its communications strategy with the goal of providing as much clarity as possible about its outlook, policy objectives, and policy strategies.
Although the attainment of price stability after a period of higher inflation was a landmark achievement, monetary policymaking in an era of low inflation has not proved to be entirely straightforward. In the 1980s and 1990s, few ever questioned the desired direction for inflation; lower was always better. During those years, the key questions related to tactics: How quickly should inflation be reduced? Should the central bank be proactive or "opportunistic" in reducing inflation? As average inflation levels declined, however, the issues became more complex. The statement of the Federal Open Market Committee (FOMC) following its May 2003 meeting was something of a watershed, in that it noted that, in the Committee's view, further disinflation would be "unwelcome." In other words, the risks to price stability had become two-sided: With inflation close to levels consistent with price stability, central banks, for the first time in many decades, had to take seriously the possibility that inflation can be too low as well as too high.
Thursday, October 14, 2010
Foreclosure-Gate: The house that started it all
by Calculated Risk on 10/14/2010 11:59:00 PM
From David Streitfeld at the NY Times: From This House, a Foreclosure Freeze
The house that set off the national furor over faulty foreclosures is blue-gray and weathered. The porch is piled with furniture and knickknacks awaiting the next yard sale. In the driveway is a busted pickup truck.A very interesting story.
...
Nicolle Bradbury bought this house seven years ago for $75,000, a major step up from the trailer she had been living in with her family. But she lost her job and the $474 monthly mortgage payment became difficult, then impossible.
It should have been a routine foreclosure ...
Her file was pulled, more or less at random, by Thomas A. Cox, a retired lawyer who volunteers ... Mr. Cox realized almost immediately that Mrs. Bradbury’s foreclosure file did not look right. The documents from the lender, GMAC Mortgage, were approved by an employee whose title was “limited signing officer,” an indication to the lawyer that his knowledge of the case was effectively nonexistent.
Friday Preview: Bernanke, Retail Sales, CPI, and more
by Calculated Risk on 10/14/2010 07:43:00 PM
Friday will be really busy with several key releases, many at the same time (8:30 AM ET).
I'll start off posting Fed Chairman Ben Bernanke's speech, and I'll probably wait a little while to post on retail sales (Bernanke will probably discuss QE2, but I think he might outline what the Fed will do if QE2 doesn't achieve the desired goals).
On CPI, the release tomorrow will confirm that there will be no increase in Social Security benefits in 2011 - and no increase in the maximum contribution base ($106,800 same as in 2009 and 2010). For an explanation, see: No increase to Social Security Benefits for 2011 (unofficial)
Here is the economic release schedule for tomorrow ...
8:15 AM ET: Fed Chairman Ben S. Bernanke will speak at the Federal Reserve Bank of Boston Conference "Monetary Policy Objectives and Tools in a Low-Inflation Environment"
8:30 AM: Consumer Price Index for September. The consensus is for a 0.2% increase in prices. This is being closely watched for further disinflation, and also because Q3 is the quarter the annual annual cost-of-living adjustment (COLA) is calculated for Social Security (this will make it official that there will be no change in 2011).
8:30 AM: Retail Sales for September. The consensus is for a 0.4% increase from August.
8:30 AM: Empire Manufacturing Survey for October. The consensus is for a reading of 8.0, up from 4.1 in September. These regional surveys have been showing a slowdown in manufacturing and are being closely watched right now.
9:15 AM: Atlanta Fed President Dennis Lockhart participates in a question-and-answer session on the economy in Atlanta.
9:55 AM: Reuters/University of Mich Consumer Sentiment preliminary for October. The consensus is for a slight increase to 69.0 from 68.2 in September.
10:00 AM: Manufacturing and Trade: Inventories and Sales for August. Consensus is for a 0.4% increase in inventories in August.
Early Third Quarter GDP Forecast
by Calculated Risk on 10/14/2010 04:44:00 PM
From Catherine Rampell at the NY Times Economix: Third-Quarter G.D.P. Forecast Revised Down
Macroeconomic Advisers ... has just downgraded its estimate for third-quarter annual output growth to a measly 1.2 percent.My early guess is real PCE growth will come in around 2.0% in Q3. Since PCE is about 70% of GDP, that gives a contribution to GDP of 1.4 percentage points at an annual rate.
Residential investment (RI) will probably subtract close to 0.6 or more percentage points. Equipment and software will be positive and mostly offset the decline in RI. Government spending will also probably make a negative contribution. All of that puts us close to 1.0% annualized real GDP growth in Q3 before ..
Still unknown are the contributions from the trade balance and changes in inventories. With the higher than expected trade deficit in August, the contribution from trade could be close to zero. I expect a small positive contribution from inventories - so I think the 1.2% estimate is probably close (I'd guess closer to 1.5%).
It sure seems like the 2nd half slowdown is intact. And I expect PCE growth to slow in Q4 - but I think that will be offset with residential investment probably being somewhat flat (as opposed to the negative contribution in Q3).
The advance Q3 GDP report will be released on Oct 29th, and that is probably the last economic release standing between the Fed and QE2. Based on this early forecast, QE2 will arrive on Nov 3rd ...
Freddie Mac: 30 year Mortgage Rates fall to 4.19 percent, lowest since 1951
by Calculated Risk on 10/14/2010 03:10:00 PM
From Freddie Mac: 30-Year FRM Under 5 Percent for 23 Consecutive Weeks
Freddie Mac today released the results of its Primary Mortgage Market Survey® (PMMS®), which found that the 30-year fixed-rate mortgage rate fell again to break the survey’s all-time low; the 30-year FRM has been under 5 percent for 23 weeks in a row. The last time 30-year FRM rates were this low was April 1951 (based on a data series of FHA rates going back to 1948). The 5-year ARM tied the all-time survey low set last week.
...
30-year fixed-rate mortgage (FRM) averaged 4.19 percent with an average 0.8 point for the week ending October 14, 2010, down from last week when it averaged 4.27 percent. Last year at this time, the 30-year FRM averaged 4.92 percent.
Hotel Performance: RevPAR up 8.8% compared to same week in 2009
by Calculated Risk on 10/14/2010 12:43:00 PM
Hotel occupancy is one of several industry specific indicators I follow ...
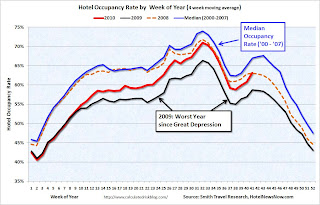
Important: Even though the occupancy rate is close to 2008 levels, 2010 is a much more difficult year for the hotel industry than 2008. RevPAR (revenue per available room) is up 8.8% compared to 2009, but still down 4.1% compared to 2008 - and 2008 was a very difficult year for the hotel industry.
From HotelNewsNow.com: STR: Economy ADR performance falls short
Overall, the industry’s occupancy increased 6.5% to 63.6%, ADR was up 2.2% to US$101.58, and revenue per available room ended the week up 8.8% to US$64.62.The following graph shows the four week moving average for the occupancy rate by week for 2008, 2009 and 2010 (and a median for 2000 through 2007).
 Click on graph for larger image in new window.
Notes: the scale doesn't start at zero to better show the change. The graph shows the 4-week average, not the weekly occupancy rate.
On a 4-week basis, occupancy is up 7.4% compared to last year (the worst year since the Great Depression) and 5.8% below the median for 2000 through 2007.
The occupancy rate is about at the levels of 2008, but RevPAR is still down 4.1%.
Data Source: Smith Travel Research, Courtesy of HotelNewsNow.com
Trade Deficit increases sharply in August
by Calculated Risk on 10/14/2010 09:10:00 AM
The Census Bureau reports:
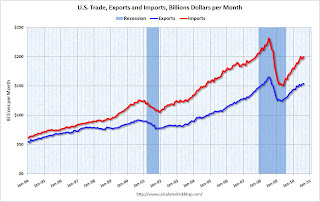
[T]otal August exports of $153.9 billion and imports of $200.2 billion resulted in a goods and services deficit of $46.3 billion, up from $42.6 billion in July, revised.
 Click on graph for larger image.
The first graph shows the monthly U.S. exports and imports in dollars through August 2010.
After trade bottomed in the first half of 2009, both imports and exports increased significantly. However in 2010 export growth has slowed, and imports have been increasing much faster than exports.
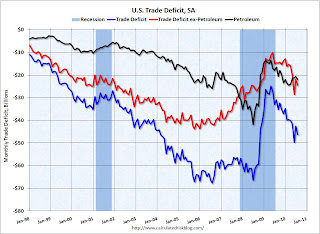
The second graph shows the U.S. trade deficit, with and without petroleum, through August.
 The blue line is the total deficit, and the black line is the petroleum deficit, and the red line is the trade deficit ex-petroleum products.
The increase in the deficit in August was due to both oil and China, although the bulk of the increase was because of trade with China. The trade deficit with China increased to $28.0 billion in August from $25.9 billion in July (NSA).
The imbalances have returned ...
Weekly Initial Unemployment Claims increase to 462,000
by Calculated Risk on 10/14/2010 08:30:00 AM
The DOL reports on weekly unemployment insurance claims:
In the week ending Oct. 9, the advance figure for seasonally adjusted initial claims was 462,000, an increase of 13,000 from the previous week's revised figure of 449,000 [up from 445,000]. The 4-week moving average was 459,000, an increase of 2,250 from the previous week's revised average of 456,750.
 Click on graph for larger image in new window.
This graph shows the 4-week moving average of weekly claims since January 2000.
The dashed line on the graph is the current 4-week average. The four-week average of weekly unemployment claims increased this week by 2,250 to 459,000.
The 4-week moving average has been moving sideways at an elevated level since last December - and that suggests a weak job market.
Note: most revisions have been slightly up over the last year or so. The average revision has been just over 2,000. But if you follow the 4 week moving average (as I do), this would only impact the last data point - and only by about 500. I couldn't see that on the graph! Not a big deal.
Wednesday, October 13, 2010
RealtyTrac: Record Repossessions reported in September
by Calculated Risk on 10/13/2010 11:59:00 PM
From RealtyTrac: Foreclosure Activity Increases 4 Percent in Third Quarter
Foreclosure filings were reported on 347,420 U.S. properties in September, an increase of nearly 3 percent from the previous month and an increase of 1 percent from September 2009. A record total of 102,134 bank repossessions were reported in September, the first time bank repossessions have surpassed the 100,000 mark in a single month.This will slow down in Q4, but will pick up again soon.
“Lenders foreclosed on a record number of properties in September and in the third quarter, taking a bite out of the backlog of distressed properties where the foreclosure process was delayed by foreclosure prevention efforts over the past 20 months,” said James J. Saccacio, chief executive officer of RealtyTrac. “We expect to see a dip in those bank repossessions — and possibly earlier stages of the foreclosure process — in the fourth quarter as several major lenders have halted foreclosure sales in some states while they review irregularities in foreclosure-processing documentation that has been called into question in recent weeks.”
Fed's Lacker: Inflation "now on Target"
by Calculated Risk on 10/13/2010 09:42:00 PM
Here is a different view ...
From Richmond Fed President Jeffrey Lacker: Economic Outlook, October 2010
[I]nflation is now on target, as far as I'm concerned. Over the last 12 months the price index for personal consumption expenditure has risen 1.5 percent, which is exactly what I've been recommending for the last six years. We also track a core price index that omits volatile food and energy prices, and it is sending the same message, having risen by 1.4 percent over the last 12 months. I believe that the Fed's best contribution to our nation's economic prosperity over time would be to keep inflation stable near the current 1.5 percent rate. But inflation has been lower this year, with overall inflation increasing at only a 0.7 percent annual rate, which is too low for me. I would point out that these inflation numbers often run hot or cold for several months at a time, which is why economists focus on the 12-month number I cited a moment ago. I am not yet convinced that inflation is likely to remain undesirably low. Moreover, the public's expectation of future inflation is not at such a low level; indeed, the latest survey from the University of Michigan puts the public's short-run inflation expectation at 2.2 percent. So I do not see a material risk of deflation — that is, an outright decline in the price level.Lacker speech is a little strange because he mentions three possible reasons for the high unemployment rate - skills mismatch, extended benefits, uncertainty regarding government policies - and leaves out the most widely accepted reason: lack of aggregate demand. Weird.
And on inflation, core CPI (from the BLS) is up 1.0% over the last 12 months and median CPI from the Cleveland Fed (an alternative measure of inflation) is up only 0.5% over the last year - so I'd argue inflation is below Lacker's target.
Lacker is not currently on the FOMC.
U.S. outlines process for "orderly and expeditious resolution of foreclosure process issues"
by Calculated Risk on 10/13/2010 05:39:00 PM
From the FHFA: Statement By FHFA Acting Director Edward J. DeMarco On
Servicer Financial Affidavit Issues
“On October 1, FHFA announced that Fannie Mae and Freddie Mac are working with their respective servicers to identify foreclosure process deficiencies and that where deficiencies are identified, will work together with FHFA to develop a consistent approach to address the problems. Since then, additional mortgage servicers have disclosed shortcomings in their processes and public concern has increased.This is a four-point plan:
Today, I am directing the Enterprises to implement a four-point policy framework detailing FHFA’s plan, including guidance for consistent remediation of identified foreclosure process deficiencies. This framework envisions an orderly and expeditious resolution of foreclosure process issues that will provide greater certainty to homeowners, lenders, investors, and communities alike. ..."
1) Verify Process -- Mortgage servicers must review their processes and procedures and verify that all documents, including affidavits and verifications, are completed in compliance with legal requirements. ...
2) Remediate Actual Problems -- When a servicer identifies a foreclosure process deficiency, it must be remediated in an appropriate and timely way and be sustainable.
Note: this includes actions for a) Pre-judgment foreclosure actions, b) Post-judgment foreclosure actions (prior to foreclosure sale), c) Post-foreclosure sale (Enterprise owns the property), and d) Bankruptcy Cases. This includes actions to clear title.
3) Refer Suspicion of Fraudulent Activity
4) Avoid Delay -- In the absence of identified process problems, foreclosures on mortgages for which the borrower has stopped payment, and for which foreclosure alternatives have been unsuccessful, should proceed without delay.


