 RSS Feed
 by Calculated Risk on 8/11/2010 07:35:00 AM
Wednesday, August 11, 2010
MBA: Mortgage Applications Essentially Unchanged Despite Lowest Rates
The MBA reports: Mortgage Applications Essentially Unchanged Despite Lowest Rates
The Refinance Index increased 0.6 percent from the previous week and the seasonally adjusted Purchase Index increased 0.3 percent from one week earlier.
...
The average contract interest rate for 30-year fixed-rate mortgages decreased to 4.57 percent from 4.60 percent, with points decreasing to 0.89 from 0.93 (including the origination fee) for 80 percent loan-to-value (LTV) ratio loans. This was the lowest 30-year contract rate ever recorded in the survey.
 Click on graph for larger image in new window.
This graph shows the MBA Purchase Index and four week moving average since 1990.
The purchase index has increased slightly for four straight weeks - but is still 40% below the level of the last week of April (and about 32% below the last week of April using the 4-week average).
This recent collapse in the purchase index has already shown up as a decline in new home sales (counted when the contract is signed), and will show up in the July and August existing home sales reports (counted at close of escrow).
Note: Mortgage rates will probably fall to another record low this week too.
Tuesday, August 10, 2010
Lowell: The Natural History of a Rumor
by Calculated Risk on 8/10/2010 08:55:00 PM
Linda Lowell at HousingWire wrote a great piece chronicling the history of that ridiculous rumor last week of a massive bailout of underwater homeowners: "Slam Dunk Stimulus" – The Natural History of a Rumor
I'd like to thank Linda for mentioning my reaction ("nonsense"). I usually ignore these rumors, but this one was getting significant coverage and was obviously nonsense.
Linda's piece is excellent.
"Quantitative Neutrality"
by Calculated Risk on 8/10/2010 06:14:00 PM
People are struggling with a name for the Fed's action today. I've seen QE 1.5 and variations, but perhaps the best comes from Asha Bangalore at Northern Trust who called it Quantitative Neutrality (QN), see: Fed Moves from "QE" to "QN"
The Fed's goal (according to the technical note from the NY Fed) is to "maintain the face value of outright holdings of domestic securities" at approximately $2.054 trillion. Click on graph for larger image in new window.
The red line on this graph is the amount of outright holdings on the Fed's balance sheet. The dashed line is the new target level. This is about $17 billion below the peak of a few weeks ago.
The outright holdings were expected to fall by about $200 billion by the end of 2011 (some have estimated as high as $400 billion), and that would represent tightening in the face of high unemployment and below target inflation.
The NY Fed will announce the size of the September purchases tomorrow and that will give an idea of how much the Fed expected the outright holdings to fall. The recent increase in refinance activity might have accelerated the process.
NY Fed: Technical Note on Reinvestment
by Calculated Risk on 8/10/2010 02:47:00 PM
From the Open Market Trading Desk: Statement Regarding Reinvestment of Principal Payments on Agency Debt and Agency MBS
On August 10, 2010, the Federal Open Market Committee directed the Open Market Trading Desk (the Desk) at the Federal Reserve Bank of New York to keep constant the Federal Reserve’s holdings of securities at their current level by reinvesting principal payments from agency debt and agency mortgage-backed securities (agency MBS) in longer-term Treasury securities. The most recent H.4.1 data release indicates that outright holdings of domestic securities in the System Open Market Account (SOMA) totaled $2.054 trillion as of August 4, 2010. The Desk will seek to maintain the face value of outright holdings of domestic securities in the SOMA at approximately this level. Due to differences in settlement dates for purchases and principal payments, it is anticipated that the actual level of domestic securities held will vary around this level to some degree.
In the middle of each month, the Desk will publish a tentative schedule of purchase operations expected to take place through the middle of the following month, as well as the anticipated total amount of purchases to be conducted over that period. The anticipated total amount of purchases will be calibrated to offset the amount of principal payments from agency debt and agency MBS expected to be received over that period. The announcement will occur shortly after the monthly releases of current MBS factors from Fannie Mae, Freddie Mac, and Ginnie Mae, allowing the Desk to anticipate the principal payments to be received by the SOMA portfolio over the period.
The first tentative schedule of purchase operations and the anticipated total amount of purchases to be conducted through the middle of September will be published tomorrow, August 11, at 3 p.m. The purchase schedule will include a list of operation dates, settlement dates, security types to be purchased (nominal coupons or TIPS), and a maturity date range of eligible issues for each scheduled operation. The Desk expects to begin purchasing Treasury securities under this policy on or around August 17.
The Desk will concentrate its purchases in the 2- to 10-year sector of the nominal Treasury curve, although purchases will occur across the nominal Treasury coupon and TIPS yield curves. The Desk will typically refrain from purchasing securities for which there is heightened demand or of which the SOMA already holds large concentrations.
Purchases will be conducted with the Federal Reserve’s primary dealers through a series of competitive auctions via the Desk’s FedTrade system. The exact list of securities eligible for purchase will be made available at the beginning of each purchase operation. The results of each operation will be published on the Federal Reserve Bank of New York’s website shortly after each purchase operation has concluded.
FAQs: Reinvestment of Principal Payments on Agency Debt and Agency Mortgage-Backed Securities in Treasuries
FOMC Statement: Weaker Economy, to Reinvest
by Calculated Risk on 8/10/2010 02:15:00 PM
The key is the reinvestment of maturing MBS in long term Treasury securities!
From the Fed:
Information received since the Federal Open Market Committee met in June indicates that the pace of recovery in output and employment has slowed in recent months. Household spending is increasing gradually, but remains constrained by high unemployment, modest income growth, lower housing wealth, and tight credit. Business spending on equipment and software is rising; however, investment in nonresidential structures continues to be weak and employers remain reluctant to add to payrolls. Housing starts remain at a depressed level. Bank lending has continued to contract. Nonetheless, the Committee anticipates a gradual return to higher levels of resource utilization in a context of price stability, although the pace of economic recovery is likely to be more modest in the near term than had been anticipated.The language about rates stayed the same: "The Committee ... continues to anticipate that economic conditions, including low rates of resource utilization, subdued inflation trends, and stable inflation expectations, are likely to warrant exceptionally low levels of the federal funds rate for an extended period."
Measures of underlying inflation have trended lower in recent quarters and, with substantial resource slack continuing to restrain cost pressures and longer-term inflation expectations stable, inflation is likely to be subdued for some time.
The Committee will maintain the target range for the federal funds rate at 0 to 1/4 percent and continues to anticipate that economic conditions, including low rates of resource utilization, subdued inflation trends, and stable inflation expectations, are likely to warrant exceptionally low levels of the federal funds rate for an extended period.
To help support the economic recovery in a context of price stability, the Committee will keep constant the Federal Reserve's holdings of securities at their current level by reinvesting principal payments from agency debt and agency mortgage-backed securities in longer-term Treasury securities.1 The Committee will continue to roll over the Federal Reserve's holdings of Treasury securities as they mature.
The Committee will continue to monitor the economic outlook and financial developments and will employ its policy tools as necessary to promote economic recovery and price stability.
Voting for the FOMC monetary policy action were: Ben S. Bernanke, Chairman; William C. Dudley, Vice Chairman; James Bullard; Elizabeth A. Duke; Donald L. Kohn; Sandra Pianalto; Eric S. Rosengren; Daniel K. Tarullo; and Kevin M. Warsh.
Voting against the policy was Thomas M. Hoenig, who judges that the economy is recovering modestly, as projected. Accordingly, he believed that continuing to express the expectation of exceptionally low levels of the federal funds rate for an extended period was no longer warranted and limits the Committee's ability to adjust policy when needed. In addition, given economic and financial conditions, Mr. Hoenig did not believe that keeping constant the size of the Federal Reserve's holdings of longer-term securities at their current level was required to support a return to the Committee's policy objectives.
FOMC Statement Preview
by Calculated Risk on 8/10/2010 12:41:00 PM
I think there are three things to look for in the statement today at 2:15 PM ET.
1) How will the statement discuss the recent economic slowdown?
From the June 23rd FOMC statement:
"Information received since the Federal Open Market Committee met in April suggests that the economic recovery is proceeding and that the labor market is improving gradually. ... [T]he Committee anticipates a gradual return to higher levels of resource utilization in a context of price stability, although the pace of economic recovery is likely to be moderate for a time."I expect the statement today to acknowledge the weaker data since the last meeting.
2) Will they express more concern about deflation?
Last month:
"[U]nderlying inflation has trended lower. With substantial resource slack continuing to restrain cost pressures and longer-term inflation expectations stable, inflation is likely to be subdued for some time."Those sentences might remain the same.
3) And the BIG one: Will the FOMC change their reinvestment strategy?
Currently the FOMC is not reinvesting maturing MBS. This is passively shrinking the Fed's balance sheet, and probably at a faster rate than expected because of recent refinance activity.
The Fed might decide to reinvest the maturing MBS. If they do, the questions are: For how long (end of 2011)? And what will they buy (probably Treasury Securities, but what duration)?
My guess is there will be no change to the current MBS run off strategy.
"Buy and Bail" Again
by Calculated Risk on 8/10/2010 10:34:00 AM
This is an update on an old story ...
From Bloomberg: `Buy and Bail' Homeowners Get Past Loan Restrictions (ht Mike in Long Island, Paulo)
Real estate professionals call it “buy and bail,” acquiring a new house before the buyer’s credit rating is ruined by walking away from the old one ...It is really only "buy and bail" if the home buyer intends to walk away from the original house. With these new restrictions, I doubt this is a significant problem any more.
Freddie Mac and larger rival Fannie Mae cracked down on buy and bail in 2008 by banning in most cases the use of rental income from an existing home to qualify for a new mortgage unless the first property has at least 30 percent equity.
“There were a number of policies put in place to squelch this type of activity, but people who are savvy can always find a way to circumvent policies,” said [Meg Burns, senior associate director for congressional affairs and communications at the Federal Housing Finance Agency] ...
In addition to the rental restrictions, the mortgage giants now usually require reserves equal to six months of loan payments for both homes. The measures have been sufficient to block most applicants who attempt to buy and bail, said Pete Bakel, a spokesman for Washington-based Fannie Mae.
NFIB: Small Business Optimism Declines
by Calculated Risk on 8/10/2010 08:10:00 AM
From the National Federation of Independent Business (NFIB): Small Business Economic Trends Click on graph for larger image in new window.
NFIB reported its optimism index fell 0.9 point to 88.1 in July. (Graph from NFIB)
Here are the details:
The Index of Small Business Optimism lost 0.9 points in July following a sharp decline in June. The persistence of Index readings below 90 is unprecedented in survey history. ...Note: A large percentage of small businesses are in real estate related fields and that will keep optimism down.
Labor Market
Ten (10) percent (seasonally adjusted) reported unfilled job openings, up one point from June but historically very weak. Over the next three months, nine percent plan to increase employment (down one point), and 10 percent plan to reduce their workforce (up two points) ...
Capital Spending
The frequency of reported capital outlays over the past six months fell one point to 45 percent of all firms, one point above the 35 year record low reached most recently in December 2009. The percent of owners planning to make capital expenditures over the next few months fell one point to 18 percent, two points above the 35 year record low.
Credit
[C]redit availability does not appear to be the cause of slow growth as many allege. Four percent of the owners reported “finance” as their top business problem, down two points. Pre-1983, as many as 37 percent cited financing and interest rates as their top problem. What businesses need are customers, giving them a reason to hire and make capital expenditures and borrow to support those activities.
Once again the key problem is lack of demand.
Monday, August 09, 2010
REO Inventory including private-label RMBS
by Calculated Risk on 8/09/2010 09:24:00 PM
Earlier I posted a graph of Fannie, Freddie and FHA inventory (new record total in Q2).
Economist Tom Lawler has added private-label RMBS REO in the following graph.
Note: The private-label securities have one advantage - they essentially stopped making new loans in mid-2007! (see Figure 3 from San Francisco Fed Senior Economist John Krainer: Recent Developments in Mortgage Finance)
Update: The private-label securities are the ones securitized by Wall Street. This was the worst of the worst securities. Click on graph for larger image in new window.
From Tom Lawler:
As the chart indicates, the SF REO inventory of “the F’s” has increased sharply since the end of 2008, while the SF REO inventory held in private-label RMBS has fallen considerably. This chart, of course, does NOT include anything close to all REO, as SF REO properties owned by banks, thrifts, credit unions, VA, USDA, finance companies, and “other” mortgage lenders/investors are not included.
Rail Traffic increases 4.1% in July compared to July 2009
by Calculated Risk on 8/09/2010 04:15:00 PM
From the Association of American Railroads: Rail Time Indicators. The AAR reports traffic in July 2010 was up 4.1% compared to July 2009 - and traffic was 14.6% lower than in July 2008.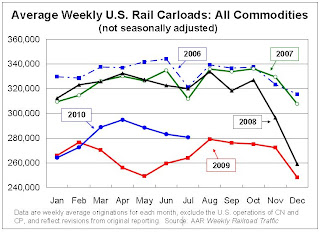 Click on graph for larger image in new window.
This graph shows U.S. average weekly rail carloads (NSA). Traffic increased in 14 of 19 major commodity categories year-over-year.
From AAR:
• U.S. freight railroads originated 1,122,308 carloads in July 2010, an average of 280,577 carloads per week — up 4.1% from July 2009 (see chart) but down 14.6% from July 2008 on a non-seasonally adjusted basis.As the graph above shows, rail traffic collapsed in November 2008, and now, a year into the recovery, traffic has only recovered part way.
• On a seasonally adjusted basis, U.S. rail carloads rose 3.2% in July 2010 from June 2010 after falling 1.2% in June 2010 and 0.9% in May 2010. The seasonally adjusted weekly average of 289,320 carloads in July 2010 was the highest such figure since November 2008.
excerpts with permission
Seasonally there is usually a decline in traffic in July, so seasonally adjusted traffic increased last month. However traffic is only up 4.1% compared to July 2009.
Miscellaneous Reading: Helicopter drops, Personal Income Declines, Recession Probabilities
by Calculated Risk on 8/09/2010 02:24:00 PM
A few articles of interest ...
Personal income declined in 2009 in most of the nation’s metropolitan statistical areas (MSAs), according to estimates released today by the U.S. Bureau of Economic Analysis.The per capita income in my MSA fell 3.8% last year.
An unstable economic environment has rekindled talk of a double-dip recession. The Conference Board’s Leading Economic Index provides data for predicting the probability of a recession but is limited by the weight assigned to its indicators and the varying efficacy of those indicators over different time horizons. Statistical experiments with LEI data can mitigate these limitations and suggest that a recessionary relapse is a significant possibility sometime in the next two years.The authors make some adjustment to the LEI, including removing the yield curve:
However, the term structure may not presently be an accurate signal. Monetary policy has been operating near the zero lower bound to provide maximum monetary stimulus. In addition, the Greek fiscal crisis has generated a considerable flight to quality that has pushed down yields on U.S. Treasury securities. Indeed, ... omitting the rate-spread indicator generates far more pessimistic forecasts. For the period 18 to 24 months in the future, the probability of recession goes above 0.5, putting the odds of recession slightly above the odds of expansion.
There is quite a bit about deflaton and monetary policy in this 1999 paper from Ben Bernanke, including arguing for a higher inflation target of 3% to 4%. Bernanke even made some "helicopter drop" comments before his well known speech in 2002: Deflation: Making Sure "It" Doesn't Happen Here
From the 1999 paper:
An alternative strategy, which does not rely at all on trade diversion, is money-financed transfers to domestic households—-the real-life equivalent of that hoary thought experiment, the “helicopter drop” of newly printed money. I think most economists would agree that a large enough helicopter drop must raise the price level.And relevant to the FOMC meeting tomorrow:
A nonstandard open-market operation ... is the purchase of some asset by the central bank (long-term government bonds, for example) at fair market value. The object of such purchases would be to raise asset prices, which in turn would stimulate spending (for example, by raising collateral values). I think there is little doubt that such operations, if aggressively pursued, would indeed have the desired effect ...
Incoming data give the Fed a green light to ease further. There is frequent chatter from unnamed sources that the Fed can do more and will consider more at this Tuesday's FOMC meeting. The public stance of Fed officials is recent weeks has tended to downplay the necessity for action at this juncture. This combination leaves the outcome of this week's FOMC meeting in doubt. My baseline expectation is that the FOMC statement acknowledges the weakness in recent data, but leaves the current policy stance intact. There is a nontrivial possibility that the Fed either implicitly or explicitly ends the policy of passive balance sheet contraction. I believe it very unlikely that the Fed sets in motion an expansion of the balance sheet.There is much more in Duy's piece.
Fannie, Freddie, FHA REO Inventory Increases 13% in Q2 from Q1 2010
by Calculated Risk on 8/09/2010 11:25:00 AM
The combined REO (Real Estate Owned) inventory for Fannie, Freddie and the FHA increased by 13% in Q2 2010 from Q1 2010. The REO inventory (lender Real Estate Owned) increased 74% compared to Q2 2009 (year-over-year comparison). Click on graph for larger image in new window.
This graph shows the REO inventory for Fannie, Freddie and FHA through Q2 2010.
The REO inventory for the "Fs" has increased sharply over the last year, from 135,868 at the end of Q2 2009 to 236,338 at the end of Q2 2010.
This is a new record for Fannie and Freddie; the FHA's REO inventory decreased slightly in Q2 2010.
Remember this is just a portion of the total REO inventory. Private label securities and banks and thrifts also hold a substantial number of REOs.
Freddie Mac: $4.7 billion Loss, REO Inventory increases 79% YoY
by Calculated Risk on 8/09/2010 09:40:00 AM
Freddie Mac reported: "a net loss of $4.7 billion for the quarter ended June 30, 2010, compared to a net loss of $6.7 billion for the quarter ended March 31, 2010." and the FHFA requested another $1.8 billion from Treasury. (ht jb)
"We recognize that high unemployment and other factors still pose very real challenges for the housing market" said Freddie Mac Chief Executive Officer Charles E. Haldeman, Jr. Click on graph for larger image in new window.
Freddie Mac reported that their REO inventory increased 79% year over year, from 34,699 in Q2 2009 to 62,178 in Q2 2010.
REO: Real Estate Owned.
See page 16 of the Second Quarter 2010 Financial Results Supplement
This graph shows the rapid increase in REO.
Note: last week I posted a graph of the Fannie Mae REO.
East of San Francisco: 20% Unemployment, House Prices off Sharply
by Calculated Risk on 8/09/2010 08:49:00 AM
Alana Semuels at the LA Times describes the impact of the housing / credit bust on the communities east of San Francisco: Northeast of Silicon Valley, recession's effects are magnified. A few excerpts:
[B]uilding has all but stopped. Home prices in San Joaquin County have fallen 63% since the peak median price of $451,500 in November 2005, according to MDA DataQuick. [Note: these are median prices]. Prices in Contra Costa County are down 53% from their peak of $600,000 in April 2007. One in every 135 houses in Contra Costa County received a foreclosure filing in June 2010. In San Joaquin County, that figure is 1 in 104 — nearly double the California average.During the boom, a large percentage of the people in these communities worked in construction or other real estate related fields - and for obvious reasons, the more an area was dependent on housing, the larger the negative impact of the housing bust.
Signs of a slowdown are everywhere. At Bethel Island, a Contra Costa County summer vacation area normally busy with tourists and fishermen, boats sit rotting in the Sacramento River. Nearby, a planned residential waterfront development has stalled. The builder completed boat docks before pulling out; an eerie remnant of the luxury once planned there. In Livermore, an Alameda County town, whole shopping developments are empty and foreclosure notices dot homes.
...
The unemployment rate in Stockton, the county seat of San Joaquin County, is 19.8%. It's 29% in the nearby hamlet of Garden Acres, higher than any city of its size in Southern California's Inland Empire.
Sunday, August 08, 2010
FOMC Meeting on Tuesday
by Calculated Risk on 8/08/2010 08:34:00 PM
I mentioned the FOMC in the Weekly Summary and Schedule post, and here is some more ...
From the Financial Times: Fed set to downgrade outlook for US
The Federal Reserve is set to downgrade its assessment of US economic prospects when it meets on Tuesday to discuss ways to reboot the flagging recovery. ...That is a good summary. The Fed will obviously acknowledge the weaker data since the last meeting in June, but they might view the last two months as a "pause" as opposed to a slowdown. In his recent testimony and his speech last week, Bernanke clearly felt the economy would continue to recover. Bernanke said:
[The Fed might make] ... a decision to reinvest proceeds from maturing mortgage-backed securities held by the US central bank ... most economists believe that it would take several more months of poor data for the Fed to actually begin a new round of [large scale] asset purchases
excerpt with permission
While the support to economic activity from stimulative fiscal policies and firms' restocking of their inventories will diminish over time, rising demand from households and businesses should help sustain growth. In particular, in the household sector, growth in real consumer spending seems likely to pick up in coming quarters from its recent modest pace, supported by gains in income and improving credit conditions.A change in outlook in just a week would be significant.
It is possible that the Fed could announce they will reinvest the proceeds from maturing MBS (some people put this at $200 billion through 2011, but other analysts expect it might be closer to $400 billion with lower mortgage rates and more refinance activity).
It was just a couple of months ago that some Fed Presidents were arguing that the Fed should sell MBS in addition to the maturing MBS. Selling additional MBS is clearly off the table for now.
Hamilton: Current economic conditions
by Calculated Risk on 8/08/2010 05:15:00 PM
Professor Hamilton reviews the data last week: Current economic conditions. Unfortunately he is even more "discouraged":
Last week's new economics data were a mixed bag. But on balance I'd have to say I'm more discouraged than when the week began.
...
The Aruoba-Diebold-Scotti Business Conditions Index, which does not use hours, and does not adjust the monthly employment changes for the effects of temporary Census hiring, is certainly discouraged. In fact, the combined effect of last week's increase in new claims for unemployment insurance plus the weak employment report pushed the ADS dangerously close to the -0.8 value that historically would often mean that a new recession could be starting. The most recent inference of that series, however, can be heavily influenced by the latest data, and it would be a mistake to make too much out of the most very recent values.
But it would also be a mistake to say that everything is going just fine.
Weekly Summary and Schedule, August 8th
by Calculated Risk on 8/08/2010 10:55:00 AM
The key economic report this week will be July retail sales to be released on Friday. The FOMC statement on Tuesday will also be closely watched.
Sometime this week the July rail traffic report, from the Association of American Railroads (AAR), and the July Ceridian-UCLA Pulse of Commerce Index (based on diesel fuel consumption) will probably both be released. Both showed transportation weakness in June.
On Tuesday, the National Association of Independent Business (NFIB) will release the small business optimism survey for July. Also on Tuesday, the BLS will release the Q2 Productivity and Costs report, and the Census Bureau will release the Monthly Wholesale Trade: Sales and Inventories for June.
The Federal Reserve’s Federal Open Market Committee (FOMC) will meet on Tuesday, and the FOMC statement will be released at around 2:15 PM ET. This will be closely scrutinized for a discussion of the economic slowdown since the last meeting on June 23rd – especially considering the two weak employment reports in the interim – and to see if the FOMC will slightly ease monetary policy. There has been some discussion that the Fed might announce they are reinvesting maturing mortgage backed securities (MBS) into either new MBS or Treasury securities.
Jon Hilsenrath discusses this possibility in the WSJ: Jobs Report Intensifies Fed Debate
A key item on the agenda is likely to be whether the Fed should tweak its strategy for managing its $1.1-trillion portfolio of mortgage backed securities so holdings don't shrink in the months ahead.On Wednesday, the MBA will release the mortgage purchase applications index. Also on Wednesday, the June Trade Balance report will be released at 8:30 AM by the Census Bureau. The consensus is for the U.S. trade deficit to increase slightly to $42.5 billion (from $42.3 billion in May). This might lead to further adjustments for Q2 GDP.
...
The divisive question for the Fed is what message they would be sending if they alter their reinvestment strategy. Fed officials are acutely aware that if they start reinvesting proceeds from maturing mortgage bonds -- as they now do for maturing Treasury debt -- many investors will think they are laying the groundwork for a more dramatic move of large scale purchases of new bonds ...
Also on Wednesday the Job Openings and Labor Turnover Survey (JOLTS) for June will be released at 10 AM by the BLS. This report has been showing very little turnover in the labor market and few job openings.
On Thursday, the initial weekly unemployment claims will be released. Consensus is for a decline to 460K from 479K last week.
On Friday, the Consumer Price Index for July will be released at 8:30 AM. This is expected to show a 0.2% increase in prices. Also on Friday July retail sales will be released at 8:30 AM. The consensus is for an increase of 0.5% from the June rate, and 0.2% increase ex-autos. Also the preliminary August Reuter's/University of Michigan's Consumer sentiment index will be released at 9:55 AM, and June Business inventories will be released at 10 AM.
And of course the FDIC will probably have another busy Friday afternoon ...
And a summary of last week:
Total nonfarm payroll declined by 131,000 in July.
The number of temporary decennial Census worker declined by 143,000.
So the total nonfarm ex-Census is -143,000 minus -131,000 = +12,0001.
1For an explanation, see: Employment Report: Why the different payroll numbers?
 Click on graph for larger image.
This graph shows the job losses from the start of the employment recession, in percentage terms.
The dotted line shows the impact of Census hiring. In July, there were 196,000 temporary 2010 Census workers on the payroll. The number of Census workers will continue to decline - and the gap between the solid and dashed red lines will be gone in a few months.
Jingle Mail from Hyatt Hotels
by Calculated Risk on 8/08/2010 07:15:00 AM
From Theo Francis at footnoted.com: Jingle mail in Jersey from Hyatt Hotels ... (ht NorkaWest)
If you’re in Princeton, New Jersey, anytime soon, swing by the Hyatt Regency Princeton. With the Hyatt Hotels (H) quarterly report filed yesterday, it has become a symbol of the financial crisis ... one of Hyatt’s subsidiaries “did not have sufficient cash flow to meet interest payment requirements under its mortgage loan” on the property, in this case a 347-room hotel with a restaurant, bar and comedy club, just a mile from the famous university.Some people are still mailing in the keys!
...
“When hotel cash flow became insufficient to service the loan,” the company said in the filing, “HHC notified the lender that it would not provide assistance.” In other words, Hyatt decided to walk away — the equivalent of “jingle mail,” ... In Hyatt’s case, the company “and the lender agreed in principal to effect a deed in lieu of foreclosure transaction.”
Saturday, August 07, 2010
Duration of Unemployment
by Calculated Risk on 8/07/2010 07:35:00 PM
An update by request ... Click on graph for larger image.
This graph shows the duration of unemployment as a percent of the civilian labor force. The graph shows the number of unemployed in four categories: less than 5 week, 6 to 14 weeks, 15 to 26 weeks, and 27 weeks or more.
Note: The BLS reports 15+ weeks, so the 15 to 26 weeks number was calculated.
In July 2010, the number of unemployed for 27 weeks or more declined slightly to 6.572 million (seasonally adjusted) from 6.751 million in June. It is possible that the number of long term unemployed has peaked, but it is still very difficult for these people to find a job - and this is a very serious employment issue.
The less than 5 weeks category increased in July and is now at the highest level since January - and that is concerning.
Note: Even though these numbers are all seasonally adjusted, they can't be added together to calculate the unemployment rate.
Employment posts yesterday (with many graphs):
Unofficial Problem Bank list increases to 811 institutions
by Calculated Risk on 8/07/2010 03:24:00 PM
Note: this is an unofficial list of Problem Banks compiled only from public sources.
Here is the unofficial problem bank list for August 6, 2010.
Changes and comments from surferdude808:
The Federal Reserve was active this week issuing several Written Agreements and two Prompt Corrective Action Orders. Five state member banks were added to the Unofficial Problem Bank List this week. The additions are New Peoples Bank, Inc., Honaker, VA ($868 million); CapitalBank, Greenwood, SC ($745 million Ticker: CPBK); Premier Bank, Dubuque, IA ($292 million); Oregon Pacific Bank, Florence, OR ($164 million Ticker: ORPB); and Progress Bank of Florida, Tampa, FL ($119 million). Progress Bank of Florida has the dubious distinction of receiving a simultaneous Prompt Corrective Action Order with an enforcement action, which is a first during this crisis.
The Federal Reserve also issued a Prompt Corrective Action Order against Community First Bank - Chicago ($60 million). The OTS converted the Supervisory Agreement against Home Federal Bank of Hollywood to a Cease & Desist Order this week. The other changes are two removals -- the failed Ravenswood Bank ($301 million) and Charter West National Bank, which had its Supervisory Agreement terminated by the OCC.
The Unofficial Problem Bank List had a net change of three additions and finishes the week at 811 institutions with aggregate assets of $416.5 billion.
 Click on graph for larger image in new window.
This graph shows the number of banks on the unofficial list. The number of institutions has more than doubled since we started the list in early August 2009 - even with all the bank failures (failures are removed from the list). The number of assets is up 50 percent over the last year.
On August 7, 2009, we listed 389 institutions with $276 billion in assets, and now the list has 811 institutions and $416.5 billion in assets.
The four red dots are the number of banks on the official problem bank list as announced in the FDIC quarterly banking profile for Q2 2009 through Q1 2010. The dots are lagged one month because of the delay in announcing formal actions. The FDIC Q2 2010 Quarterly Banking Profile will be released in a two weeks.
The unofficial count is close, but is slightly lower than the official count - probably mostly due to timing issues - so I expect the FDIC to list around 840 to 870 institutions at the end of Q2.


