 RSS Feed
 by Calculated Risk on 8/04/2010 02:17:00 PM
Wednesday, August 04, 2010
BEA: July light vehicle sales rate 11.5 million SAAR
I usually use the light vehicle estimate from AutoData for the seasonally adjusted annual rate. Their estimate is usually very close, however since the BEA didn't put out the adjustment factors in advance, AutoData estimated sales at 12 million SAAR in July with a notice that this might be revised.
The BEA released the sales numbers this morning, and the sales rate was 11.52 million (below most analyst estimates). This is a significant difference and worth mentioning.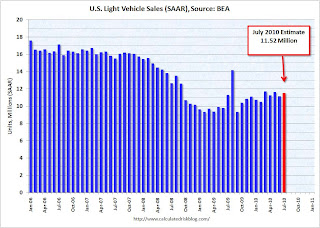 Click on graph for larger image in new window.
This graph shows the historical light vehicle sales (seasonally adjusted annual rate) from the BEA.
This was below most forecasts of around 11.6 to 11.8 million SAAR, and is below the levels of March and May earlier this year.
Fed Research Supports Mortgage Cram Downs
by Calculated Risk on 8/04/2010 12:30:00 PM
Thomas J. Fitzpatrick IV and James B. Thomson at the Cleveland Fed provide new research that supports residential mortgage cram downs: Stripdowns and Bankruptcy: Lessons from Agricultural Bankruptcy Reform . A few excerpts:
[One proposal is] to revise Chapter 13 of the bankruptcy code to allow judges to modify mortgages on primary residences. The type of loan modification under consideration is known as a loan cramdown or loan stripdown because the judge would reduce the balance of the secured claim to the current market value of the house, turning the remaining balance of the mortgage into an unsecured claim (which would receive the same proportionate payout as other unsecured debts included in the bankruptcy petition).And the authors discuss how this worked for farm loans:
The actual negative impact of the farm stripdown legislation was minor. Although the legislation created a special chapter in the Bankruptcy Code for farmers and allowed stripdowns on primary residences, it did not change the cost and availability of farm credit dramatically. In fact, a United States General Accounting Office (1989) survey of a small group of bankers found that none of them raised interest rates to farmers more than 50 basis points. While this rate change may have been a response to the Chapter 12, it is also consistent with increasing premiums due to the economic environment. This suggests that the changes in the cost and availability of farm credit after the bankruptcy reform differed little from what would be expected in that economic environment, absent reform.It appears the cram down legislation was very effective.
What was most interesting about Chapter 12 is that it worked without working. According to studies by Robert Collender (1993) and Jerome Stam and Bruce Dixon (2004), instead of flooding bankruptcy courts, Chapter 12 drove the parties to make private loan modifications. In fact, although the U.S. General Accounting Office reports that more than 30,000 bankruptcy filings were expected the year Chapter 12 went into effect, only 8,500 were filed in the first two years. Since then, Chapter 12 bankruptcy filings have continued to fall.
And residential mortgage cram downs are not new. The law was changed in 1978 and cram downs eliminated in 1993.
In 2007 my former co-blogger and mortgage banker Tanta explained the history of mortgage cram downs and argued they would be helpful now: Just Say Yes To Cram Downs
I am fully in favor of removing restrictions on modifications of mortgage loans in Chapter 13, but not necessarily because that helps current borrowers out of a jam. I'm in favor of it because I think it will be part of a range of regulatory and legal changes that will help prevent future borrowers from getting into a lot of jams, which is to say that it will, contra MBA, actually help "stabilize" the residential mortgage market in the long term. Any industry that wants special treatment under the law because of the socially vital nature of its services needs to offer socially viable services, and since the industry has displayed no ability or willingness to quit partying on its own, then treat it like any other partier under BK law.Looking at the Fed research, it appears Tanta's argument about mortgage cram downs bringing stability and discipline to the residential mortgage market long term would be correct. It is never too late: Say yes to cram downs!
ISM Non-Manufacturing Index shows expansion in July
by Calculated Risk on 8/04/2010 10:00:00 AM
The July ISM Non-manufacturing index was at 54.3%, up from 53.8% in June - and above expectations of 53.7%. The employment index showed expansion in July at 50.9%. Click on graph for larger image in new window.
This graph shows the ISM non-manufacturing index (started in January 2008) and the ISM non-manufacturing employment diffusion index.
The employment index is at the highest level since December 2007.
From the Institute for Supply Management: July 2010 Non-Manufacturing ISM Report On Business®
Economic activity in the non-manufacturing sector grew in July for the seventh consecutive month, say the nation's purchasing and supply executives in the latest Non-Manufacturing ISM Report On Business®.
The report was issued today by Anthony Nieves, C.P.M., CFPM, chair of the Institute for Supply Management™ Non-Manufacturing Business Survey Committee; and senior vice president — supply management for Hilton Worldwide. "The NMI (Non-Manufacturing Index) registered 54.3 percent in July, 0.5 percentage point higher than the 53.8 percent registered in June, indicating continued growth in the non-manufacturing sector at a slightly faster rate. The Non-Manufacturing Business Activity Index decreased 0.7 percentage point to 57.4 percent, reflecting growth for the eighth consecutive month. The New Orders Index increased 2.3 percentage points to 56.7 percent, and the Employment Index increased 1.2 percentage points to 50.9 percent, reflecting growth after one month of contraction. The Prices Index decreased 1.1 percentage points to 52.7 percent in July, indicating that prices are still increasing but at a slower rate than in June. According to the NMI, 13 non-manufacturing industries reported growth in July. Respondents' comments are mixed. They vary by industry and company, with a tilt toward cautious optimism about business conditions."
emphasis added
ADP: Private Employment increases 42,000 in July
by Calculated Risk on 8/04/2010 08:15:00 AM
ADP reports:
Nonfarm private employment increased 42,000 from June to July 2010 on a seasonally adjusted basis, according to the ADP National Employment Report®. The estimated change of employment from May to June was revised up slightly, from the previously reported increase of 13,000 to an increase of 19,000.Note: ADP is private nonfarm employment only (no government jobs).
July’s rise in private employment was the sixth consecutive monthly gain. However, over those six months increases have averaged a modest 37,000, with no evidence of acceleration.
Unlike the estimate of total establishment employment to be released on Friday by the Bureau of Labor Statistics (BLS), today’s figure does not include the effects of federal hiring — and now firing — for the 2010 Census.
The consensus was for ADP to show an increase of about 35,000 private sector jobs in July, so this was slightly above consensus.
The BLS reports on Friday, and the consensus is for a decrease of 70,000 payroll jobs in July, on a seasonally adjusted (SA) basis, with the loss of around 145,000 temporary Census 2010 jobs (+75,000 ex-Census).
MBA: Mortgage Purchase Applications increase slightly last week
by Calculated Risk on 8/04/2010 07:24:00 AM
The MBA reports: Mortgage Applications Increase in Latest MBA Weekly Survey
The Refinance Index increased 1.3 percent from the previous week. The seasonally adjusted Purchase Index increased 1.5 percent from one week earlier. This third straight weekly increase in the Purchase Index was driven by government purchase applications which increased 3.4 percent from last week, while conventional purchase applications were essentially flat.
...
The average contract interest rate for 30-year fixed-rate mortgages decreased to 4.60 percent from 4.69 percent, with points increasing to 0.93 from 0.88 (including the origination fee) for 80 percent loan-to-value (LTV) ratio loans.
 Click on graph for larger image in new window.
This graph shows the MBA Purchase Index and four week moving average since 1990.
The purchase index has increased slightly for three straight weeks - but is still 40% below the level of the last week of April (and about 33% below the last week of April using the 4-week average).
This recent collapse in the purchase index has already shown up as a decline in new home sales (counted when the contract is signed), and will show up in the July and August existing home sales reports (counted at close of escrow).
Tuesday, August 03, 2010
D.R. Horton conference call comments: No more tax credits!
by Calculated Risk on 8/03/2010 08:15:00 PM
A few quotes from homebuilder D.R. Horton conference call today ... (ht Mike in Long Island, Zach, Pat)
"Frankly, I don't want the tax credits to be re-enacted or be re-created or extended," CEO Donald Tomnitz said. "We want to get back to a normalized market. It's a lot easier ... designing your business with the current demand as opposed to having any kind of stimuluses or incentives to create abnormal demand."CR Note: As I've noted before, the housing tax credit was a clear and unequivocal failure. Not only did most of the benefit go to people who were going to buy anyway, but the credit didn't reduce the overall supply. The credit just incentivized some people to move - and pulled some sales forward - and to the extent the credit went to new home sales, it was actually counterproductive by increasing the excess supply.
On the cancellation rate increase to 28%:
"I was surprised it only increased to 28%. But nevertheless we wanted to give every buyer the opportunity to buy and close on a home. And so if they had a pulse and they were warm, we wrote 'em," Tomnitz said. "And so as a result we did have some cancellations because people couldn't qualify."CR Note: A normal cancellation rate for Horton is in the 16% to 20% range.
On the outlook:
"The next 12 to 24 months will be challenging in the homebuilding industry."CR Note: Yes. Probably more home builders will go bankrupt during the "recovery" than during the bust.
Personal Bankruptcy Filings up 9% in July
by Calculated Risk on 8/03/2010 05:42:00 PM
From the American Bankruptcy Institute: July Consumer Bankruptcy Filings up 9 Percent from last Month, Year
The 137,698 consumer bankruptcies filed in July represented a 9 percent increase nationwide over the 126,434 filings recorded in July 2009, according to the American Bankruptcy Institute (ABI), relying on data from the National Bankruptcy Research Center (NBKRC). NBKRC’s data also showed that the July consumer filings represented a 9 percent increase from the 126,270 consumer filings recorded in June 2010. Chapter 13 filings constituted 28 percent of all consumer cases in July, a slight increase from June.
“Debt burdens, unemployment and an uncertain economic climate continue to weigh on consumers,” said ABI Executive Director Samuel J. Gerdano. “The pace of consumer filings this year remains on track to top 1.6 million filings.”
 Click on graph for larger image in new window.
This graph shows the non-business bankruptcy filings by quarter using monthly data from the ABI and previous quarterly data from USCourts.gov.
Excluding 2005, when the so-called "Bankruptcy Abuse Prevention and Consumer Protection Act of 2005" was enacted (really a pro-lender act), the record year was in 2003 when 1.62 million personal bankruptcies were filed. This year will be close to that level.
U.S. Light Vehicle Sales 12.1 Million* SAAR in July
by Calculated Risk on 8/03/2010 04:00:00 PM
UPDATE at 5:25 PM ET, 8/3/2010: AutoData revised their estimate to 11.98 million SAAR.
Based on an estimate from Autodata Corp, light vehicle sales were at a 12.06 million SAAR in July. That is up 7.5% from July 2009, and up 9.1% from the June sales rate.
IMPORTANT: AutoData notes: "*The July 2010 SAAR factors have been estimated by averaging the factors from July 2007, July 2008 and July 2009. We will restate the July 2010 SAAR after the Bureau of Economic Analysis publishes the appropriate factors." Click on graph for larger image in new window.
This graph shows the historical light vehicle sales (seasonally adjusted annual rate) from the BEA (blue) and an estimate for July (red, light vehicle sales of 12.06 million SAAR from Autodata Corp).
The second graph shows light vehicle sales since the BEA started keeping data in 1967. Note: dashed line is current month sales rate.
Excluding the surge in sales during August 2009 (cash-for-clunkers), this is the highest sales rate since September 2008.
This was above most forecasts of around 11.6 to 11.8 million SAAR. Light truck sales were up significantly compared to July 2009.
Pending and Existing Home Sales
by Calculated Risk on 8/03/2010 02:23:00 PM
Here is a graph of the NAR's Pending Home Sales index (left axis) and existing home sales (left axis on a seasonally adjusted annual rate basis): Click on graph for large image.
Note: the scale doesn't start at zero to better show the change.
A few key points:
1) The Pending Home sales index leads existing home sales by about 45 days.
2) The peaks in the Pending Home sales index are related to the home buyer tax credit. For the 2nd tax credit, the peak for the pending index was much higher than the existing home sales spike. One reason is that short sales sometimes take longer to close - and since the tax credit closing date was extended, these sales will close later. But probably the more important reasons are: a) appraisals are coming in below the agreed upon price, because the asking prices for similar homes have fallen since the end of April, and b) some buyers put in offers on two homes to beat the tax credit deadline, and then decided which house to buy.
3) It is hard to tell from the Pending Home sales index how far existing home sales will fall in July and August. However, with the Pending home sales index below the lows of early 2009, a first guess might be 4.5 million or so. (Existing home sales in Jan 2009 were 4.49 million SAAR).
4) With July inventory of about 4 million units and sales of 4.5 million units (SAAR), the months-of-supply will be just under 11 months and that will put downward pressure on prices. (see Existing Homes: Double Digit Months-of-Supply Watch )
General Motors: Sales up sharply compared to July 2009
by Calculated Risk on 8/03/2010 11:00:00 AM
From General Motors: Chevrolet-Buick-GMC-Cadillac Sales Up 25 Percent in July.
General July sales for Chevrolet, Buick, GMC and Cadillac increased by a combined 25 percent to 199,432 units.There was one more selling day in July 2010, so this increase is overstated a little. Note: this is just these brands too.
Note: in July 2009 U.S. light vehicle sales rose to 11.2 million (SAAR) from 9.7 million (SAAR) in June 2009. This increase was related to "Cash-for-clunkers". General Motors didn't emerge from bankruptcy until July 10, 2009, so GM will probably have the best year-over-year comparison of the major automakers.
I'll add reports from the other major auto companies as updates to this post.
Update 1: From MarketWatch: Ford U.S. July sales up 3.1% to 170,411 vehicles
Update 2: From MarketWatch: Chrysler U.S. July sales rise 5% to 93,313 units
Update 3: From MarketWatch: Toyota U.S. July sales fall 3.2% to 169,224 units
NOTE: Once all the reports are released, I'll post a graph of the estimated total July sales (SAAR: seasonally adjusted annual rate) - usually around 4 PM ET. Most estimates are for an increase to 11.6 to 11.8 million SAAR in July from the 11.1 million SAAR in June.
Pending Home fall to record series low in June
by Calculated Risk on 8/03/2010 10:02:00 AM
From the NAR: Pending Home Sales Ease in Post-Tax Credit Market
The Pending Home Sales Index, a forward-looking indicator, declined 2.6 percent to 75.7 based on contracts signed in June from an upwardly revised level of 77.7 in May [revised from 77.6], and is 18.6 percent below June 2009 when it was 93.0. The data reflects contracts and not closings, which normally occur with a lag time of one or two months.This decline was expected and suggests existing home sales - reported at closing - will fall sharply in July and probably a little further in August.
NAR chief economist Lawrence Yun says: “Over the short term, inventory will look high relative to home sales."
Yes, the months-of-supply will be in double digits, and that will put downward pressure on prices.
Note: This is a record low for this series that started in 2001.
Personal Income, Spending flat in June
by Calculated Risk on 8/03/2010 08:30:00 AM
From the BEA: Personal Income and Outlays, June 2010
Personal income increased $3.0 billion, or less than 0.1 percent ... Personal consumption expenditures (PCE) decreased $2.9 billion, or less than 0.1 percent.
...
Real PCE -- PCE adjusted to remove price changes -- increased 0.1 percent in June, compared with an increase of 0.2 percent in May.
...
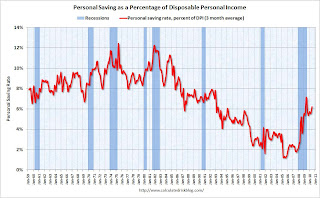
Personal saving as a percentage of disposable personal income was 6.4 percent in June
 Click on graph for large image.
This graph shows the saving rate starting in 1959 (using a three month trailing average for smoothing) through the June Personal Income report. The saving rate increased to 6.4% in June (increased to 6.2% using a three month average).
I expect the saving rate to rise some more over the next year, perhaps to 8% or so - keeping the pace of PCE growth below income growth. But the good news is the saving rate is much higher than orginally estimated, so much of the expected drag from an increase in the saving rate has already happened.
Monday, August 02, 2010
WSJ: FOMC considering reinvesting when MBS Matures
by Calculated Risk on 8/02/2010 11:59:00 PM
From Jon Hilsenrath at the WSJ: Fed Mulls Symbolic Shift
Federal Reserve officials will consider a modest but symbolically important change in the management of their massive securities portfolio ...This seems unlikely to happen at the Aug 10th meeting based on Chairman Bernanke's speech this morning, and his testimony to Congress less than two weeks ago.
The issue: Whether to use cash the Fed receives when its mortgage-bond holdings mature to buy new mortgage or Treasury bonds, instead of allowing its portfolio to shrink gradually, as it is expected to do in the months ahead. ...
Buying new bonds with this stream of cash from maturing bonds—projected at about $200 billion by 2011—would show the public and markets that the Fed is seeking ways to support economic growth.
Krugman: "Why Is Deflation Bad?"
by Calculated Risk on 8/02/2010 08:15:00 PM
A few excerpts from Professor Krugman: Why Is Deflation Bad?
There are actually three different reasons to worry about deflation, two on the demand side and one on the supply side.There are more details at Krugman's post.
So first of all: when people expect falling prices, they become less willing to spend, and in particular less willing to borrow. ....
A second effect: even aside from expectations of future deflation, falling prices worsen the position of debtors, by increasing the real burden of their debts. Now, you might think this is a zero-sum affair, since creditors experience a corresponding gain. But as Irving Fisher pointed out long ago (pdf), debtors are likely to be forced to cut their spending when their debt burden rises, while creditors aren’t likely to increase their spending by the same amount. ...
Finally, in a deflationary economy, wages as well as prices often have to fall – and it’s a fact of life that it’s very hard to cut nominal wages — there’s downward nominal wage rigidity. ...
Now, alert readers will have noticed that none of these arguments abruptly kicks in when the inflation rate goes from +0.1% to -0.1%. Even with low but positive inflation the zero lower bound may be binding; inflation that comes in lower than borrowers expected leaves them with a worse debt burden than they were counting on, even if the inflation is positive; and since relative wages are shifting around all the time, some nominal wages will have to fall even if the overall rate of inflation is a bit above zero.
The third point on sticky wages (and prices) is very important. Relative wages are being adjusted all the time in the economy. With some inflation, real wages can be cut (if needed) by keeping wage increases below the inflation rate. However, if inflation is near zero - or there is deflation - many companies that need to cut wages a little will have difficulty competing since it is difficult to cut nominal wages. This is a key reason why a little inflation is better than no inflation. Of course too much inflation is really bad too, but that isn't the problem right now.
Preview: Auto Sales, Pending Home Sales, Aug 10th FOMC Meeting
by Calculated Risk on 8/02/2010 05:04:00 PM
1) July Auto Sales. Light vehicle sales will be reported tomorrow by the automakers. In the weekly schedule, I noted that "expectations are for about a 11.6 million SAAR for light vehicles in July – up from the 11.1 million sales rate in June." There is a pretty wide range in forecasts:
From Bloomberg: Auto Sales May Rise to Highest of Year on U.S. Closeout Deals
Industrywide deliveries ... may reach an annualized rate of 11.9 million vehicles in July, the average of eight analysts’ estimates compiled by Bloomberg. That would be 5.3 percent higher than last year’s 11.3 million pace and the best month since August 2009 ...And from Reuters: Auto Sales in US Expected to Rise Slightly in July
Analysts surveyed by Reuters expected an average annualized sales rate of 11.4 million vehicles in July, up slightly from 11.1 million in June and 11.2 million a year earlier. Forecasts for July range from 11.1 million to 12.1 million vehicles.2) Pending Home Sales: The consensus is for a slight decline in the pending homes sales index for June, after the 30% drop decline in May. Lawler expects about a 3% decline (based on limited data).
3) FOMC meeting on August 10th: There has been some speculation that the FOMC would ease monetary policy next week. As an example from CNBC: Fed Will Ease Monetary Policy on Aug. 10: Economist
Japan's Nomura has become the first investment bank to predict the Federal Reserve will begin to ease monetary policy following the recent slowdown in growth in the world's biggest economy.Given Chairman Bernanke's comments this morning, this seems very unlikely. Bernanke's speech was fairly positive, and I think the FOMC statement might note that growth has slowed, but the "extended period" wording will probably remain the same - and there will probably be no mention of further easing. The following was the key sentence in Bernanke's speech:
The deterioration in expectations for growth and inflation argues for an easing of monetary policy, Paul Sheard, the global chief economist at Nomura, wrote in his latest report.
"In particular, in the household sector, growth in real consumer spending seems likely to pick up in coming quarters from its recent modest pace, supported by gains in income and improving credit conditions."Unless there is a huge downside surprise this week, I think the FOMC statement will basically remain the same.
Foreclosure Auction Investing Gone Wrong
by Calculated Risk on 8/02/2010 02:54:00 PM
Usually when auction buyers lose money it is because they either overvalue the home, or the home was seriously damaged. However this is an unusual story from Carolyn Said at the San Francisco Chronicle: Winning bid on mortgage buys family heartache (ht Jesse)
Roberta and Randall Strand took $97,606 out of their paid-off house to buy a foreclosed home at a courthouse auction. Five months later, they found out they actually bought the second mortgage, and that the bank planned to foreclose on the first mortgage, leaving them out in the cold.This is pretty easy to check. In this case the lender (Wachovia, now Wells Fargo) held both the 1st and 2nd and foreclosed on both. Because of timing issues, the 2nd went to the court house steps first - and the buyers are now out around $100,000. Well, probably less ...
Wells and the family negotiated a confidential settlement and were finalizing details late last week.
Private Construction Spending declines in June
by Calculated Risk on 8/02/2010 12:06:00 PM
Overall construction spending increased slightly in June, and private construction spending, both residential and non-residential, decreased in June. Click on graph for larger image in new window.
This graph shows private residential and nonresidential construction spending since 1993. Note: nominal dollars, not inflation adjusted.
Residential spending is now 62% below the peak of early 2006.
Private non-residential construction was revised down for both April and May, and spending is now 35% below the peak of late 2008.
From the Census Bureau: June 2010 Construction at $836.0 Billion Annual Rate
The U.S. Census Bureau of the Department of Commerce announced today that construction spending during June 2010 was estimated at a seasonally adjusted annual rate of $836.0 billion, 0.1 percent (±1.6%)* above the revised May estimate of $834.8 billion.I expect:
...
Spending on private construction was at a seasonally adjusted annual rate of $527.6 billion, 0.6 percent (±1.3%)* below the revised May estimate of $530.9 billion. Residential construction was at a seasonally adjusted annual rate of $258.3 billion in June, 0.8 percent (±1.3%)* below the revised May estimate of $260.3 billion. Nonresidential construction was at a seasonally adjusted annual rate of $269.3 billion in June, 0.5 percent (±1.3%)* below the revised May estimate of $270.6 billion.
Residential spending will probably exceed non-residential later this year (or early 2011), but that will be mostly because of weakness in non-residential construction, as opposed to any significant increases in residential spending.
Bernanke: Challenges for the Economy and State Governments
by Calculated Risk on 8/02/2010 10:18:00 AM
From Fed Chairman Ben Bernanke: Challenges for the Economy and State Governments
On the economy:
While the support to economic activity from stimulative fiscal policies and firms' restocking of their inventories will diminish over time, rising demand from households and businesses should help sustain growth. In particular, in the household sector, growth in real consumer spending seems likely to pick up in coming quarters from its recent modest pace, supported by gains in income and improving credit conditions. In the business sector, investment in equipment and software has been increasing rapidly, in part as a result of the deferral of capital outlays during the downturn and the need of many businesses to replace aging equipment. At the same time, rising U.S. exports, reflecting the expansion of the global economy and the recovery of world trade, have helped foster growth in the U.S. manufacturing sector.On state and local governments:
To be sure, notable restraints on the recovery persist. The housing market has remained weak, with the overhang of vacant or foreclosed houses weighing on home prices and new construction. Similarly, poor economic fundamentals and tight credit are holding back investment in nonresidential structures, such as office buildings, hotels, and shopping malls.
Importantly, the slow recovery in the labor market and the attendant uncertainty about job prospects are weighing on household confidence and spending. After two years of job losses, private payrolls expanded at an average of about 100,000 per month during the first half of this year, an improvement but still a pace insufficient to reduce the unemployment rate materially. In all likelihood, significant time will be required to restore the nearly 8-1/2 million jobs that were lost over 2008 and 2009. Moreover, nearly half of the unemployed have been out of work for longer than six months.
Cuts in state and local programs and employment are also weighing on economic activity. These cuts principally reflect the historically large decreases in state tax revenues during the recession. Sales tax revenues have declined with household and business spending, and income tax revenues have been hit by drops in wages and salaries, capital gains, and corporate profits. In contrast, property tax revenues collected by local governments generally held up well through the beginning of this year, although reappraisals of the values of homes and commercial properties may affect those collections in the future.This is a fairly positive outlook for the overall economy, but less so for local governments.
...
With revenues down and Medicaid spending up, other categories of spending by state governments have been tightly squeezed. Over the past year, numerous state governments have laid off or furloughed employees, decreased capital spending, and reduced aid to local governments. Indeed, state and local payrolls have fallen by more than 200,000 jobs from their peak near the end of 2008. Some states have also raised taxes, but the weak economy has made it difficult to find significant new revenues.
Assistance from the federal government, especially through the fiscal stimulus package, has eased, but certainly not eliminated, the budget difficulties faced by states. Although states and localities will continue to receive significant aid this year, that source of help will be winding down next year.
On a more positive note, state and local tax revenues seem set to increase as economic activity expands.
ISM Manufacturing Index declines in July
by Calculated Risk on 8/02/2010 10:00:00 AM
PMI at 55.5% in July down from 56.2% in June.
From the Institute for Supply Management: July 2010 Manufacturing ISM Report On Business®
Economic activity in the manufacturing sector expanded in July for the 12th consecutive month, and the overall economy grew for the 15th consecutive month, say the nation's supply executives in the latest Manufacturing ISM Report On Business®.
The report was issued today by Norbert J. Ore, CPSM, C.P.M., chair of the Institute for Supply Management™ Manufacturing Business Survey Committee. "Manufacturing continued to grow during July, but at a slightly slower rate than in June. Employment, supplier deliveries and inventories improved during the month and reduced the impact of a month-over-month deceleration in new orders and production. July marks 12 consecutive months of growth in manufacturing, and indications are that demand is still quite strong in 10 of 18 industries. The prices that manufacturers paid for their inputs were slightly higher but stable, with only a few items on the short supply list."
...
ISM's New Orders Index registered 53.5 percent in July, which is a decrease of 5 percentage points when compared to the 58.5 percent reported in June.
...
ISM's Employment Index registered 58.6 percent in July, which is 0.8 percentage point higher than the 57.8 percent reported in June. This is the eighth consecutive month of growth in manufacturing employment.
emphasis added
Sunday, August 01, 2010
NY Times: China State-owned companies move into real estate development
by Calculated Risk on 8/01/2010 08:52:00 PM
From David Barboza at the NY Times: State-Owned Groups Fuel China’s Real Estate Boom
All around the nation, giant state-owned oil, chemical, military, telecom and highway groups are bidding up prices on sprawling plots of land for big real estate projects unrelated to their core businesses.The story mentions a salt company building luxury high rises ... that seems very speculative!
...
By driving up property prices, the state-owned companies, which are ultimately controlled by the national government, are working at cross-purposes with the central government’s effort to keep China’s real estate boom from becoming a debt-driven speculative bubble ...
A repeat: Early this morning Part 5C of the Sovereign Default series: Some Policy Options, Good and Bad
Yesterday: Negative Equity Breakdown. The authors estimate there are 4.1 million homeowners with more than 50% negative equity, and another 5 million with 20% to 50% negative equity.
And How do you put recession bars on graphs using Excel?


