 RSS Feed
 by Calculated Risk on 5/22/2010 09:01:00 AM
Saturday, May 22, 2010
Fed's Dudley on the Economy
From NY Fed President William Dudley's commencement speech at New College of Florida:
[T]he recovery is not likely to be as robust as we would like for several reasons.A few comments:
First, households are still in the process of deleveraging. The housing boom created paper wealth that households borrowed against. This pushed the consumption share of nominal gross domestic product to a record high of about 70 percent. When the boom turned into a bust, those paper gains evaporated. In fact, many households now find that the value of their homes is less than the amount of their mortgage debt. This has created a difficult time for many families and has caused the hangover to last longer.
Second, the banking system is still under significant stress. This is particularly the case for small- and medium-sized banks that have significant exposure to commercial real estate loans. This stress means that banks have been slow to ease credit standards as the economy has moved from recession to recovery.
Third, some of the sources that have supported the nascent recovery are temporary. The big swing from inventory liquidation during the recession back to accumulation will soon end as inventory levels come back into better balance with sales. And fiscal stimulus from the federal government is subsiding and will soon reverse.
...
In this environment, finding a job will be tough, but when you hit the pavement remember that the job market is improving. Don't get discouraged.
First, the household "deleveraging" seemed to start last year, but consumers were back to spending more than they earned in Q1. Personal consumption expenditures (PCE) increased to over 71% of GDP in Q1 - higher than the 70% during the boom that Dudley mentioned. Some of this increase in PCE was due to government transfer payments (all of the increase in income in Q1 came from government transfer payments). I still think the personal saving rate will rise over the next year or two - and that will keep growth in PCE below the growth in income.
Second, I think the transitory inventory boost is about over. There were hints of this in the manufacturing surveys last week from the Federal Reserve Banks of Philadelphia and New York - and also in the Census Bureau's Manufacturing and Trade inventories report for March. Also, as Dudley notes, the boost from the stimulus "is subsiding and will soon reverse" (the peak stimulus spending is right now - in Q2 2010).
These are significant headwinds, and I think growth will slow in the 2nd half of 2010.
Friday, May 21, 2010
Unofficial Problem Bank list hits 737
by Calculated Risk on 5/21/2010 11:49:00 PM
This is an unofficial list of Problem Banks compiled only from public sources.
Here is the unofficial problem bank list for May 21, 2010.
Changes and comments from surferdude808:
As anticipated, the OCC released its actions for April 2010, which contributed to an increase in the number of institutions on the Unofficial Problem Bank List. The list includes 737 institutions with aggregate assets of $363.5 billion, up from 725 institutions with assets of $363.1 billion last week.
The FDIC released its industry profile this week and they reported 775 institutions with assets of $431 billion on the official problem bank list. With the industry release, we were able to update assets for the first quarter of 2010. For institutions on the unofficial list last week, their combined assets fell by $8.3 billion during the quarter.
Notable additions this week include City National Bank of Florida, Miami, FL ($4.6 billion); The National Republic Bank of Chicago, Chicago, IL ($1.3 billion); Butte Community Bank, Chico, CA ($523 million Ticker: CVLL). Other additions include the add back of Mountain West Bank, National Association, Helena, MT ($795 million Ticker: MTWF); and Pikes Peak National Bank, Colorado Springs, CO ($84 million), which were removed from the May 7th list when the OCC terminated their respective Supervisory Agreements. These agreements were replaced by stronger Consent Orders.
The only removal is the failed Pinehurst Bank. Other changes are for name changes with the Bank of Lenox, Lenox, GA now known as The Trust Bank; Goshen Community Bank, Goshen, IN now known as Indiana Community Bank; and Lehman Brothers Bank, FSB, Wilmington, DE now known as Aurora Bank FSB.
"Love, Your Broken Home"
by Calculated Risk on 5/21/2010 10:01:00 PM
Since Sheila is done for the day ... a new song by Tim Miller on the mortgage crisis: "Love, Your Broken Home" (language)
Link to YouTube version if this doesn't load.
Bank Failure #73: Pinehurst Bank, St. Paul, Minnesota
by Calculated Risk on 5/21/2010 06:08:00 PM
The bill could not help Pinehurst.
Ineffectual
by Soylent Green is People
From the FDIC Coulee Bank, La Crosse, Wisconsin, Assumes All of the Deposits of Pinehurst Bank, St. Paul, Minnesota
As of March 31, 2010, Pinehurst Bank had approximately $61.2 million in total assets and $58.3 million in total deposits.Busy week ... but Friday is here!
...
The FDIC estimates that the cost to the Deposit Insurance Fund (DIF) will be $6.0 million.... Pinehurst Bank is the 73rd FDIC-insured institution to fail in the nation this year, and the sixth in Minnesota. The last FDIC-insured institution closed in the state was Access Bank, Champlin, on May 7, 2010.
Las Vegas land prices: 80% off peak
by Calculated Risk on 5/21/2010 04:13:00 PM
From Buck Wargo at the Las Vegas Sun: Foreclosures on land pushing prices back to 2003 levels
Since the peak of the market in 2007’s fourth quarter of $939,400 per acre for land not on the Strip, prices have fallen 80.6 percent, [Applied Analysis Principal Brian] Gordon said.And how about this ...
“I think we will continue to see downward pressure on prices for a while,” Gordon said. “The demand for raw land is somewhat weak. There is excess inventory of office, industrial and residential; and development activity has come to a near standstill in many of those sectors, so that they don’t need raw land.”
During the past year, many landowners have simply turned properties back to banks. ... “The reality is the landowners are finding themselves underwater and servicing their debt, and it has become a challenge,” Gordon said. “Many have opted to let the properties go back to the bank, not unlike what we have seen in the housing market.”More strategic defaults.
States: Mortgage Delinquency Rate vs. Unemployment Rate
by Calculated Risk on 5/21/2010 01:07:00 PM
Here is a scatter graph comparing the Q1 2010 delinquency rate for mortgage loans (including all loans in foreclosure) vs. the April unemployment rate for all states.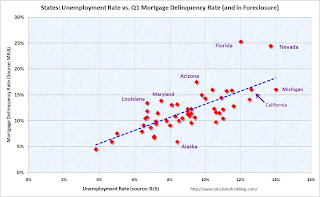 Click on graph for larger image in new window.
There definitely is a relationship between delinquency rates and the unemployment rate, although a couple of states really stand out; Florida and Nevada. Florida has a high number of delinquencies because of state specific foreclosure laws - it takes forever to foreclose.
The delinquency rate in Nevada is also very high, probably because of the large percentage of homeowners with negative equity. Both states might also have higher than expected delinquency rates because of significant investor activity during the housing bubble.
This does suggest that a large part of the delinquency problem is related to unemployment.
Note: Sorry I couldn't label all the states. Here are graphs by state for unemployment rates and mortgage delinquency rates.
April State Unemployment Rates: California and Nevada at series highs
by Calculated Risk on 5/21/2010 10:00:00 AM
From the BLS: Regional and State Employment and Unemployment Summary
Regional and state unemployment rates were generally little changed or slightly lower in April. Thirty-four states and the District of Columbia recorded unemployment rate decreases, 6 states had increases, and 10 states had no change. ...
Michigan again recorded the highest unemployment rate among the states, 14.0 percent in April. The states with the next highest rates were Nevada, 13.7 percent; California, 12.6 percent; and Rhode Island, 12.5 percent. North Dakota continued to register the lowest jobless rate, 3.8 percent, followed by South Dakota and Nebraska, 4.7 and 5.0 percent, respectively. The rate in Nevada set a new series high.
emphasis added
 Click on graph for larger image in new window.
This graph shows the high and low unemployment rates for each state (and D.C.) since 1976. The red bar is the current unemployment rate (sorted by the current unemployment rate).
Sixteen states and D.C. now have double digit unemployment rates. New Jersey is close.
Nevada set a new series high; California tied the previous record (since 1976).
Bundestag Approves Bailout, possible Strike in Spain
by Calculated Risk on 5/21/2010 08:41:00 AM
From the Financial Times: Bundestag backs eurozone rescue
Germany’s lower house of parliament on Friday narrowly approved Berlin’s contribution to the European Union’s €750bn package of loan guarantees ...The upper house, the Bundesrat, is expected to vote today and passage is expected.
From Reuters: Spain to 'probably' call general strike-report
Spain's largest workers union Comisiones Obreras could call a general strike to protest the government's austerity measures, its head Ignacio Fernandez Toxo said on Friday ...Sounds like just a one day strike.
The futures are off this morning ... but bouncing around.
Thursday, May 20, 2010
Krugman: Lost Decade Looming?
by Calculated Risk on 5/20/2010 11:58:00 PM
From Paul Krugman in the NY Times: Lost Decade Looming?
... Recent data don’t suggest that America is heading for a Greece-style collapse of investor confidence. Instead, they suggest that we may be heading for a Japan-style lost decade, trapped in a prolonged era of high unemployment and slow growth.The two key numbers: the unemployment rate is at 9.9% and inflation, by all key measures, is low and declining (CPI, core CPI, PCE deflator trimmed mean CPI, etc). Of the two problems, unemployment is real and now - and inflation is a possible future threat. The focus needs to stay on the real and now.
... As of Thursday, the 10-year [Treasury] rate was below 3.3 percent. I wish I could say that falling interest rates reflect a surge of optimism about U.S. federal finances. What they actually reflect, however, is a surge of pessimism about the prospects for economic recovery, pessimism that has sent investors fleeing out of anything that looks risky ...
Low inflation, or worse yet deflation, tends to perpetuate an economic slump ... just ask the Japanese, who entered a deflationary trap in the 1990s and, despite occasional episodes of growth, still can’t get out. And it could happen here.
So what we should really be asking right now isn’t whether we’re about to turn into Greece. We should, instead, be asking what we’re doing to avoid turning Japanese.
...
Will the worst happen? Not necessarily. Maybe the economic measures already taken will end up doing the trick, jump-starting a self-sustaining recovery. Certainly, that’s what we’re all hoping.
Financial Reform: Final Senate Vote Soon
by Calculated Risk on 5/20/2010 07:52:00 PM
Update: Passed 59 to 39.
From Brady Dennis at the WaPo: Senate clears way to vote on financial reform
A final vote on the legislation could come later Thursday evening, congressional aides said. Party leaders were working to resolve a number of procedural hurdles, but it appeared that a series of votes could begin around 7:30 p.m.
"We're passing this bill tonight," said Jim Manley, spokesman to Majority Leader Harry M. Reid (D-Nev.). "We're finishing this tonight."
Market Update
by Calculated Risk on 5/20/2010 03:45:00 PM
 Click on graph for larger image in new window.
The first graph shows the S&P 500 since 1990 (this excludes dividends).
The dashed line is the closing price today. The S&P 500 was first at this level in March 1998; over 12 years ago. 
The second graph is from Doug Short of dshort.com (financial planner): "Four Bad Bears".
Note that the Great Depression crash is based on the DOW; the three others are for the S&P 500.
As an aside, once again the Shanghai composite index appeared to lead both the S&P 500 and oil prices. Not only are there issues in Europe, but China is slowing ...
Freddie Mac: Near Record Low Mortgage Rates
by Calculated Risk on 5/20/2010 02:45:00 PM
From Freddie Mac: Long- and Short-Term Mortgage Rates Fall Again This Week
Freddie Mac today released the results of its Primary Mortgage Market Survey® (PMMS®) in which the 30-year fixed-rate mortgage (FRM) averaged 4.84 percent with an average 0.7 point for the week ending May 20, 2010, down from last week when it averaged 4.93 percent. Last year at this time, the 30-year FRM averaged 4.82 percent. Once again, the 30-year FRM has not been lower since the week ending December 10, 2009, when it averaged 4.81 percent.The record low was 4.71% for the week of Dec 3, 2009 (series started in 1971).
The decline in mortgage rates is being driven by the decrease in the Treasury yield. The Ten Year treasury yield is currently at 3.26%.
 Click on graph for larger image in new window.
This graph shows the 30 year mortgage rates from the Freddie Mac survey, and the ten year Treasury yields, since January 2008.
The spread between the two series has widened slightly since the program ended.
From Bloomberg:
The difference between yields on the Fannie Mae securities and 10-year Treasuries widened 0.03 percentage point to 0.81 percentage point, Bloomberg data show. The spread reached 0.59 percentage point on March 29, the lowest on record ... The gap climbed to 0.86 percentage point May 6, after holding near that low in April.As an aside, the euro has strengthened a little and is close to 1.26 dollars today - up from 1.23 yesterday.
FDIC Q1 Banking Profile: 775 Problem Banks
by Calculated Risk on 5/20/2010 11:51:00 AM
The FDIC released the Q1 Quarterly Banking Profile today. The FDIC listed 775 banks with $431 billion in assets as “problem” banks in Q1, up from 702 banks with $403 billion in assets in Q4, and 305 banks and $220 billion in assets in Q1 of 2009.
Note: Not all problem banks will fail - and not all failures will be from the problem bank list - but this shows the problem is significant and still growing.
The Unofficial Problem Bank List shows 725 problem banks - and will continue to increase as more formal actions (or hints of pending actions) are released. Click on graph for larger image in new window.
This graph shows the number of FDIC insured "problem" banks since 1990.
All data is year end except Q1 2010.
The 775 problem banks reported at the end of Q1 is the highest since June 30, 1993, when the number of "problem" institutions totaled 793.
The FDIC is still on pace for 1,000 problem banks by the end of the year, although it also depends on how many banks are removed from the list.  The second graph shows the assets of "problem" banks since 1990.
The assets of problem banks are the highest since June 30, 1993 when the assets of "problem" institutions were $467 billion.
Philly Fed Index increases slightly in May, New orders index declines
by Calculated Risk on 5/20/2010 10:00:00 AM
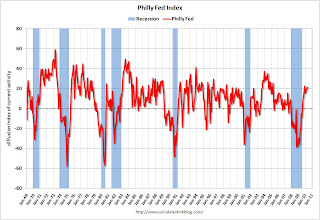
Here is the Philadelphia Fed Index released today: Business Outlook Survey.
The survey’s broadest measure of manufacturing conditions, the diffusion index of current activity, increased slightly from 20.2 in April to 21.4 this month. The index has now edged higher for four consecutive months and has remained positive for the ninth consecutive month (see Chart). Although still positive and suggesting growth, indexes for new orders and shipments showed a mixed pattern this month: The new orders index fell 8 points, while the shipments index increased 10 points. The current inventory index decreased 10 points and fell into negative territory, suggesting declines in inventories. Indexes for unfilled orders and delivery times were both negative this month, suggesting some weakening in activity from April.
emphasis added
 Click on graph for larger image in new window.
This graph shows the Philly index for the last 40 years.
The index has been positive for nine months now, after being negative or zero for 21 straight months.
The internals suggest manufacturing conditions are softening a little, as also suggested earlier by the New York Empire State manufacturing index.
Weekly Initial Unemployment Claims Increase 25,000
by Calculated Risk on 5/20/2010 08:30:00 AM
The DOL reports on weekly unemployment insurance claims:
In the week ending May 15, the advance figure for seasonally adjusted initial claims was 471,000, an increase of 25,000 from the previous week's revised figure of 446,000. The 4-week moving average was 453,500, an increase of 3,000 from the previous week's unrevised average of 450,500.
...
The advance number for seasonally adjusted insured unemployment during the week ending May 8 was 4,625,000, a decrease of 40,000 from the preceding week's revised level of 4,665,000.
 Click on graph for larger image in new window.
This graph shows the 4-week moving average of weekly claims since 1971.
The four-week average of weekly unemployment claims increased this week by 3,000 to 453,500.
The dashed line on the graph is the current 4-week average. The 4-week average first declined to this level at the end of December 2009, and has been at this level for almost five months. The current level of 471,000 (and 4-week average of 453,500) is still high, and suggests ongoing weakness in the labor market.
Wednesday, May 19, 2010
Summary: Busy Day
by Calculated Risk on 5/19/2010 09:44:00 PM
1) Press Release from the MBA: Delinquencies, Foreclosure Starts Fall in Latest MBA National Delinquency Survey
2) Comments from MBA conference call.
3) Two key graphs: Mortgage Delinquencies by Period and by State
The Euro is back up a little to 1.23 dollars.
And CNBC Pre-Market Data shows the S&P 500 futures off
Moody's: CRE Prices Decline 0.5% in March
by Calculated Risk on 5/19/2010 06:49:00 PM
Moody's reported today that the Moody’s/REAL All Property Type Aggregate Index declined 0.5% in March. This is a repeat sales measure of commercial real estate prices.
Below is a comparison of the Moodys/REAL Commercial Property Price Index (CPPI) and the Case-Shiller composite 20 index.
Notes: Beware of the "Real" in the title - this index is not inflation adjusted. Moody's CRE price index is a repeat sales index like Case-Shiller - but there are far fewer commercial sales - and that can impact prices. Click on graph for larger image in new window.
CRE prices only go back to December 2000.
The Case-Shiller Composite 20 residential index is in blue (with Dec 2000 set to 1.0 to line up the indexes).
Commercial real estate values are now down 25% over the last year, and down 42% from the peak in August 2007.
Mortgage Delinquencies by Period and by State
by Calculated Risk on 5/19/2010 04:01:00 PM
Much was made last quarter about the decline in the 30 day delinquency "bucket" (percent of loans between 30 and 60 days delinquent). Unfortunately the seasonally adjusted 30 day delinquency rate increased in Q1 2010.
Note: there are some questions about the seasonal adjustment, especially for the 90 day bucket since we've never seen numbers this high before, but the adjustment for the 30 and 60 day periods are probably reasonable. Click on graph for larger image in new window.
Loans 30 days delinquent increased to 3.45%, about the same level as in Q4 2008.
Delinquent loans in the 60 day bucket increased too, and are also close to the Q4 2008 level. This suggests that the pipeline is still filling up at a high rate, but slightly below the rates of early 2009.
The 90+ day and 'in foreclosure' rates are at record levels. Obviously the lenders have been slow to start foreclosure proceedings - and the 90+ day delinquent bucket is very full. Also lenders have been slow to actually foreclose - and the 'in foreclosure' bucket is at record levels.
These seriously delinquent loans are the 4.3 million loans MBA Chief Economist Jay Brinkmann referred to as the "shadow inventory" on the conference call this morning. Not all are really "shadow inventory" since some of these loans will be modified, some will be cured (probably very few), and some are probably already listed as short sales. But it does suggest a significant number of distressed sales coming.  The second graph shows the delinquency rate by state (red is seriously delinquent: 90+ days or in foreclosure, blue is delinquent less than 90 days).
This highlights a couple more points that Brinkmann made this morning: 1) the largest category of delinquent loans are fixed rate prime loans, and 2) this is not just a "sand state" problem. Brinkmann argued the foreclosure crisis is now being driven by economic problems as opposed to the bursting of the housing price bubble - and this is showing up in prime loans and all states. Although Florida and Nevada are very high, notice that the blue bar (new delinquencies) are higher in many other states.
Thirty four states and the District of Columbia have total delinquency rates over 10%. This is a widespread problem.
FOMC Minutes: On Greece and Housing
by Calculated Risk on 5/19/2010 02:00:00 PM
From the April 27-28, 2010 FOMC meeting.
On Greece:
[P]articipants saw the escalation of fiscal strains in Greece and spreading concerns about other peripheral European countries as weighing on financial conditions and confidence in the euro area. If other European countries responded by intensifying their fiscal consolidation efforts, the result would likely be slower growth in Europe and potentially a weaker global economic recovery. Some participants expressed concern that a crisis in Greece or in some other peripheral European countries could have an adverse effect on U.S. financial markets, which could also slow the recovery in this country.On Housing:
[T]he recovery in the housing market appeared to have stalled in recent months despite various forms of government support. Although residential real estate values seemed to be stabilizing and in some areas had reportedly moved higher, housing sales and starts had leveled off in recent months at depressed levels. Some participants saw the possibility of elevated foreclosures adding to the already very large inventory of vacant homes as posing a downside risk to home prices, thereby limiting the extent of the pickup in residential investment for a while.The FOMC is forecasting moderate growth however they expect the unemployment rate to remain elevated for some time:
In their discussion of the economic situation and outlook, meeting participants agreed that the incoming data and information received from business contacts indicated that economic activity continued to strengthen and the labor market was beginning to improve. Although some of the recent data on economic activity had been better than anticipated, most participants saw the incoming information as broadly in line with their earlier projections for moderate growth; accordingly, their views on the economic outlook had not changed appreciably. Participants expected the economic recovery to continue, but, consistent with experience following previous financial crises, most anticipated that the pickup in output would be rather slow relative to past recoveries from deep recessions. A moderate pace of expansion, in turn, would imply only a modest improvement in the labor market this year, with the unemployment rate declining gradually.
First American CoreLogic: House Prices Decline 0.3% in March
by Calculated Risk on 5/19/2010 12:31:00 PM
From LoanPerformance: CoreLogic Home Price Index Shows Second Consecutive Annual Increase
National home prices, including distressed sales, increased by 1.7 percent in March 2010 compared to March 2009, according to CoreLogic and its Home Price Index (HPI). This was an improvement over February’s year-over-year price increase of 0.8 percent.* Excluding distressed sales, year-over-year prices increased in March by 1.9 percent; an improvement over the February non-distressed HPI which fell by 0.2 percent year-over-year.
On a month-over-month basis, the national average home price index fell by 0.3 percent in March 2010 compared to February 2010, which was more moderate than the previous one month decline of 1.7 percent from January to February.
...
“March’s year-over-year increase in the HPI shows that the housing market is continuing to exhibit signs of stability,” said Mark Fleming, chief economist for CoreLogic. “The differences between trends, including and excluding distressed sales, indicate the strong influence of distressed activity remains, but the surge in home sales in March is giving the market a boost this spring. As the influence of the tail end of the tax credit and spring buying season fade, price growth will fade with it as we go into summer.”
 Click on graph for larger image in new window.
 This graph shows the national LoanPerformance data since 1976. January 2000 = 100.
The index is up 1.7% over the last year, and off 30.5% from the peak.
House prices are off 4.8% from the recent peak in August 2009 (although some of the decline is seasonal). The index bottomed last March ... so the index is also up 1.7% from the recent low.
With all the distressed sales and government programs, it is hard to separate the seasonal factors from other distortions. However I expect that we will see lower prices on this index later this year.
Note: This is the house price index the Fed now uses for the Flow of Funds report.


