 RSS Feed
 by Calculated Risk on 5/19/2010 11:06:00 AM
Wednesday, May 19, 2010
MBA Q1 National Delinquency Survey Conference Call
On the MBA conference call concerning the "Q1 2010 National Delinquency Survey", MBA Chief Economist Jay Brinkmann said this morning:
 Click on graph for larger image in new window.
This graph shows the delinquency and foreclosure rates for all prime loans.
This is a new record rate of prime loans in delinquency and foreclosure.
Prime loans account for over 75% of all loans.
"We're all subprime now!"
NOTE: Tanta first wrote this saying in 2007 in response to the 'contained to subprime' statements.
I'll have more later today ...
MBA Q1 2010: Record 14.69% of Mortgage Loans Delinquent or in Foreclosure
by Calculated Risk on 5/19/2010 10:00:00 AM
The MBA reports a record 14.69 percent of mortgage loans were either one payment delinquent or in the foreclosure process in Q1 2010 (seasonally adjusted).
From the MBA: Delinquencies, Foreclosure Starts Fall in Latest MBA National Delinquency Survey
The delinquency rate for mortgage loans on one-to-four-unitAlthough this is a new record, Jay Brinkmann, MBA’s chief economist added a caution on the seasonal adjustment (see press release).
residential properties increased to a seasonally adjusted rate of 10.06 percent of all loans outstanding as of the end of the first quarter of 2010, an increase of 59 basis points from the fourth quarter of 2009, and up 94 basis points from one year ago, according to the Mortgage Bankers Association’s (MBA) National Delinquency Survey. The non-seasonally adjusted delinquency rate decreased 106 basis points from 10.44 percent in the fourth quarter of 2009 to 9.38 percent this quarter.
The percentage of loans on which foreclosure actions were started during the first quarter was 1.23 percent, up three basis points from last quarter but down 14 basis points from one year ago.
The delinquency rate includes loans that are at least one payment past due but does not include loans in the process of foreclosure. The percentage of loans in the foreclosure process at the end of the first quarter was 4.63 percent, an increase of five basis points from the fourth quarter of 2009 and 78 basis points from one year ago. This represents another record high.
The combined percentage of loans in foreclosure or at least one payment past due was 14.01 percent on a non-seasonally adjusted basis, a decline from 15.02 percent last quarter.
The serious delinquency rate, the percentage of loans that are 90 days or more past due or in the process of foreclosure, was 9.54 percent, a decrease of 13 basis points from last quarter, but an increase of 230 basis points from the first quarter of last year.
I'll have notes from the conference call and graphs soon.
CPI declines 0.1%, Core CPI Flat
by Calculated Risk on 5/19/2010 08:30:00 AM
From the BLS report on the Consumer Price Index this morning:
On a seasonally adjusted basis, the Consumer Price Index for All Urban Consumers (CPI-U) declined 0.1 percent in April...Owners' equivalent rent (OER) is now down slightly year-over-year.
The index for all items less food and energy was unchanged in April, as it was in March. The shelter index and its major components of rent and owners' equivalent rent were all unchanged in April.
The disinflationary trend continues - and with all the slack in the system (especially the 9.9% unemployment rate), it is hard to see inflation picking up any time soon. The high unemployment rate and low measured inflation suggest the Fed will hold the Fed funds rate at the current level for some time.
MBA: Mortgage Purchase Applications 'Plummet' to 13 Year Low
by Calculated Risk on 5/19/2010 07:31:00 AM
The MBA reports: Mortgage Purchase Applications Plummet While Refinance Applications Increase in Latest MBA Weekly Survey
The Market Composite Index, a measure of mortgage loan application volume, decreased 1.5 percent on a seasonally adjusted basis from one week earlier....
The Refinance Index increased 14.5 percent from the previous week and the seasonally adjusted Purchase Index decreased 27.1 percent from one week earlier. This is the lowest Purchase Index observed in the survey since May of 1997. ...
“Purchase applications plummeted 27 percent last week and have declined almost 20 percent over the past month, despite relatively low interest rates. The data continue to suggest that the tax credit pulled sales into April at the expense of the remainder of the spring buying season. In fact, this drop occurred even as rates on 30-year fixed-rate mortgages continued to fall, and at 4.83 percent are at their lowest level since November 2009,” said Michael Fratantoni, MBA’s Vice President of Research and Economics. “However, refinance borrowers did react to these lower rates, with refi applications up almost 15 percent, hitting their highest level in nine weeks.”
... The average contract interest rate for 30-year fixed-rate mortgages decreased to 4.83 percent from 4.96 percent, with points increasing to 1.08 from 0.91 (including the origination fee) for 80 percent loan-to-value (LTV) ratio loans.
 Click on graph for larger image in new window.
This graph shows the MBA Purchase Index and four week moving average since 1990.
There was a spike in purchase applications in April, followed by a decline to a 13 year low last week. As Fratantoni noted: "The data continue to suggest that the tax credit pulled sales into April at the expense of the remainder of the spring buying season."
Tuesday, May 18, 2010
AIA: Architecture Billings Index shows less Contraction in April
by Calculated Risk on 5/18/2010 11:59:00 PM
Note: This index is a leading indicator for Commercial Real Estate (CRE) investment.
Reuters reports that the American Institute of Architects’ Architecture Billings Index increased to 48.5 in April from 46.1 in March. Any reading below 50 indicates contraction.
This suggests the slump for commercial real estate design might be nearing a bottom. However, according to the AIA, there is an "approximate nine to twelve month lag time between architecture billings and construction spending" on non-residential construction. So there will probably be further declines in CRE investment through all of 2010, and probably into 2011.
The ABI press release is not online yet. Click on graph for larger image in new window.
This graph shows the Architecture Billings Index since 1996. The index has remained below 50, indicating falling demand, since January 2008.
Note: Nonresidential construction includes commercial and industrial facilities like hotels and office buildings, as well as schools, hospitals and other institutions.
Dollars per Euro at 4 year low
by Calculated Risk on 5/18/2010 07:53:00 PM
From The Times: German shocks to the market push euro down again
The euro ... slid even further to $1.212, its lowest level against the greenback since April 17, 2006, after Germany instituted a ban from midnight last night on the naked short sale of shares in the country’s top financial institutions and the bonds of eurozone countries.That calls for an updated graph ...
Germany also prohibited the purchase of credit default swaps (CDS) on eurozone government bonds, other than for hedging purposes.
 Click on graph for larger image in new window.
The Euro has only been around since Jan 1999. The graph shows the number of dollars per euro since Jan 1, 1999.
The dashed line is the current exchange rate. This is the lowest level for the euro against the dollar since April 2006.
Just a little further (below 1.1667 dollars per euro), and we will be discussing the lowest level since 2003.
From CNBC: Pre-Market Data shows the S&P 500 off about 9 points or just under 1%. Dow futures are off about 70 points. The European markets will be interesting ...
Market Update, Euro Falls Further, Germany Bans some Short Selling
by Calculated Risk on 5/18/2010 04:02:00 PM

This graph is from Doug Short of dshort.com (financial planner): "Four Bad Bears".
Note that the Great Depression crash is based on the DOW; the three others are for the S&P 500.
The Euro is at 1.22 dollars. Other sources for exchange rates and NetDania.
From the WSJ: Euro Falls on German Tax Plan
German Chancellor Angela Merkel said Tuesday in Berlin that Germany would support a tax on the sector to contribute to the costs of the euro-zone sovereign-debt rescue plan.And Germany bans naked short selling on eurobonds and some banks ... from CNBC: Germany Planning Sharp Curbs On Some Kinds of Short Selling
...
Germany's ruling center-right parties agree that the financial-market sector must contribute to the costs of the euro-zone debt crisis if the lower house of Parliament is to approve Germany's share of the huge euro-zone rescue plan. They demanded the introduction of a financial-transaction tax or financial-activities tax.
SoCal Home Sales decline slightly Year-over-year in April
by Calculated Risk on 5/18/2010 02:53:00 PM
Note: ignore the median price - it is distorted by the changing mix.
From DataQuick: Southern California home sales dip
Southern California’s housing market leveled off last month as sales activity migrated ever-so-slightly from inland bargain areas toward entry- and mid-market neighborhoods closer to the coast. ...As DataQuick noted, many California buyers might have signed a contract in April (to get the Federal tax credit), but are planning on closing in May (to get the state tax credit). That could have reduced sales in April - we need to wait a few months to let this sort out. Also DataQuick tracks foreclosures, but not short sales - and the total percentage of distressed sales is probably still over half the market.
Sales of new and resale homes totaled 20,299 in Los Angeles, Riverside, San Diego, Ventura, San Bernardino and Orange counties last month. That was down 0.9 percent from 20,476 in March, and down 1.0 percent from 20,514 for April 2009, according to MDA DataQuick of San Diego.
It’s possible that a significant number of sales that would otherwise have closed escrow in April were delayed until May as buyers tried to take advantage of new state tax credits effective May 1. In addition, those who rushed to sign a sales contract last month before the April 30 deadline for a federal home buyer tax credit would likely close escrow in May or June.
... The Southland’s 1.0 percent decline in overall sales was the first year-over-year drop in almost two years.
...
Foreclosure resales accounted for 36.4 percent of the resale market last month, down from a revised 38.3 percent in March, and down from 53.5 percent a year ago. The all-time high was February 2009 at 56.7 percent.
Government-insured FHA loans, a popular choice among first-time buyers, accounted for 38.5 percent of all mortgages used to purchase homes in April.
... Buyers who appeared to have paid all cash – meaning there was no indication that a corresponding purchase loan was recorded – accounted for 27.7 percent of April sales, paying a median $200,000.
... Foreclosure activity remains high by historical standards but is lower than peak levels reached over the last two years.
Fed's Pianalto: "Subdued" Recovery, Unemployment Rate to decline "Gradually"
by Calculated Risk on 5/18/2010 12:45:00 PM
From Cleveland Fed President Sandra Pianalto: Forecasting in Uncertain Times
As we are all aware, we're emerging from the deepest and longest recession since the Great Depression. Our models would tell us that the deeper the downturn in the economy, the more rapid the recovery. You've probably heard this referred to as a V-shaped recovery.We already know that a "V-shaped" recovery is off the table. Researchers at the San Francisco Fed argued yesterday for a recovery between a "U" and a "V", see The Shape of Things to Come, however those researchers focused on GDP, and I'd suggest GDI, employment and real personal income less transfer payments all suggest an even more sluggish recovery than GDP.
However, my outlook is that our journey out of this deep recession will be a slow one because we face two primary headwinds that I expect will temper growth for awhile. The first is the effect of prolonged unemployment, and the second is a heightened sense of caution on the part of consumers and businesspeople.
...
About half of those who are currently unemployed have been out of work for at least six months, and the longer someone is out of work, the harder it is to find a job. In the 1982 recession, which was another severe recession, the average duration of unemployment peaked at 21 weeks, but today the average is already over 30 weeks—a record high. Research also tells us that workers lose valuable skills during long spells of unemployment, and that some jobs simply don't return.
...
The second powerful headwind in this recession is a heightened sense of caution, driven by a deep uncertainty about where the "new normal" or baseline might be. A whole generation of Americans who began their working careers in the mid-1980s had experienced only long periods of prosperity punctuated by just two very brief downturns. Those experiences encouraged an expectation for relatively smooth growth. Now everyone's expectations have shifted as a result of this long and deep recession.
People's attitudes about their own prospects have fundamentally changed. In a recent survey by Ohio's Xavier University, 60 percent of those polled believe attaining the American dream is harder for this generation than ones before. And nearly 70 percent think it will be even more difficult for their children. Many people are now just aiming for “financial security” as their American dream
...
Businesses are also cautious. Business leaders base many decisions on forecasts, and they tell me that they are attaching the same high degree of uncertainty around their projections as I am. Most business leaders say that they’re not planning significant hiring until there’s more clarity about how the recovery is going to progress and about policies relating to health care, energy, the environment, and taxes. This caution translates into fewer job opportunities, fewer equipment purchases, fewer building projects—and on and on.
These two factors—overall caution and the effects of labor market damage—lead me to an outlook for relatively subdued output growth through this year and next, with unemployment rates that decline only gradually.
Also I'd add residential investment to Pianalto's two "headwinds". Usually housing is a key engine of growth in a recovery - for both GDP and employment - and this time any contribution from housing will be muted for some time.
Q1: Quarterly Housing Starts and New Home Sales
by Calculated Risk on 5/18/2010 11:27:00 AM
This morning the Census Bureau released the "Quarterly Starts and Completions by Purpose and Design" report for Q1 2010.  Click on graph for larger image in new window.
The first graph shows the NSA quarterly starts intent for four categories since 1975: single family built for sale, owner built (includes contractor built for owner), starts built for rent, and condos built for sale.
Condo starts in Q1 were just above the all time record low last quarter (4,000 vs 3,000 in Q4 2009).
Units built for rent set an all time record low in Q1 (19,000 units in Q1 2010 compared to the previous record low of 20,000 units in Q4 2009). This year a record low number of rental units will be built, and that is one reason the rental vacancy rate should continue to decline (household formation should be significantly higher than the increase in housing units in 2010).
Owner built units are just above the record low set in Q1 2009 (25,000 units in Q1 2010 compared to 24,000 units in Q1 2009).
And the largest category - starts of single family units, built for sale - increased to 86,000 in Q1.
With starts so low in every category, the number of units added to the housing stock in 2010 will be at a record low - and that will help reduce the significant excess inventory of housing units.
Comparing Housing Starts and New Home Sales
Monthly housing starts (even single family starts) cannot be compared directly to new home sales, because the monthly housing starts report from the Census Bureau includes apartments, owner built units and condos that are not included in the new home sales report.
However it is possible to compare "Single Family Starts, Built for Sale" to New Home sales on a quarterly basis. This is not perfect because of reporting differences and changes in cancellation rate - but it is close. The quarterly report shows that there were 86,000 single family starts, built for sale, in Q1 2010, and that is the same as the 86,000 new homes sold for the same period. This data is Not Seasonally Adjusted (NSA).
This breaks a streak of 9 consecutive quarter with homebuilders selling more homes than they started.
Note: new home sales are reported when contracts are signed, so it is appropriate to compare sales to starts (as opposed to completions).  This graph provides a quarterly comparison of housing starts and new home sales. In 2005, and most of 2006, starts (blue) were higher than sales (red), and inventories of new homes increased. For the previous 9 quarters, starts were below sales – and new home inventories declined. In Q1 starts and sales were about the same. Historically builders sell more home in Q1 than they start, but they probably started more homes this year anticipating some extra sales in April related to the expiring tax credit.
Housing Starts increase in April
by Calculated Risk on 5/18/2010 08:30:00 AM
 Click on graph for larger image in new window.
Total housing starts were at 672 thousand (SAAR) in April, up 5.8% from the revised March rate, and up 41% from the all time record low in April 2009 of 477 thousand (the lowest level since the Census Bureau began tracking housing starts in 1959).
Single-family starts were at 593 thousand (SAAR) in April, up 10.2% from the revised February rate, and 65% above the record low in January 2009 (360 thousand).  The second graph shows total and single unit starts since 1968. This shows the huge collapse following the housing bubble, and that housing starts are still very low.
Here is the Census Bureau report on housing Permits, Starts and Completions.
Housing Starts:Note that permits fell sharply, suggesting a significant decline in housing starts next month.
Privately-owned housing starts in April were at a seasonally adjusted annual rate of 672,000. This is 5.8 percent (±13.0%)* above the revised March estimate of 635,000 and is 40.9 percent (±19 8%) above the revised April 2009 rate of 477,000.
Single-family housing starts in April were at a rate of 593,000; this is 10.2 percent (±10.7%)* above the revised March figure of 538,000.
Housing Completions:
Privately-owned housing completions in April were at a seasonally adjusted annual rate of 769,000. This is 19.2 percent (±13.8%) above the revised March estimate of 645,000, but is 8.7 percent (±12.8%)* below the revised April 2009 rate of 842,000.
Single-family housing completions in April were at a rate of 564,000; this is 14.6 percent (±13.1%) above the revised March figure of 492,000.
Building Permits:
Privately-owned housing units authorized by building permits in April were at a seasonally adjusted annual rate of 606,000. This is 11.5 percent (±1.1%) below the revised March rate of 685,000, but is 15.9 percent (±1.3%) above the revised April 2009 estimate of 523,000.
Single-family authorizations in April were at a rate of 484,000; this is 10.7 percent (±1.1%) below the revised March figure of 542,000.
Monday, May 17, 2010
FHA will Reduce Allowable Seller Concessions this Summer
by Calculated Risk on 5/17/2010 09:27:00 PM
These changes have been under discussion for some time ...
From Jon Prior at HousingWire: FHA Set to Reduce Closing Cost Assistance This Summer
The FHA will reduce allowable seller concessions — the percentage sellers can take from the sales price of a home to fund closing costs — from 6% to 3%. According to an announcement in January, the current level of 6% exposes the FHA to excess risk by creating incentives for appraisers to increase the value of these homes. The change will take place in “early summer,” according to the FHA, but a spokesperson said no specific date has been set.In early April, the FHA increased the upfront insurance premiums on FHA-backed loans from 1.75% to 2.25% of the loan amount. Borrowers also have to pay an annual premium based on the LTV and type of loan.
The FHA is also trying to crack down on poor performing mortgage brokers and lenders, from Nick Timiraos at the WSJ: Mortgage Insurer Turns to Lenders to Police Brokers
Under changes set to take effect May 20, the FHA will stop certifying mortgage brokers or tracking the individual performance of loans that they originate. Instead, it will require lenders to sponsor brokers and to assume responsibility for those loans, including losses from fraud or poorly underwritten loans ...These are all small changes, but they add up.
The FHA is also asking Congress for greater authority to recoup losses from lenders on defaulted loans that were improperly underwritten. Currently, the FHA has that indemnification authority for loans from some 600 lenders that account for 71% of all FHA-backed loans. The new rules would apply to the remaining 1,400 lenders that account for the remaining 29% of FHA originations.
More on HAMP
by Calculated Risk on 5/17/2010 05:40:00 PM
From Diana Olick at CNBC: Mortgage Mods Doomed by Back End Debt. On the absurdly high back end debt-to-income ratio:
"A 64.3% DTI is so far out of scope with the pre-bubble years safe and sound 36% total DTI — and even typical bubble-years full-doc DTI's of 50% — it is absolutely irresponsible," says mortgage analyst Mark Hanson. "Servicers are pushing the envelope with respect to getting people to qualify," he adds.Olick adds:
I have to wonder if any mortgage originator today would even offer a new loan to anyone with those kinds of stats. My guess is no.I hope not!
And from David Streitfeld at the NY Times: U.S. Mortgage Program Stalling, Data Shows
David Stevens, assistant secretary for housing at HUD ... said the program should be considered in light of the government’s extensive efforts over the last year to shore up the housing market. These efforts included keeping a lid on home mortgage rates, a tax credit and refinancing programs for those who owed more than their house was worth.Stevens is referring to all the government programs aimed at supporting house prices (the assumed overall strategy). HAMP was very successful at delaying foreclosures and keeping the level of distressed inventory down. Other programs, such as the housing tax credit and Fed MBS purchase program, were aimed at boosting demand.
Lower supply and higher demand kept house prices from falling further. I guess if house prices don't fall too far from here, it is possible that the overall strategy could be considered a success even though some of the tactics, like HAMP and the housing tax credit, were clear failures when analyzed separately.
HAMP April data shows program slowing down
by Calculated Risk on 5/17/2010 02:54:00 PM
From Treasury: HAMP Servicer Performance Report Through April 2010 Click on table for larger image in new window.
About 299,000 modifications are now "permanent", and 277,000 trial modification cancelled. There is still a huge number of borrowers in limbo. According to HAMP, there are 637,353 "active trials".
As of April, there were 1,214,085 trials started, and as of last September there were 553,568. That gives 660,000 trials started over the last 7 months - about the same number as "active trials". Ouch. That suggests that the HAMP trial period is about 7 months! The second graph shows the cumulative HAMP trial programs started.
Notice that the pace of new trial modifications has slowed sharply from over 150,000 in September to around 47,160 in April 2010. This is slowest pace since the program started, probably because of two factors: 1) servicers are now pre-qualifying borrowers, and 2) servicers are running out of eligible borrowers. The program is dying ...
On page 6 is some new data. Not surprisingly the servicers who verified income before starting a trial modification have a much higher conversion rate than servicers that allowed borrowers to state their income.
Debt-to-income ratios worsen
If we look at the HAMP program stats (see page 5), the median front end DTI (debt to income) before modification was 44.9% - up slightly from 44.8% last month. And the back end DTI was an astounding 80.2% (up from 77.5% last month).
Think about that for a second: over 80% of the borrowers income went to servicing debt. And it is over 64% after the modification. Do they have a life?
Just imagine the characteristics of the borrowers who can't be converted!
In summary: 1) the program is dying, 2) the borrowers DTI characteristics are poor - and getting worse, and 3) there are a large number of borrowers in modification limbo.
NAHB Builder Confidence Increases in May
by Calculated Risk on 5/17/2010 01:00:00 PM
Note: any number under 50 indicates that more builders view sales conditions as poor than good. Click on graph for larger image in new window.
This graph shows the builder confidence index from the National Association of Home Builders (NAHB).
The housing market index (HMI) was at 22 in May. This is an increase from 19 in April. This is the highest level since August 2007 - and builders were seen as depressed then!
The record low was 8 set in January 2009. This is still very low ... This second graph compares the NAHB HMI (left scale) with single family housing starts (right scale). This includes the May release for the HMI and the March data for starts (April starts will be released tomorrow).
This shows that the HMI and single family starts mostly move generally in the same direction - although there is plenty of noise month-to-month.
Press release from the NAHB: Builder Confidence Continues to Strengthen in May
Builder confidence in the market for newly built, single-family homes rose for a second consecutive month in May to its highest level in more than two years, according to the latest National Association of Home Builders/Wells Fargo Housing Market Index (HMI), released today. The HMI gained three points to 22 in May, its highest point since August of 2007.
“Builders surveyed for the HMI at the beginning of May were undoubtedly reacting to the heightened consumer interest they had just witnessed as the deadline for home buyer tax credits arrived at the end of April,” said Bob Jones, Chairman of the National Association of Home Builders (NAHB) and a home builder from Bloomfield Hills, Mich. “Builders are also hopeful that the solid momentum that the tax credits initiated will continue even now that those incentives are gone.”
“The really encouraging part of today’s HMI is that sales expectations for the next six months continued to gain, despite the expiration of the home buyer tax credits at the end of April,” said NAHB Chief Economist David Crowe. “This means builders are more comfortable that the market is truly beginning to recover, and that positive factors for buying a new home – low interest rates, great selection, stabilizing prices, and a recovering job market – are taking the place of tax incentives to generate buyer demand.”
Crowe was quick to point out, however, that while builder confidence has improved from the depths of the housing downturn, it is still quite low by historic standards. “Obviously we still have a long way to go ..."
Each of the HMI’s three component indexes posted three-point gains in May. The component gauging current sales conditions climbed to 23, its highest level since July of 2007. The component gauging sales expectations in the next six months rose to 28, its highest point since November 2009, and the component gauging traffic of prospective buyers improved to 16, its best showing since September 2009.
Europe's Woes impacting China
by Calculated Risk on 5/17/2010 09:50:00 AM
From Keith Bradsher at the NY Times: Europe’s Debt Crisis Is Casting a Shadow Over China
The steep rise of the renminbi prompted a Commerce Ministry official in Beijing to warn Monday that China’s exports could be threatened. ...
“The yuan has risen about 14.5 percent against the euro during the past four months, which will increase cost pressure for Chinese exporters and also have a negative impact on China’s exports to European countries,” Yao Jian, the ministry’s spokesman, said at a news conference in Beijing, according to news services.
...
Because American companies in particular compete in the Chinese market with European companies in many industries, the euro’s weakness against the renminbi is putting American companies at a disadvantage ...
 As I noted a few weeks ago ... keep an eye on the Shanghai index (in red).
 Click on graph for larger image in new window.
This graph shows the Shanghai SSE Composite Index and the S&P 500 (in blue).
The SSE Composite Index is at 2,559.93 - down 5% last night and off almost 20% since early April. This is the lowest level in over a year.
Should we be more concerned about the slowdown in Europe, or the slowdown in China?
NY Fed: Manufacturing Conditions Improve, but at Slower Pace
by Calculated Risk on 5/17/2010 08:32:00 AM
From the NY Fed: Empire State Manufacturing Survey
The Empire State Manufacturing Survey indicates that conditions for New York manufacturers continued to improve for a tenth consecutive month in May, albeit at a slower pace than in April. The general business conditions index fell 13 points, to 19.1. Similarly, the new orders and shipments indexes also moved lower but remained at positive levels. The inventories index dropped back to a level near zero after rising into positive territory in March and April. .... Future indexes suggest that activity is expected to expand further in the months ahead, but the level of optimism was noticeably lower in May than in recent months.This came in below expectations. New orders are softer and the inventory adjustment is over. Manufacturing continued to improve, although at a slower pace in May. This is an early indicator for the national ISM survey that will be released June 1st.
...
The new orders index was also lower, falling 15 points to 14.3. ... The index for number of employees climbed to 22.4, with nearly a third of respondents increasing employment levels in May. The average workweek index fell to zero, following four months of positive readings. .... The future inventories index fell below zero for the first time since October of last year, suggesting that inventory levels were not expected to rise in the coming months.
Sunday, May 16, 2010
Sunday Night Futures
by Calculated Risk on 5/16/2010 10:15:00 PM
The U.S. futures are off tonight:
From CNBC: Pre-Market Data shows the S&P 500 off about 11 points or 1%. Dow futures are off about 100 points.
CBOT mini-sized Dow
And the Asian markets are in the red with most indexes off about 2%.
And a graph of the Asian markets.
The Euro is at 1.23 dollars. Update: more currency exchange rates and from NetDania.
It will be a busy week ...
Best to all.
Libor Increases, Euro Falls
by Calculated Risk on 5/16/2010 04:33:00 PM
Note: here is the Weekly Summary and a Look Ahead (busy week)!
On the Libor and the Euro ...
From the Financial Times: Banks’ debt exposure fuels risk aversion
Concern about the exposure of European banks to the debts of weaker countries in the eurozone is ... increasing the amounts banks charge to lend to each other.The Libor has risen recently, but it is still very low (here is a graph from Bloomberg). The Libor is at 0.45%; the Libor peaked at 4.81875% on Oct 10, 2008.
The London inter-bank offer rate, or Libor, has risen in recent weeks to its highest level since last August ... which is significant because the rate has served as a leading gauge of stress during the financial crisis.
excerpt with permission
The TED spread has increased too, but it is still very low at 30. This is the difference between the interbank rate for three month loans and the three month Treasury. The peak was 463 on Oct 10th and a normal spread is around 50 bps - so this is still below normal.
And from The Times: Euro heads for parity with dollar
THE euro is set to slide further and could be heading for parity with the dollar, analysts say. ... The euro fell to a 19-month low against the dollar of $1.23 on Friday night ...
 Click on graph for larger image in new window.
Update: Oops. Chart was labeled backwards. There are 1.23 dollars per Euro.
The Euro has only been around since Jan 1999. The graph shows the number of dollars per euro since Jan 1, 1999.
There is nothing magical about "parity" except it makes a good headline - and would be a significant decline.
Weekly Summary and a Look Ahead
by Calculated Risk on 5/16/2010 11:59:00 AM
Three housing related reports will be released early this week: the NAHB builder confidence survey on Monday, housing starts on Tuesday, and the MBA Q1 delinquency report on Wednesday. Of course Europe will still be in the spotlight too.
On Monday, the May Empire State manufacturing survey will be released at 8:30 AM. The consensus is for a slight decline from the strong reading in April. Also on Monday, the May NAHB homebuilder survey will be released at 1 PM. The consensus is for a slight increase to 20 from 19 in April.
On Tuesday, Housing Starts for April will be released at 8:30 AM. The consensus is for an increase to 650K (SAAR) in April from 626K in March. Also at 8:30 AM, the BLS will release the Producer Price Index (PPI) for April. The consensus is for an increase of 0.1%. The Census Bureau will also release the Q1 Quarterly Starts and Completions report.
Also on Tuesday, Cleveland Fed President Sandra Pianalto speaks at the Economic Club of Pittsburgh at 12:20 PM , and former Fed Chairman Paul Volcker speaks at Stanford University at 9:45 PM. It was five years ago – at Stanford – that Volcker remarked that “circumstances seem as dangerous and intractable as I can remember" and "homeownership has become a vehicle for borrowing and leveraging as much as a source of financial security". That speech is still worth reading.
On Wednesday, the Q1 MBA delinquency report will be released at 10 AM. The big news last quarter was the decline in 30 day delinquencies, and expectations are for further declines – although long term delinquencies will still be a problem. I’ll be on the conference call at 10:30 AM.
Also on Wednesday, the April Consumer Price Index (CPI) will be released at 8:30 AM. The consensus is for a 0.1% increase in prices. Also the AIA's Architecture Billings Index for April will be released (a leading indicator for commercial real estate). The FOMC minutes for the April meeting will be released at 2 PM.
On Thursday, the closely watched initial weekly unemployment claims will be released. Consensus is for a decline to 440K from 444K last week. Also on Thursday, the Philly Fed survey and the Conference Board's index of leading indicators will both be released at 10 AM.
And on Friday, the BLS will release the Regional and State Employment and Unemployment report for April at 10 AM. And of course the FDIC will probably have another busy Friday afternoon ...
Note: Other reports that will probably be released this week include the Moodys/REAL Commercial Property Price Index (for March), the HAMP April report, DOTs Vehicle Miles Driven for March, and the First American Corelogic distressed sales report for February.
And a summary of last week:
The EU announced a total bailout package of €750 billion (if needed). This story is ongoing ...
1) The EU created a €60 billion fund based on article 122 (special circumstances). The IMF will add €30 billion. Press conference archive here (40 minutes)
2) The EU will create a Special Purpose Vehicle (SPV) for 3 years based on inter government agreements. These are potential loan guarantees backed by all Euro Zone countries. This is in addition to €60 billion and will be up to €440 billion - plus a contribution from the IMF up to half of European Union contribution (up to €220 billion).
3) Both Portugal and Spain announced steps to reduce their deficits.
4) The European Central Bank (ECB) intervened "in the euro area public and private debt securities markets (Securities Markets Programme) to ensure depth and liquidity in those market segments which are dysfunctional."
5) The Federal Reserve reopened swap lines to provide dollar liquidity.
6) Deutsche Bank CEO expressed doubts about Greece
7) ECB's Trichet called this the "most difficult situation" since the World War.
 Click on graph for larger image in new window.
This graph shows the REO inventory for Fannie, Freddie and FHA through Q1 2010.
Even with all the delays in foreclosure, the REO inventory has increased sharply over the last three quarters, from 135,868 at the end of Q2 2009, to 153,007 in Q3 2009, 172,357 at the end of Q4 2009 and now 209,500 at the end of Q4 2010.
These are new records for all three agencies.
Remember this is just a portion of the total REO inventory. Private label securities and banks and thrifts hold an even larger number of REOs.
 On a monthly basis, retail sales increased 0.4% from March to April (seasonally adjusted, after revisions), and sales were up 8.8% from April 2009 (easy comparison).
This graph shows retail sales since 1992. This is monthly retail sales, seasonally adjusted (total and ex-gasoline).
The red line shows retail sales ex-gasoline and shows the increase in final demand ex-gasoline has been sluggish.
Retail sales are up 9.2% from the bottom, but still off 3.6% from the pre-recession peak.
 From the Fed: Industrial production and Capacity Utilization
 This graph shows industrial production since 1967.
This is the highest level for industrial production since Dec 2008, but production is still 9.0% below the pre-recession levels at the end of 2007.
First American CoreLogic released the Q1 2010 negative equity report this week.
 This graph shows the negative equity and near negative equity by state.
 Ten percent or more of homeowners have negative equity in 33 states and the D.C., and over 20% have negative equity or near negative equity in 23 states and D.C. This is a widespread problem.
Note: Louisiana, Maine, Mississippi, South Dakota, Vermont, West Virginia and Wyoming are NA on the graph above.
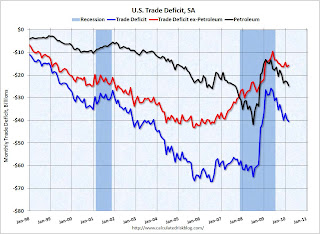 This graph shows the U.S. trade deficit, with and without petroleum, through March.
The blue line is the total deficit, and the black line is the petroleum deficit, and the red line is the trade deficit ex-petroleum products.
Both imports and exports have been increasing sharply, but are still below the pre-financial crisis levels. Once again China and oil are the major contributors to the trade deficit.
Best wishes to all.


