 RSS Feed
 by Calculated Risk on 5/16/2010 11:59:00 AM
Sunday, May 16, 2010
Weekly Summary and a Look Ahead
Three housing related reports will be released early this week: the NAHB builder confidence survey on Monday, housing starts on Tuesday, and the MBA Q1 delinquency report on Wednesday. Of course Europe will still be in the spotlight too.
On Monday, the May Empire State manufacturing survey will be released at 8:30 AM. The consensus is for a slight decline from the strong reading in April. Also on Monday, the May NAHB homebuilder survey will be released at 1 PM. The consensus is for a slight increase to 20 from 19 in April.
On Tuesday, Housing Starts for April will be released at 8:30 AM. The consensus is for an increase to 650K (SAAR) in April from 626K in March. Also at 8:30 AM, the BLS will release the Producer Price Index (PPI) for April. The consensus is for an increase of 0.1%. The Census Bureau will also release the Q1 Quarterly Starts and Completions report.
Also on Tuesday, Cleveland Fed President Sandra Pianalto speaks at the Economic Club of Pittsburgh at 12:20 PM , and former Fed Chairman Paul Volcker speaks at Stanford University at 9:45 PM. It was five years ago – at Stanford – that Volcker remarked that “circumstances seem as dangerous and intractable as I can remember" and "homeownership has become a vehicle for borrowing and leveraging as much as a source of financial security". That speech is still worth reading.
On Wednesday, the Q1 MBA delinquency report will be released at 10 AM. The big news last quarter was the decline in 30 day delinquencies, and expectations are for further declines – although long term delinquencies will still be a problem. I’ll be on the conference call at 10:30 AM.
Also on Wednesday, the April Consumer Price Index (CPI) will be released at 8:30 AM. The consensus is for a 0.1% increase in prices. Also the AIA's Architecture Billings Index for April will be released (a leading indicator for commercial real estate). The FOMC minutes for the April meeting will be released at 2 PM.
On Thursday, the closely watched initial weekly unemployment claims will be released. Consensus is for a decline to 440K from 444K last week. Also on Thursday, the Philly Fed survey and the Conference Board's index of leading indicators will both be released at 10 AM.
And on Friday, the BLS will release the Regional and State Employment and Unemployment report for April at 10 AM. And of course the FDIC will probably have another busy Friday afternoon ...
Note: Other reports that will probably be released this week include the Moodys/REAL Commercial Property Price Index (for March), the HAMP April report, DOTs Vehicle Miles Driven for March, and the First American Corelogic distressed sales report for February.
And a summary of last week:
The EU announced a total bailout package of €750 billion (if needed). This story is ongoing ...
1) The EU created a €60 billion fund based on article 122 (special circumstances). The IMF will add €30 billion. Press conference archive here (40 minutes)
2) The EU will create a Special Purpose Vehicle (SPV) for 3 years based on inter government agreements. These are potential loan guarantees backed by all Euro Zone countries. This is in addition to €60 billion and will be up to €440 billion - plus a contribution from the IMF up to half of European Union contribution (up to €220 billion).
3) Both Portugal and Spain announced steps to reduce their deficits.
4) The European Central Bank (ECB) intervened "in the euro area public and private debt securities markets (Securities Markets Programme) to ensure depth and liquidity in those market segments which are dysfunctional."
5) The Federal Reserve reopened swap lines to provide dollar liquidity.
6) Deutsche Bank CEO expressed doubts about Greece
7) ECB's Trichet called this the "most difficult situation" since the World War.
 Click on graph for larger image in new window.
This graph shows the REO inventory for Fannie, Freddie and FHA through Q1 2010.
Even with all the delays in foreclosure, the REO inventory has increased sharply over the last three quarters, from 135,868 at the end of Q2 2009, to 153,007 in Q3 2009, 172,357 at the end of Q4 2009 and now 209,500 at the end of Q4 2010.
These are new records for all three agencies.
Remember this is just a portion of the total REO inventory. Private label securities and banks and thrifts hold an even larger number of REOs.
 On a monthly basis, retail sales increased 0.4% from March to April (seasonally adjusted, after revisions), and sales were up 8.8% from April 2009 (easy comparison).
This graph shows retail sales since 1992. This is monthly retail sales, seasonally adjusted (total and ex-gasoline).
The red line shows retail sales ex-gasoline and shows the increase in final demand ex-gasoline has been sluggish.
Retail sales are up 9.2% from the bottom, but still off 3.6% from the pre-recession peak.
 From the Fed: Industrial production and Capacity Utilization
 This graph shows industrial production since 1967.
This is the highest level for industrial production since Dec 2008, but production is still 9.0% below the pre-recession levels at the end of 2007.
First American CoreLogic released the Q1 2010 negative equity report this week.
 This graph shows the negative equity and near negative equity by state.
 Ten percent or more of homeowners have negative equity in 33 states and the D.C., and over 20% have negative equity or near negative equity in 23 states and D.C. This is a widespread problem.
Note: Louisiana, Maine, Mississippi, South Dakota, Vermont, West Virginia and Wyoming are NA on the graph above.
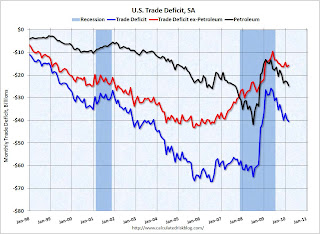 This graph shows the U.S. trade deficit, with and without petroleum, through March.
The blue line is the total deficit, and the black line is the petroleum deficit, and the red line is the trade deficit ex-petroleum products.
Both imports and exports have been increasing sharply, but are still below the pre-financial crisis levels. Once again China and oil are the major contributors to the trade deficit.
Best wishes to all.


