 RSS Feed
 by Calculated Risk on 4/28/2010 08:19:00 AM
Wednesday, April 28, 2010
MBA: Mortgage Purchase Applications Increase
The MBA reports: Purchase Applications Increase, Refinance Applications Decline in Latest MBA Weekly Survey
The Market Composite Index, a measure of mortgage loan application volume decreased 2.9 percent on a seasonally adjusted basis from one week earlier. ...
The Refinance Index decreased 8.8 percent from the previous week, while the seasonally adjusted Purchase Index increased 7.4 percent from one week earlier and reached its highest level since October 2009. The increase in the purchase index was driven largely by the government purchase index, which increased 11.9 percent ...
“Purchase activity continues to increase as we approach the end of the homebuyer tax credit program,” said Michael Fratantoni, MBA's Vice President of Research and Economics. “Purchase applications were up almost 9 percent from a month ago, with a disproportionate share of the increase due to government purchase applications. Government applications for purchasing a home accounted for almost 49 percent of all purchase applications last week.”
The refinance share of mortgage activity decreased to 55.7 percent of total applications from 60.0 percent the previous week. The refinance share is at its lowest since August 2009 ...
The average contract interest rate for 30-year fixed-rate mortgages increased to 5.08 percent from 5.04 percent, with points decreasing to 0.91 from 0.98 (including the origination fee) for 80 percent loan-to-value (LTV) ratio loans.
 Click on graph for larger image in new window.
This graph shows the MBA Purchase Index and four week moving average since 1990.
This is the highest level for the purchase index since last October.
Tuesday, April 27, 2010
CEO: Wal-Mart's Customers "still feel the pressure"
by Calculated Risk on 4/27/2010 11:55:00 PM
From Ylan Q. Mui and Neil Irwin at the WaPo: Consumer confidence is up, but test looms
"Some would say there is a recovery taking place," [Wal-Mart chief executive Mike Duke] said during a meeting with Washington Post editors and reporters. "The lower-income and middle-income customers . . . they still feel the pressure."Don't hold your breath on housing and housing related jobs.
In addition, he said that the weak housing market continued to hold back the recovery in states such as Florida and Nevada. During the boom years, many jobs in those states were fueled by a surge of construction that has since abated, drying up the demand for labor.
"It will take housing to create some of those jobs," Duke said.
And a summary paragraph in the article:
With federal stimulus spending beginning to taper off over the second half of the year, the fragile recovery in the housing markets showing signs of petering out and exports unlikely to create the same boost over the next nine months that they did over the past nine months, it will be up to American consumers to pick up the slack and drive a continued expansion.The stimulus spending peaks in Q2, and then starts to decline in Q3. And the housing market will continue to struggle with the huge overhang of existing inventory and distressed properties. Still I don't expect a 'double dip', but a slowdown in the 2nd half of the year seems likely.
ATA Trucking Index increases in March
by Calculated Risk on 4/27/2010 07:09:00 PM
It was a busy day with the Goldman Sachs testimony, Greece and Portugal downgrades, and the "mixed" Case-Shiller House Prices for February. Here is something more upbeat ...
From the American Trucking Association: ATA Truck Tonnage Index Rose 0.4 Percent in March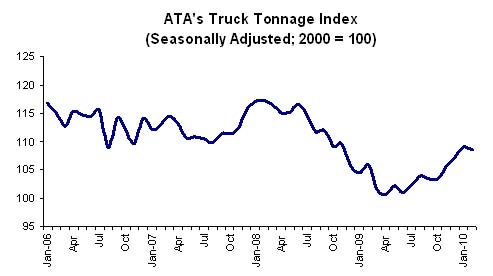
The American Trucking Associations’ advance seasonally adjusted (SA) For-Hire Truck Tonnage Index increased 0.4 percent in March, following a revised 0.3 percent decrease in February. The latest improvement put the SA index at 109.2 (2000=100), which is the highest level since November 2008. ...Trucking is a coincident indicator for the economy, and this suggests a solid March after the dip in February.
Compared with March 2009, SA tonnage jumped 7.5 percent, which was the fourth consecutive year-over-year gain and the largest increase since January 2005. ...
ATA Chief Economist Bob Costello said that he is getting more optimistic about the motor carrier industry’s recovery. “Freight is moving in the right direction and I continue to hear from motor carriers that both the demand and supply situations are steadily improving.” Costello attributed the first-quarter improvement in tonnage to the growing economy and to a slight inventory build after some sectors slashed inventories by too much in 2009. Costello added: “For most fleets, freight volumes feel better than reported tonnage because the supply situation, particularly in the truckload sector, is turning quickly.”
Market Update
by Calculated Risk on 4/27/2010 03:56:00 PM
Making the rounds, a little Goldman humor (ht Brian):
"You want the truth? You can't handle the truth. Son, we live in a country with an investment gap. And that gap needs to be filled by men with money. Who's gonna do it? You? You, Middle Class Consumer? Goldman Sachs has a greater responsibility than you can possibly fathom. You weep for Lehman and you curse derivatives. You have that luxury. You have the luxury of not knowing what we know: that Lehman's death, while tragic, probably saved the financial system. And that Goldman's existence, while grotesque and incomprehensible to you, saves pension funds. You don't want the truth. Because deep down, in places you don't talk about at parties, you want us to fill that investment gap. You need us to fill that gap. "We use words like credit default swaps, collateralized debt obligation, and securitization? We use these words as the backbone of a life spent investing in something. You use 'em as a punchline. We have neither the time nor the inclination to explain ourselves to a commoner who rises and sleeps under the blanket of the very credit we provide, and then questions the manner in which we provide it! We'd rather you just said thank you and paid your taxes on time. Otherwise, we suggest you get an account and start trading. Either way, we don't give a damn what you think you're entitled to!"credit: StatsGuy at Baseline Scenario.
The S&P was off 2.34% today - not much compared to the huge rally over the last year ...
 Click on graph for larger image in new window.
From Doug Short: Bear Turns to Bull?
This graph from Doug is titled: "Four Bad Bears".
Note that the Great Depression crash is based on the DOW; the three others are for the S&P 500.
Real House Prices and the Unemployment Rate
by Calculated Risk on 4/27/2010 01:24:00 PM
Earlier today S&P released the Case-Shiller house price indexes for February, see: Case-Shiller House Prices "mixed" in February
Below is a comparison of real house prices and the unemployment rate using the First American Corelogic LoanPerformance national house price index (starts in 1976) and Case-Shiller Composite 10 index (starts in 1987). Both indexes are adjusted by CPI less shelter. This is an update to a post from almost a year ago. 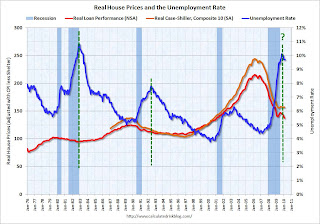 Click on image for larger graph in new window.
The two previous national declines in real house prices are evident on the graph (early '80s and early '90s). The dashed green lines are drawn at the peak of the unemployment rate following the peak in house prices.
The unemployment rate peak in 2009 is likely, but not certain.
In the early '80s, real house prices declined until the unemployment rate peaked, and then increased sluggishly for a few years. Following the late 1980s housing bubble, real house prices declined for several years after the unemployment rate peaked.
Although there are periods when there is no relationship between the unemployment rate and house prices - like during the bursting of the stock market bubble - this graph suggested to me that house prices would not bottom in real terms until the unemployment rate had peaked - and probably later (the recent housing bubble dwarfed the previous housing bubbles, and the bust will probably take some time).
Real prices, as measure by LoanPerformance, hit new lows in February, although real Case-Shiller prices are still fractionally above the lows of last year. I expect further declines in both indexes later this year, and this graph suggests that real house prices are probably still 10% or more too high on a national basis.
Real prices can decline because of falling nominal house prices (likely in my view) or from inflation (or a combination of both).
Note: earlier I mentioned that S&P has expressed concern about the Case-Shiller seasonal adjustment - here is the announcement from S&P.
S&P Downgrades Greece and Portugal
by Calculated Risk on 4/27/2010 11:42:00 AM
From MarketWatch: S&P cuts Greece ratings to junk status
Standard & Poor's said Tuesday it cut Greece's ratings to junk status. The ratings agency lowered the long-term sovereign credit rating on Greece to BB+ from BBB+. The outlook is negative.From CNBC:
S&P downgraded its rating on Portugal's debt by two notches to A-minus.
Video: Goldman's Blankfein Testifies to Congress
by Calculated Risk on 4/27/2010 09:55:00 AM
Goldman executives, including Chief Executive Lloyd Blankfein, will testify before the Senate Permanent Subcommittee on Investigations at 10 AM ET. There is apparently some interest in this testimony.
Here is the CNBC feed.
Here is the C-Span3 Link
Case-Shiller House Prices "mixed" in February
by Calculated Risk on 4/27/2010 09:00:00 AM
IMPORTANT: These graphs are Seasonally Adjusted (SA). S&P has cautioned that the seasonal adjustment is probably being distorted by irregular factors. These distortions could include distressed sales and the various government programs.
S&P/Case-Shiller released the monthly Home Price Indices for February (actually a 3 month average).
The monthly data includes prices for 20 individual cities, and two composite indices (10 cities and 20 cities).
From S&P: Home Prices Mixed in February 2010
Data through February 2010, released today by Standard & Poor’s for its S&P/Case-Shiller Home Price Indices, the leading measure of U.S. home prices, show that the annual rates of decline of the 10-City and 20-City Composites improved in February compared to January 2010. For the first time since December 2006, the annual rates of change for the two Composites are positive. The 10-City Composite is up 1.4% from where it was in February 2009, and the 20-City Composite is up 0.6% versus the same time last year. However, 11 of 20 cities saw year-over-year declines.
 Click on graph for larger image in new window.
 The first graph shows the nominal not seasonally adjusted Composite 10 and Composite 20 indices (the Composite 20 was started in January 2000).
The Composite 10 index is off 30.0% from the peak, and up slightly in February (SA).
The Composite 20 index is off 29.3% from the peak, and down slightly in February (SA).
 The second graph shows the Year over year change in both indices.
The Composite 10 is up 1.4% compared to February 2009.
The Composite 20 is up 0.6% compared to February 2009.
These are the first YoY price increases since 2006.
The third graph shows the price declines from the peak for each city included in S&P/Case-Shiller indices.
 Prices decreased (SA) in 15 of the 20 Case-Shiller cities in February.
 Prices in Las Vegas are off 55.7% from the peak, and prices in Dallas only off 6.0% from the peak.
Note: Congratulations to S&P: the new release format is excellent.
Morning Greece: Contagion Concerns
by Calculated Risk on 4/27/2010 08:24:00 AM
Greek government debt yields increased again this morning (ht Mike), from Bloomberg:
 |
From Bloomberg: Portugal Suffering Greek Contagion Pressures EU Bonds
With a higher debt burden and a slower 10-year growth rate than Greece, Western Europe’s poorest country is being punished by investors as the sovereign debt crisis spreads. ... Portugal’s credit default swaps show investors rank its debt as the world’s eighth-riskiest, worse than for Lebanon and Guatemala.From Bloomberg: Greece Bond Losses to Be ‘Significant,’ Buiter Says
Greece is likely to default or inflict “significant” losses on bondholders unless it receives more generous terms on its planned aid package, according to Willem Buiter, chief economist at Citigroup Inc.
Shanghai Composite index down 2.1%
by Calculated Risk on 4/27/2010 12:34:00 AM
Since I haven't posted a graph of the Shanghai index in some time ...
From MarketWatch: Shanghai Composite index down 2.1% at midday break
Mainland Chinese shares extend losses in the Tuesday morning session, with sharp retreats in commodity producers further pressuring markets already weighed by fears of policy tightening, especially in the property sector.
 Click on graph for larger image in new window.
This graph shows the Shanghai SSE Composite Index and the S&P 500 (in blue).
The SSE Composite Index is at 2,906.35 mid-day.
Monday, April 26, 2010
Home Tax Credit a Costly Failure
by Calculated Risk on 4/26/2010 09:40:00 PM
From David Kocieniewski at the NY Times: Home Tax Credit Called Successful, but Costly
Though the Treasury Department and the real estate industry have termed the program a success, helping 1.8 million people buy homes, many tax policy experts say it has been singularly cost-ineffective: most of the $12.6 billion in credits through end of February was collected by people who would have bought homes anyway or who in some cases were not even eligible.There is no question this program was very costly. And why is the Treasury confusing activity with accomplishment? Sure sales briefly surged, but were new households formed? How many new jobs were created?
“We were happy in our apartment, but $8,000 was just too much to pass up,” said [Mr. James Green, a student at Purdue University], 29, who shopped furiously with his wife for two months before signing a contract in March to buy a three-bedroom ranch.This is very optimistic - the ratio was probably 5-to-1 for the initial credit and even higher for the extension. But this shows two failures of the tax credit: 1) the high cost, and 2) it was just moving people from apartments to homes and didn't reduce the excess housing inventory (yes, rentals count as housing inventory too).
“We bid on a couple places that didn’t work out,” he said, “but we always made sure we had a backup plan because we didn’t want to miss the deadline for the credit. And when we finally agreed to a contract, it was this huge relief.”
For every home buyer like the Greens, real estate agents say there are at least three others who collected the credit even though they would have bought without it. That means for each new buyer who was truly lured into the market by the credit, the federal government paid more than $30,000.
“The tax credit helped to stanch the price declines, which had substantial benefit for the entire economy,” said Mark Zandi at Moody’s Economy.com.And this has been the policy - support asset prices by limiting the supply (all the foreclosure delays), and pushing demand (low mortgage rates and the tax credit). This has helped the banks significantly, and Zandi argues this has boosted confidence. Maybe ... but I'm not convinced that supporting house prices above the market clearing level to help the banks and boost consumer confidence makes sense. I think targeting jobs - and therefore household formation - would have been a far more cost effective program.
Yield on Greek Two-Year Bonds jumps to 13.5%
by Calculated Risk on 4/26/2010 05:49:00 PM
From the Financial Times: Greek bond markets plunge again
The yield on two-year Greek government bonds ... jumped 3 percentage points ... to close at 13.522 per cent.This is now higher than Venezuela at 11%.
This is the highest yield on short-dated government debt in the world ...
excerpt with permission
The yields jumped for some of the other PIIGS too (Portugal, Ireland, Italy, Greece and Spain). For Portugal the two-year yield increased more than 3/4 of a point to 3.98%.
New Offering: Bullet Proof Mortgage Backed Securities
by Calculated Risk on 4/26/2010 01:45:00 PM
There was an article on Bloomberg last week about "the first new-mortgage securities without government-backed guarantees in more than two years": Redwood, Citigroup End Two-Year Mortgage-Bond Drought (ht Brian)
My reaction was that these will be all low LTV mortgages with stellar credit ratings. I guessed the mortgages were essentially "bullet proof" ... Sure enough, here is the SEC filing: Sequoia Mortgage Trust 2010-H1 (ht Ramsey Su)
The details of the mortgages and the borrowers start on page 16. This is for 255 mortgages with an aggregate principal balance of $238 million. The weighted FICO score is 768, and the average Loan-to-Value is 56%.
Most are just refis of existing mortgage on owner occupied properties. There are 52 purchase mortgage with an average of just over 30% down.
This deal will close this week. Ramsey is concerned the media will hype this transaction. He points out that the sponsors cherry picked the mortgages and he wrote "these are the crème de la crème of mortgages". In addition the sponsors are taking the first loss positions:
"The sponsor (or affiliates of the sponsor) will initially retain the following certificates: (i) all of the Non-Offered Certificates, representing 6.50% of the original principal balance of the securitization, and (ii) 5% of the original principal balance of Offered Certificates."There are plenty of details - heck, 22 of the borrowers make over $100,000 per month (yes, per month).
This is as close to bulletproof as it gets.
First American CoreLogic: House Prices Decline 2.0% in February
by Calculated Risk on 4/26/2010 10:48:00 AM
The Fed's favorite house price indicator from First American CoreLogic’s LoanPerformance ...
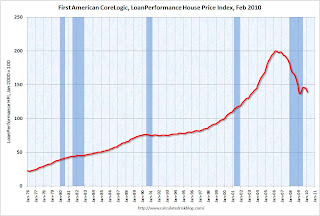
From LoanPerformance: Home Price Index Shows First Annual Increase in Over Three Years, But Shadow Inventory and End of Tax Credit Program May Result in Further Declines
National home prices, including distressed sales, increased by 0.3 percent in February 2010 compared to February 2009, according to First American CoreLogic and its LoanPerformance Home Price Index (HPI). This was an improvement over January’s year-over-year price decline of 0.5 percent. Excluding distressed sales, year-over-year prices increased in February by 0.6 percent; an improvement over the January non-distressed HPI which fell by 1.1 percent year-over-year.
On a month-over-month basis, the national average home price index fell by 2.0 percent in February 2010 compared to January 2010, which was steeper than the previous one-month decline of 1.6 percent from December to January. Prices are typically weak in the winter months, so seasonal effects may be driving this one-month change.
 Click on graph for larger image in new window.
 This graph shows the national LoanPerformance data since 1976. January 2000 = 100.
The index is up 0.3% over the last year, and off 30.6% from the peak.
House prices are off 4.9% from the recent peak in August 2009 (although some of the decline is seasonal).
With all the distressed sales and government programs, it is hard to separate the seasonal factors from other distortions. However I expect that we will see lower prices on this index later this year - as does CoreLogic (from the press release):
After a modest increase this spring and summer, the national single-family combined index is projected to decline by 3.4 percent from February 2010 to February 2011 assuming the expiration of current Federal Housing Stimulus programs.
Q1 2010: Homeownership Rate Lowest Since Q1 2000
by Calculated Risk on 4/26/2010 10:00:00 AM
The Census Bureau reported the homeownership and vacancy rates for Q1 2010 this morning. Here are a few graphs ...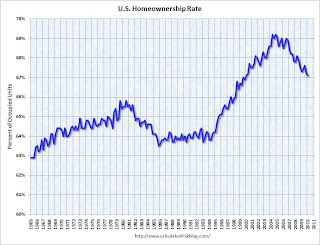 Click on graph for larger image in new window.
The homeownership rate declined to 67.1%. This is the lowest level since Q1 2000.
Note: graph starts at 60% to better show the change.
The homeownership rate increased in the '90s and early '00s because of changes in demographics and "innovations" in mortgage lending. The increase due to demographics (older population) will probably stick, so I've been expecting the rate to decline to the 66% to 67% range - and not all the way back to 64% to 65%.  The homeowner vacancy rate was 2.6% in Q1 2010.
A normal rate for recent years appears to be about 1.7%.
This leaves the homeowner vacancy rate about 0.9% above normal. This data is not perfect, but based on the approximately 75 million homeowner occupied homes, we can estimate that there are close to 675 thousand excess vacant homes.
The rental vacancy rate was 10.6% in Q1 2010.  It's hard to define a "normal" rental vacancy rate based on the historical series, but we can probably expect the rate to trend back towards 8%. According to the Census Bureau there are close to 41 million rental units in the U.S. If the rental vacancy rate declined from 10.6% to 8%, there would be 2.6% X 41 million units or over 1 million units absorbed.
This suggests there are still about 1.7 million excess housing units, and these excess units will keep pressure on housing starts, rents and house prices for some time.
Greece: 10-Year debt yield spread widens to new record
by Calculated Risk on 4/26/2010 08:36:00 AM
From The Times: Pressure mounts on Greek Government as cost of borrowing rises above 9 per cent
The bond markets hammered Greek government debt this morning, raising the cost of borrowing for the eurozone nation above 9 per cent.From the WSJ: Cost of Insuring Greek Debt Soars
[T]he gap in yields between 10-year debt from Greece and Germany—the euro-zone's most solid borrower—swinging out to a new record of 6.11 percentage points. That yield spread stood at 5.63 percentage points after Greece asked to activate the aid package Friday.On May 19th, €8.5bn of Greece's bonds mature - so there is very little time left to work out the details of a loan package.
Sunday, April 25, 2010
Krugman: "Berating the Raters"
by Calculated Risk on 4/25/2010 11:59:00 PM
From Paul Krugman in the NY Times: Berating the Raters
[T]he e-mail messages you should be focusing on are the ones from employees at the credit rating agencies, which bestowed AAA ratings on hundreds of billions of dollars’ worth of dubious assets, nearly all of which have since turned out to be toxic waste. And no, that’s not hyperbole: of AAA-rated subprime-mortgage-backed securities issued in 2006, 93 percent — 93 percent! — have now been downgraded to junk status.The rating agencies played a key role in the housing bubble. They used models based on historical performance for mortgages, and didn't account for the "innovations" in lending such as the entire chain of the originate-to-distribute model: automated underwriting, reliance on FICO scores instead of the 3 Cs (creditworthiness, capacity, and collateral), agency issues with the widespread use of independent mortgage brokers, expanded securitization, non-traditional mortgage products, etc.
What those e-mails reveal is a deeply corrupt system.
...
The Senate subcommittee has focused its investigations on the two biggest credit rating agencies, Moody’s and Standard & Poor’s; what it has found confirms our worst suspicions. In one e-mail message, an S.& P. employee explains that a meeting is necessary to “discuss adjusting criteria” for assessing housing-backed securities “because of the ongoing threat of losing deals.” Another message complains of having to use resources “to massage the sub-prime and alt-A numbers to preserve market share.”
Of course the rating agencies just offered "opinions", and unknown to investors, those valued opinions were apparently quite malleable.
How does the new financial regulation fix this problem?
China Real Estate
by Calculated Risk on 4/25/2010 09:08:00 PM
First - here is the weekly summary and a look ahead ...
From David Pierson at the LA Times: In China, real estate fever is rising
Hundreds of miles inland from the booming real estate markets of Beijing and Shanghai, an unlikely property fever is gripping this middling industrial outpost.And on speculators:
...
Taxi drivers boast of owning multiple flats for investment. Billboards hawk developments with names such as Villa Glorious and Rich Country. Frenzied crowds pack sales events with bags of cash, buying units that exist only on blueprints. Average home values in Hefei soared 50% last year.
...
"No one had any idea real estate would get this hot here," said Huang Qingyuan, a sales agent for one of Hefei's most expensive housing estates — they go for about $120,000 per apartment.
While pricey by local standards, that's still a fraction of what homes cost in the capital.
[In a building that is sold out, Guo Hongbing, a marketing consultant for several developers] was interested in estimating how many were left empty by investors. His unscientific method? Looking for curtains.A few key points:
"See, less than half that building is occupied," he said, pointing to one block with several bare windows. "These speculators want to buy as many possible."
Of course the rules could change. From Esther Fund at the WSJ: China Considers U.S.-Style Property Tax
China is considering introducing new or higher taxes on real estate, possibly even a U.S.-style property tax, which would mark a significant escalation of its struggle to cool down a booming property market now widely being described as a bubble.This is different than the loose credit driven bubble in the U.S. Per my friend Michael in China:
How authorities handle any kind of property tax—the prospect of which is fiercely opposed by some property developers—will have significant implications for China's economy ...
The majority of homes in China are purchased with down payments between 30-40%, which is required by the banks, and nearly 25% of homes are purchased with all cash. Only those qualifying for low-cost housing can purchase a home with a minimum down payment as low as 20%.If anything the lending is stricter now. But this property tax proposal (or something similar) could have a real impact.
Sunday afternoon Greece: "Most important week of Europe’s monetary union"
by Calculated Risk on 4/25/2010 04:04:00 PM
The previous post was the weekly summary and a look ahead ...
On Greece, from the Financial Times: Greek aid depends on budget cut plans
Greece has been told to produce detailed plans this week to meet its budget deficit reduction targets in 2011 and 2012, as well as this year, before it can qualify for a ... rescue package ...And from Wolfgang Münchau at the Financial Times: Greece is Europe’s very own subprime crisis
excerpt with permission
This is going to be the most important week in the 11-year history of Europe’s monetary union. By the end of it we will know whether the Greek fiscal crisis can be contained or whether it will metastasise to other parts of the eurozone.Münchau suggests three things to watch: 1) to see if Greece presents a credible plan (Münchau says what he has heard is "deeply discouraging"), 2) that the loan package has to be substantially more than €45bn (Münchau says €80bn) and 3) the situation in Germany (Angela Merkel is still struggling for support).
Meanwhile from Bloomberg: Papaconstantinou Tells Investors Don’t Attack Greece
[Greek Finance Minister George Papaconstantinou] expressed confidence the talks will be “concluded rather soon” and said his country wouldn’t restructure its debt.A key date is May 19th when €8.5bn of Greece's bonds mature.
Weekly Summary and a Look Ahead
by Calculated Risk on 4/25/2010 11:45:00 AM
The key economic stories this week will be house prices, the FOMC meeting and the “advance estimate” for Q1 GDP to be released on Friday.
On Monday the LoanPerformance house price index (for February) will probably be released. Also on Monday, the Census Bureau report on Housing Vacancies and Homeownership for Q1 will be released at 10 AM. Although noisy quarter-to-quarter, this report has been showing a declining homeownership rate. The vacancy rates for homeowners and renters have probably peaked, but both will still be near record levels.
On Tuesday the February Case-Shiller Home Price Index will be released at 9 AM by S&P. This will be confused by the recent S&P release cautioning about the seasonal adjustment. Also on Tuesday the Conference Board will release consumer confidence at 10 AM, and Fed Chairman Bernanke, budget director Peter Orszag, and others will speak at President Obama’s debt-reduction commission.
The Federal Open Market Committee (FOMC) is meeting on Tuesday and Wednesday, and the FOMC statement will be released on Wednesday at around 2:15 PM . Although there will be no change to the Fed Funds rate, or to the “extended period” language, there might be a few minor changes to the statement – perhaps a little more upbeat on the economy, maybe some discussion of eventual asset sales to appease a few hawkish members (not going to happen any time soon), and perhaps a comment on disinflation or the weak housing market.
On Thursday the closely watched initial weekly unemployment claims will be released. The consensus is for a decline to 446K this week from 456K last week. Also on Thursday (or earlier in the week) the ATA Truck Tonnage Index for March will be released.
And on Friday, the Advance Q1 GDP report will be released by the BEA at 8:30 AM. The consensus is for an annualized increase of 3.4%. Also on Friday, the Chicago Purchasing Managers Index for April, and the March Restaurant Performance index will be released. And of course the FDIC will probably be busy Friday afternoon ...
And a summary of last week:
The Census Bureau reported New Home Sales in March were at a seasonally adjusted annual rate (SAAR) of 411 thousand. This was an increase from the revised rate of 324 thousand in February (revised from 308 thousand).
 Click on graphs for larger image in new window.
The first graph shows monthly new home sales (NSA - Not Seasonally Adjusted).
Note the Red columns for 2010. In March 2010, 38 thousand new homes were sold (NSA).
The record low for March was 31 thousand in 2009.
 Months of supply declined to 6.7 in March from 8.6 in February. This is significantly below the all time record of 12.4 months of supply set in January 2009, but still higher than normal.
New home sales are counted when the contract is signed, so this pickup in activity is probably related to the tax credit. Note that that a few thousand extra sales NSA in March can make a huge difference in the SAAR.
The NAR reported: Existing-Home Sales Rise
Existing-home sales ... rose 6.8 percent to a seasonally adjusted annual rate of 5.35 million units in March.
 This graph shows existing home sales, on a Seasonally Adjusted Annual Rate (SAAR) basis since 1993.
 Sales in March 2010 (5.35 million SAAR) were 6.8% higher than last month, and were 16.1% higher than March 2009 (4.61 million SAAR).
Note: existing home sales are counted at closing, so even though contracts must be signed in April to qualify for the tax credit, buyers have until June 30th to close.
 This graph shows the year-over-year change in reported existing home inventory and months-of-supply.
The YoY inventory has been decreasing for the last 20 months. However the YoY decline is getting smaller - only 1.8% in March.
This slow decline in the inventory is especially concerning with the large reported inventory and 8.0 months of supply in March - well above normal.
 This graph shows NSA monthly existing home sales for 2005 through 2010 (see Red columns for 2010).
 Sales (NSA) in March 2010 were 19.6% higher than in March 2009, and also higher than in March 2008.
We will probably see an increase in sales in May and June - perhaps to the levels of 2006 or 2007 - because of the tax credit, however I expect to see existing home sales below last year in the 2nd half of this year.
 From the AIA: Billings Index Inches Up in March
Note: This index is a leading indicator for Commercial Real Estate (CRE) investment.
This graph shows the Architecture Billings Index since 1996. The index has remained below 50, indicating falling demand, since January 2008.
 The Department of Transportation (DOT) reported that vehicle miles driven declined year-over-year in February.
This graph shows the percent change from the same month of the previous year as reported by the DOT.
Miles driven in February 2010 were down -2.9% compared to February 2009.
The Moody’s/REAL All Property Type Aggregate Index declined 2.6% in February. This is a repeat sales measure of commercial real estate prices.
 CRE prices only go back to December 2000.
The Case-Shiller Composite 20 residential index is in blue (with Dec 2000 set to 1.0 to line up the indexes).
Commercial real estate values are now down 25.8% over the last year, and down 41.8% from the peak in August 2007.
Senate panel: Ratings agencies rolled over for Wall Street
Best wishes to all.


