 RSS Feed
 by Calculated Risk on 3/25/2010 08:37:00 PM
Thursday, March 25, 2010
Principal Reduction, Greece Bailout and Other Stories
1) From David Streitfeld and Sewell Chan at the NY Times: U.S. Plans to Expand Aid to Troubled Homeowners
One major element of the program ... will strongly encourage lenders to write down the value of loans for borrowers in modification programs. Until now, modification programs have focused on lowering interest rates.2) From the WSJ: Europeans Agree on Bailout for Greece
Leaders of the 16-nation euro zone ... backed a deal under which they and the International Monetary Fund would jointly bail out Greece should the country's debt troubles intensify.3) Tallest office tower in Seattle is "underwater", from Eric Pryne at the Seattle Times: Columbia Center misses mortgage payment
The agreement won't immediately trigger a Greek rescue, but it lays the groundwork for both the first intervention by the IMF in a euro-zone country and a major relaxation of the tight restrictions on country-to-country bailouts that have been a feature of the currency union since its birth.
When [Beacon Capital Partners] bought the Columbia Center in April 2007 it was 89 percent leased. The firm paid $621 million, according to county records, and borrowed a total of $480 million to help pay for the tower.4) From Mary Ann Milbourn at the O.C. Register: 130,000 in Calif. due to lose jobless benefits
... At the Columbia Center ... almost 600,000 square feet — nearly 40 percent of the building — is listed as "available" on online commercial real-estate database Officespace.com. ... Its assessed value now is $380 million.
As many as 130,000 Californians are expected to exhaust their unemployment benefits within the next three weeks, based on estimates from the state Employment Development Department. About 3,300 already have fallen off the unemployment rolls.
Currently, the unemployed in California are eligible for up to 99 weeks of benefits — 26 weeks of regular unemployment plus four extensions and so-called FedEd relief.
Loree Levy, an EDD spokeswoman, said it was the first time in two years that the department is seeing large numbers of people running out of benefits.
Treasury to Announce Updates on Housing Policy and Principal Reduction
by Calculated Risk on 3/25/2010 05:55:00 PM
Senior administration officials will update reporters on the Obama administration’s housing policy on Friday at 10 AM ET. This will include Michael Barr and Herbert Allison, both from Treasury, FHA Commissioner David Stevens, and Diana Farrell of the National Economic Council.
Complete details will be available tomorrow, but I've been told ...
1) Principal reduction will be optional, but it will at the top of the waterfall.
Note on current "Waterfall": Right now according to HAMP guidelines, "servicers must apply the modification steps enumerated below in the stated order of succession until the borrower’s monthly mortgage payment ratio is reduced as close as possible to 31 percent ...
Step 1: Capitalization of accrued interest and expenses.
Step 2: "Reduce the starting interest rate in increments of .125 percent to get as close as possible to the target monthly mortgage payment ratio. The interest rate floor in all cases is 2.0 percent."
Step 3: Extend the term and reamortize.
Step 4: If necessary, the servicer must provide for principal forbearance to achieve the target monthly mortgage payment ratio.
2) Servicers will be required to completely underwrite each loan.
3) Apparently after the new underwriting, the FHA might take out some of the loans. This will be interesting to see the details ...
4) TARP funds will be used to make this work (not clear how much or for what purpose).
5) These changes will apparently take effect in September.
And from the WaPo: Obama administration to order lenders to cut mortgage payments for jobless
The Obama administration plans to overhaul how it's tackling the foreclosure crisis, in part by requiring lenders to temporarily slash or eliminate monthly mortgage payments for many borrowers who are unemployed, senior officials said Thursday.
...
The administration's newest push also seeks to more aggressively help borrowers who owe more on their mortgages than their properties are worth, by encouraging lenders to cut the loan balances of millions of these distressed homeowners and possibly refinance into loans backed by the Federal Housing Administration.
...
For one, the government will for the first time provide financial incentives to lenders that cut the balance of a borrower's mortgage. ...
Second, government will double the amount it pays to lenders that help modify second mortgages ...
Third, the administration is increasingly turning to the Federal Housing Administration to help underwater borrowers who are still keeping up their payments. ...
Countdown: Fed MBS Purchase Program
by Calculated Risk on 3/25/2010 03:27:00 PM
One week and $2 billion to go ... (UPDATE: Mortgage News Daily says $6.1 billion left).
So the program is essentially over. We should be watching to see if 10 Year Treasury yields rise - and if mortgages take "a beating".
From the Atlanta Fed weekly Financial Highlights released today (as of last week): Click on graph for larger image in new window.
Graph Source: Altanta Fed.
This graph shows the cumulative MBS purchases by week. From the Atlanta Fed:
The NY Fed purchased an additional net $8 billion in MBS for the week ending March 24th. This puts the total purchases at $1.248 trillion or 99.84% complete. Just $2 billion and one more week to go ...The Fed purchased a net total of $10 billion of agency-backed MBS through the week of March 17. This purchase brings its total purchases up to $1.24 trillion, and by the end of the first quarter of 2010 the Fed will have purchased $1.25 trillion (thus, it is 99% complete).
Note: The Fed's balance sheet shows significant less MBS. As mentioned before, the difference is the NY Fed announces the purchases when they contract to buy; the Federal Reserve places the MBS on the balance sheet when the contract settles. The Fed's balance sheet will probably expand by close to $200 billion over the next two months as the remaining contract settle.
Servicer: "You HAFA to be kidding"
by Calculated Risk on 3/25/2010 01:28:00 PM
IMPORTANT note from CR: The following is from long time reader Shnaps (the views are his). Shnaps has been working in the mortgage industry in various capacities "since people were extending the antennas on their mobile phones". Shnaps currently serves in a key role related to HAMP at one of the largest non-prime mortgage servicers in the Nation.
Shnaps offered to write a couple of posts from the viewpoint of a servicer.
Several readers reacted negatively to Shnaps previous post. Shnaps writes: "Most HAMP applicants ARE hurting, no doubt. But that shouldn't justfy a free pass for the minority of applicants who are just trying to take advantage. That was the point of the post."
One might suppose that after the abject failure that HAMP has proven to be at modifying mortgages for ’millions’ of struggling homeowners, the US Treasury might have learned something before rolling out ‘HAFA’. This scheme was briefly known, in its conceptual stage, as FAP(!) - short for ‘Foreclosure Avoidance Program’. It eventually was redubbed HAFA - which is short for ‘Home Affordable Foreclosure Alternatives’. Whatever they call it, the program’s purported goal is to help (millions?) of Americans avoid the horror of foreclosure via the slightly-less -awful ‘deed-in-lieu’ alternative.
For those just tuning in and asking “What is a ‘deed-in-lieu’?” - allow me to explain. This term is used to describe a situation in which a mortgagor voluntarily turns over the deed to the mortgaged property to the mortgagee ‘in lieu’ of a foreclosure. It’s different than the mortgagee taking ownership via foreclosure in two key ways: first, in the sense that it is ‘voluntary’, and also in that a deed transferred in this manner would come subject to any other liens. So for this to happen, realistically – there better not be any other liens. The other option HAFA incentivizes is similar – the so-called ‘short-sale’, which basically amounts to the borrower doing the bank’s customary post-foreclosure task of liquidating the collateral for them. In exchange, the borrower may receive $1500 “walkin’ around money”, forgiveness of any deficiency balance remaining, and a less-severe hit to their credit record as the cherry on top.
Sound like a good deal for the borrower? Eh, maybe. In most cases, the biggest incentive for them is that by going the HAFA route they might get back in the credit game a couple years earlier than they would by doing nothing (and being foreclosed upon).
Now if you think the borrowers have a rather minimal incentive to participate in HAFA, get a load of the, uh, not so tasty treat that HAFA wishes to serve up to second-lien holders. In a foreclosure, people seem to be fond of pointing out that such subordinate liens ‘get nothing’ insofar as their lien interest in the property is extinguished. However, that party’s claim to the money that they are owed is not otherwise diminished. For some reason, the HAFA scheme thinks that second lien holders should not only release their lien, but also waive their right to collect on the money they are owed. In exchange, they may receive as much as $3000, which might cover their administrative cost of participating in the program - provided they do enough of these deals. Hello!? This is the reason the entire program is a non-starter – virtually all of the borrowers who might be interested in this program have huge second liens.
Not that it matters, but for those wondering ‘How about the party servicing the first mortgage? What’s in it for them?’ In short: A thousand bucks, a potentially shortened timeline to liquidation, and perhaps diminished risk that the property will end up trashed. That’s not bad – except that with short-sales come tremendous opportunities for fraud in the form of collusion, and non-arms-length transactions, leading to such unwanted outcomes such as ‘flopping’.
I really don’t ‘get’ HAFA at all. I have to assume it is just being rolled out to make HAMP look like a relative success.
CR Note: This was from Shnaps who works for one of the largest non-prime mortgage servicers in the U.S. My view is HAFA will help with the process, but as I noted before, the 2nd liens are a huge stumbling block.
Hotel Occupancy increases compared to same week in 2009
by Calculated Risk on 3/25/2010 12:13:00 PM
From HotelNewsNow.com: STR: NYC leads weekly occupancy rate gains
Overall, the U.S. industry’s occupancy ended the week with a 5.2-percent increase to 61.4 percent. Average daily rate dropped 1.9 percent to finish the week at US$98.30. Revenue per available room for the week was up 3.2 percent to US$60.39—the third consecutive week that RevPAR experience a year-over-year increase.The following graph shows the occupancy rate by week since 2000, and the rolling 52 week average occupancy rate.
 Click on graph for larger image in new window.
Note: the scale doesn't start at zero to better show the change.
The graph shows the distinct seasonal pattern for the occupancy rate; higher in the summer because of leisure/vacation travel, and lower on certain holidays.
Although the occupancy rate is up 5.2% over the same week last year, the level is still well below normal - the average occupancy rate for this week is close to 65%, significantly above the current 61.4%.
The low than normal occupancy rate is still pushing down room rates (on a YoY basis) although revenue per available room (RevPAR) increased for the third straight week.
Data Source: Smith Travel Research, Courtesy of HotelNewsNow.com
Bernanke: Federal Reserve's exit strategy
by Calculated Risk on 3/25/2010 10:04:00 AM
Fed Chairman Ben Bernanke is testifying before the House Committee on Financial Services: Federal Reserve's exit strategy
This is mostly a technical discussion, but the Q&A might be interesting.
Here is the CNBC feed.
Here is the C-Span Link (updated link)
Weekly Initial Unemployment Claims Decrease
by Calculated Risk on 3/25/2010 08:30:00 AM
The DOL reports on weekly unemployment insurance claims:
In the week ending March 20, the advance figure for seasonally adjusted initial claims was 442,000, a decrease of 14,000 from the previous week's revised figure of 456,000. The 4-week moving average was 453,750, a decrease of 11,000 from the previous week's revised average of 464,750.
...
The advance number for seasonally adjusted insured unemployment during the week ending March 13 was 4,648,000, a decrease of 54,000 from the preceding week's revised level of 4,702,000.
 Click on graph for larger image in new window.
This graph shows the 4-week moving average of weekly claims since 1971.
The four-week average of weekly unemployment claims decreased this week by 11,000 to 453,750.
The dashed line on the graph is the current 4-week average. The current level of 442,000 (and 4-week average of 453,750) is still high, and suggests continuing weakness in the jobs market. Note: There is no way to compare directly between weekly claims, and net payrolls jobs.
Note: by request, next week I'll post a graph as a percent of covered employment.
Wednesday, March 24, 2010
China Official: "Will not adjust exchange rate"
by Calculated Risk on 3/24/2010 11:58:00 PM
From Sewell Chan at the NY Times: China Says It Will Not Adjust Policy on the Exchange Rate
After meeting with officials at the Treasury and Commerce Departments on Wednesday, China’s deputy commerce minister, Zhong Shan, told reporters, “The Chinese government will not succumb to foreign pressures to adjust our exchange rate."This is more posturing before the Treasury releases the worldwide currencies report on April 15th that might name China a "currency manipulator".
...
“It is wrong for the United States to jump to the conclusion that China is manipulating currency from the sheer fact that China is enjoying a trade surplus,” Mr. Zhong told reporters in a meeting at the Chinese Embassy. “Besides, it’s wrong for the United States to press for the appreciation of the renminbi and threaten to impose punitive tariffs on Chinese experts. This is unacceptable to China.”
Fed Vice Chairman Assigns Homework for Monetary Policymakers
by Calculated Risk on 3/24/2010 08:01:00 PM
From Fed Vice Chairman Donald Kohn: Homework Assignments for Monetary Policymakers
Kohn's assignments:
1) "One assignment is to evaluate the implications of the changing character of financial markets for the design of the liquidity tools the Federal Reserve has at its disposal when panic-driven runs on banks and other key financial intermediaries and markets threaten financial stability and the economy."
2) "In addition to providing liquidity on an unprecedented scale, we reduced our policy interest rate (the target for the rate on overnight loans between banks) effectively to zero, and then we continued to ease financial conditions and cushion the effect of the financial shock on the economy by making large-scale purchases of several types of securities. My second assignment involves improving our understanding of the effects of those purchases and the associated massive increase in bank reserves."
3) "Number three involves considering whether central banks should use their conventional monetary policy tool--adjusting the level of a short-term interest rate--to try to rein in asset prices that seem to be moving well away from sustainable values, in addition to seeking to achieve the macroeconomic objectives of full employment and price stability."
4) "The fourth and final assignment concerns whether central banks should adjust their inflation targets to reduce the odds of getting into a situation again where the policy interest rate reaches zero."
All four topics are interesting ... Kohn believes that the inflation target should be around 2%, and that the impact on rates from the MBS purchase program "comes mainly from the total amount we purchase relative to the total stock of debt outstanding", not the flow of purchases - suggesting little increase in mortgage rates when the Fed stops buying MBS in a week.
New Home Sales, Modifications, and Other News
by Calculated Risk on 3/24/2010 04:11:00 PM
1) New Home sales. New Home sales were at a record low in February. The weather might be partially to blame for the February record, but the reality is there are just too many existing home units available - so new home sales and single family housing starts will be under pressure for some time - and also housing related employment.
New home sales will probably get a boost in March and April from the homebuyer tax credit. To qualify, homebuyers must sign a contract by the end of April and close by the end of June. Since new home sales are counted when the contract is signed, any boost will happen in March or April. For existing home sales, the boost will come when the deal closes, so the boost to sales will come in May or June.
2) Modification Programs
The reason this program is so important though is because we know something is in the works over at Treasury to do something like it. We may even get news of that later this week, according to some of my sources.
3) And in other news today:
4) And on the Consumer financial protection agency from Jodi Kantor at the NY Times: Behind Consumer Agency Idea, a Fiery Advocate
Ask Elizabeth Warren, scourge of Wall Street bankers, how they treat consumers, and her no-nonsense bob will shake with indignation. She will talk about morality, about fairness, about what she calls their “let them eat cake” attitude towards taxpayers. If she is riled enough, she might even spit out the Warren version of an expletive.
“Dang gummit, somebody has got to stand up on behalf of middle-class families!” she exclaimed in a recent interview in her office here.
BofA's Principal Reduction Plan
by Calculated Risk on 3/24/2010 01:15:00 PM
Here is the BofA plan mentioned last night ... this is for specific loans only (Countrywide subprime, Option ARMs and a few others), and BofA estimates this will apply to about 45,000 borrowers for a total of about $3 billion in principal reduction.
From BofA: Bank of America Introduces Earned Principal Forgiveness Among Enhancements to Its National Homeownership Retention Program
Bank of America announced it will look first at principal forgiveness – ahead of an interest rate reduction – when modifying certain subprime, Pay-Option and prime two-year hybrid mortgages qualifying for its National Homeownership Retention Program (NHRP). Several enhancements are being made to the program, including the introduction of an earned principal forgiveness approach to modifying mortgages that are severely underwater.
...
Bank of America developed and launched the NHRP in 2008, in cooperation with state attorneys general, to provide assistance to Countrywide borrowers who financed their home with certain subprime and Pay-Option adjustable rate mortgages (ARMs). Bank of America removed these from the Countrywide product line upon acquiring Countrywide in July 2008.
These new components of the agreement apply to certain NHRP-eligible loans that also meet the basic qualifications for the government's Home Affordable Modification Program. They include:
• A first look at principal reductions in calculating an affordable payment through an earned principal forgiveness approach to severely underwater loans."The centerpiece of these enhancements is a program of earned principal forgiveness that addresses severely underwater mortgages with some of the highest rates of delinquency – specifically subprime loans, Pay-Option ARMs and prime two-year hybrid ARMs that are 60 days or more delinquent with a principal balance of 120 percent or more," said Barbara Desoer, president of Bank of America Home Loans.
• Principal forgiveness through a reduction of negative-amortization on certain Pay-Option ARMs.
• Conversion of certain Pay-Option ARMs to fully amortizing loans prior to a recast.
• Addition of certain prime two-year hybrid ARMs as eligible for the NHRP mortgage modification programs.
• Inclusion of Countrywide mortgages originated on or before January 1, 2009, as eligible for modifications under the terms of the NHRP.
• A six-month extension of the term of the NHRP program to December 31, 2012.
Home Sales: Distressing Gap
by Calculated Risk on 3/24/2010 12:38:00 PM
The following graph shows existing home sales (left axis) and new home sales (right axis) through February. I jokingly refer to this as the "distressing gap". Click on graph for larger image in new window.
The initial gap was caused by the flood of distressed sales. This kept existing home sales elevated, and depressed new home sales since builders couldn't compete with the low prices of all the foreclosed properties.
The spike in existing home sales last year was due primarily to the first time homebuyer tax credit.
Notice that there was also a bump last year in new home sales from the tax credit.
NOTE: New home sales and existing home sales are reported at different times: new home sales are reported when the contract is signed, and existing home sales are reported when the deal closes. So the bump in new home sales last year happened earlier than the spike in existing home sales.
The same thing will happen over the next few months. Any bump in new home sales from the tax credit will happen in March and April - when the contract is signed. Any bump in existing home sales will probably happen in May and June when escrow closes.
The second graph shows the same information as a ratio - new home sales divided by existing home sales - through February 2010. (In previous posts about this ratio, I graphed existing home sales divided by new home sales - this is the same ratio inverted). This ratio is near the all time low set last November. In November existing home sales were artificially boosted by the first time home buyer tax credit - but as mentioned above - the bump in new home sales had happened earlier.
Eventually this ratio will return to the historical range of new home sales being around 15% to 20% of existing home sales. However it will probably take a number of years to return to a more normal market.
New Home Sales at Record Low in February
by Calculated Risk on 3/24/2010 10:00:00 AM
The Census Bureau reports New Home Sales in February were at a seasonally adjusted annual rate (SAAR) of 308 thousand. This is a new record low and a decrease from the revised rate of 315 thousand in January (revised from 309 thousand). Click on graph for larger image in new window.
The first graph shows monthly new home sales (NSA - Not Seasonally Adjusted).
Note the Red columns for 2010. In February 2010, 24 thousand new homes were sold (NSA).
This is below the previous record low of 29 thousand hit three times; in February 2009, 1982 and 1970. The second graph shows New Home Sales vs. recessions for the last 45 years. New Home sales fell off a cliff, but after increasing slightly, are now 6% below the previous record low in January 2009.
Sales of new single-family houses in February 2010 were at a seasonally adjusted annual rate of 308,000, according to estimates released jointly today ... This is 2.2 percent (±15.3%)* below the revised January rate of 315,000 and is 13.0 percent (±12.2%) below the February 2009 estimate of 354,000.And another long term graph - this one for New Home Months of Supply.
 There were 9.2 months of supply in February. Rising, but still significantly below the all time record of 12.4 months of supply set in January 2009.
The seasonally adjusted estimate of new houses for sale at the end of February was 236,000. This represents a supply of 9.2 months at the current sales rate.
 The final graph shows new home inventory.
 Note that new home inventory does not include many condos (especially high rise condos), and areas with significant condo construction will have much higher inventory levels.
New home sales are far more important for the economy than existing home sales, and new home sales will remain under pressure until the overhang of excess housing inventory declines much further. Obviously this is another extremely weak report.
MBA: Mortgage Applications Decrease, Rates Rise
by Calculated Risk on 3/24/2010 08:52:00 AM
The MBA reports: Mortgage Refinance Applications Decrease in Latest MBA Weekly Survey
The Market Composite Index, a measure of mortgage loan application volume, decreased 4.2 percent on a seasonally adjusted basis from one week earlier. ...
The Refinance Index decreased 7.1 percent from the previous week and the seasonally adjusted Purchase Index increased 2.7 percent from one week earlier. ...
The refinance share of mortgage activity decreased to 65.0 percent of total applications from 67.3 percent the previous week. This is the lowest refinance share observed in the survey since the week ending October 30, 2009. ...
The average contract interest rate for 30-year fixed-rate mortgages increased to 5.01 percent from 4.91 percent, with points decreasing to 0.76 from 1.30 (including the origination fee) for 80 percent loan-to-value (LTV) ratio loans.
 Click on graph for larger image in new window.
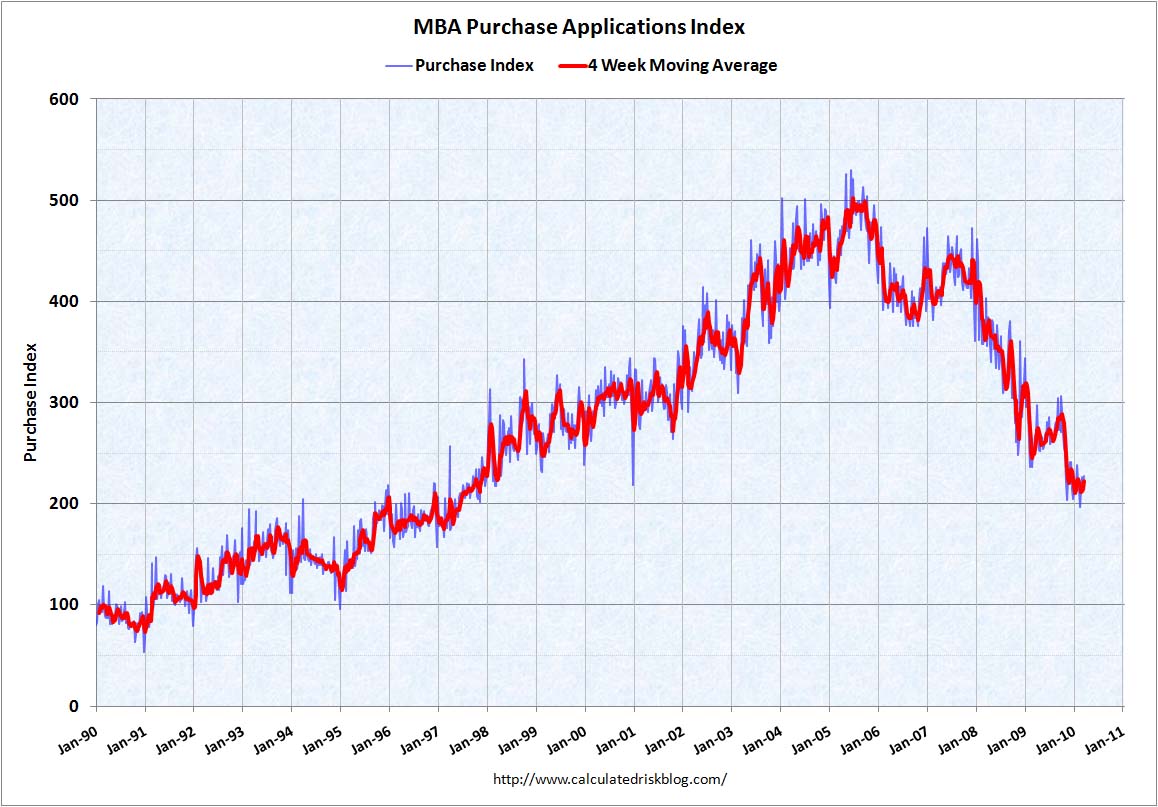
This graph shows the MBA Purchase Index and four week moving average since 1990.
There was a slight increase in purchase applications last week, but the 4-week average is still near the levels of 1997 - after falling sharply at the end of last year. This index shows no indication yet of the expected increase in home sales due to the expiration of the home buyer tax credit.
Report: BofA to Announce Mortgage Principal Reduction Plan
by Calculated Risk on 3/24/2010 05:35:00 AM
From Reuters: BofA to start reducing mortgage principal-sources
Bank of America will ... announce plans to start forgiving mortgage loan principal for troubled homeowners who owe more than 120 percent of their home's value or are battling ever-expanding "negative amortization" loans.Apparently under the plan, the mortgage debt will be reduced to 100% of the house's value over 5 years. The details should be released today by BofA.
According to a summary of the program obtained by Reuters, Bank of America pledged to offer an "earned principal forgiveness" of up to 30 percent in two stages. The lender will first offer an interest-free forbearance of principal that the homeowner can turn into forgiven principal annually over five years, provided they stay current on their payments.
Tuesday, March 23, 2010
AIA: Architecture Billings Index Shows Contraction in February
by Calculated Risk on 3/23/2010 11:59:00 PM
Note: This index is a leading indicator for Commercial Real Estate (CRE) investment. Any reading below 50 indicates contraction.
The WSJ reports that the American Institute of Architects’ Architecture Billings Index increased to 44.8 in February from 42.5 in January.
The ABI press release is not online yet. Click on graph for larger image in new window.
This graph shows the Architecture Billings Index since 1996. The index has remained below 50, indicating falling demand, since January 2008.
The second graph compares the Architecture Billings Index with the year-over-year change in non-residential structure investment.  Historically, according to the AIA, there is an "approximate nine to twelve month lag time between architecture billings and construction spending" on non-residential construction. This suggests further significant declines in CRE investment through all of 2010, and probably longer.
Note: Nonresidential construction includes commercial and industrial facilities like hotels and office buildings, as well as schools, hospitals and other institutions.
California Extends Homebuyer Tax Credit
by Calculated Risk on 3/23/2010 08:03:00 PM
From the Mercury News: Gas tax deal comes with goodies for California home buyers and green-tech manufacturers
The deal reached Monday provides $200 million in new tax credits for homebuyers, to be split evenly among those buying a home for the first time and anyone buying a newly constructed home. Anyone qualified who makes a purchase between this May and August 2011 will receive a credit for 5 percent of the home's purchase price, up to $10,000 over three years.Dumb. Not that there is budget problem in California ...
Fed's Yellen: Outlook for the Economy and Inflation
by Calculated Risk on 3/23/2010 03:43:00 PM
From San Francisco Fed President Janet Yellen: The Outlook for the Economy and Inflation, and the Case for Federal Reserve Independence
Some excerpts on housing (Note: Yellen is likely to be nominated as the next Fed Vice Chairman):
It was housing of course that led the economy down. The great bust wiped out some $7 trillion in home values. In the second half of 2009 though, housing showed signs of stabilizing and I became hopeful that the sector would provide a significant boost to the economy this year. Now the market seems to have stalled. Home prices have been more or less stable since the middle of last year, but new home sales have resumed a downward slide and are at very low levels. Existing home sales spiked towards the end of last year in response to the homebuyer tax credit and have receded markedly since then. The credit expires this spring, removing an important prop. With sales still weak, builders have little incentive to ramp up home construction.As Yellen notes, one of the defining characteristics of this housing bust is how few mortgage delinquencies are cured. Of course when a borrower has equity in their home, they can cure the delinquency by selling. And this time many borrowers have negative equity and can't sell.
The continued high pace of foreclosures also creates risks to the recovery of the housing sector. Mortgage delinquencies and foreclosures are still rising as a consequence of the plunge in house prices over the past few years combined with high levels of unemployment. Despite the return to growth of the broader economy, we’ve seen no let-up in the pace at which borrowers are falling behind in their loans. Further additions to the already swollen stockpile of vacant homes represent a threat to house prices and new home construction activity.
It’s not always easy to understand the dynamics of the housing sector. Last year, for example, the share of mortgages that was 30 to 89 days past due declined. On the face of it, that looked like a hopeful sign. Unfortunately, when my staff examined the numbers more closely, it turned out that the drop actually represented a worsening of mortgage market conditions. What you want to see is delinquent borrowers becoming current. Instead, what happened was that delinquent mortgages moved in the other direction to an even poorer performance status. Many wound up in foreclosure. All in all, I expect that the share of loans that are seriously delinquent will continue to move higher. I am also concerned that we had a temporary reprieve in new foreclosures as the federal government’s trial modification program got under way. But not all of these modifications will stick, which means that some borrowers in the program could find themselves facing foreclosure again.
At the end of this month, the Fed will complete a large-scale program of purchases of mortgage-backed securities issued by Fannie Mae and Freddie Mac. Lenders sell mortgages to these two agencies, which package them as securities sold to investors. Last year, the Fed began buying these securities as part of a series of extraordinary measures to promote recovery. At the time the program was announced, mortgage spreads over yields on Treasury securities of comparable maturity were very high, reflecting in part the disruptions that had occurred in financial markets. I believe that our program worked to narrow those spreads, bringing mortgage rates down and contributing to the stabilization of the housing market. Financial markets have improved considerably over the last year, and I am hopeful that mortgages will remain highly affordable even after our purchases cease. Any significant run-up in mortgage rates would create risks for a housing recovery.
I think Yellen is a little too optimistic on the overall economy - she is forecasting 3 1/2% GDP growth this year. And on unemployment:
I was heartened when the unemployment rate dropped in January to 9.7 percent from 10 percent the month before. I was further encouraged when the rate remained at 9.7 percent in February, suggesting it was not just a flash in the pan. In the months ahead, we could get a bump in employment from census hiring. But that, of course, would be temporary. Given my moderate growth forecast, I fear that unemployment will stay high for years. The rate should edge down from its current level to about 9 1/4 percent by the end of this year and still be about 8 percent by the end of 2011, a very disappointing prospect.I think that is a little optimistic too - although the next few months will see a slight decline because of Census hiring (but that will be unwound later in the year).
HAMP applicants tanned and juiced
by Calculated Risk on 3/23/2010 01:23:00 PM
CR Note: The following is from long time reader Shnaps. Shnaps has been working in the mortgage industry in various capacities "since people were extending the antennas on their mobile phones". Shnaps currently serves in a key role related to HAMP at one of the largest non-prime mortgage servicers in the Nation.
Shnaps writes:
One aspect of the Making Home Affordable loan modification program known as ‘HAMP’ is almost always taken for granted in its wide reporting – that the borrowers in fact need ‘help’. Moreover, it is generally taken for granted that those seeking modification under HAMP simply cannot afford their monthly mortgage payment. It is assumed that they have made great sacrifices, assumed they have already cut back drastically on discretionary expenses, assumed that they have already gone over their monthly budgets with a fine-toothed comb to eliminate all but the most necessary expenditures in an effort to keep their home. So prepare to be shocked – shocked! – as I share with you that I have seen first-hand that this assumption is oftentimes greatly, seriously flawed.
Let me begin with a word to the wise for HAMP applicants: unless you believe Snooki is now in charge of approving HAMP applications, it might be a good idea to cut back a bit on some of the creature comforts to which you have become accustomed at least a month before submitting your HAMP modification application.
Allow me to explain. The guidelines for servicers participating in HAMP stipulate that the borrower must submit a “hardship affidavit”. This, ostensibly, is to serve as their sworn testimony that they have been driven into default due to some particular hardship they encountered, and despite making every possible sacrifice, they can no longer “maintain payment on the mortgage and cover basic living expenses at the same time". (see HAMP Directive)
To demonstrate this, applicants are required to submit recent paystubs and bank statements. The statements are to help further corroborate the income they report (lest they forget to include all of their paystubs) and also to demonstrate that their monthly expenses are as described on their application. Which is to say that they have already ‘cut back to the bone’ and STILL are unable to make ends meet.
So how do these look in practice? The very first ‘HAMPlication’ that your correspondent pulled up recently showed a wanton disregard for minimizing spending. On the contrary, it looked like “cutting back” for this applicant does not involve such Draconian cuts as eliminating:
• visits to the tanning salon
• the nail spa
• some kind of gourmet produce market (have you seen the price of arugula?)
• various liquor stores
• A DirecTV bill that must involve some serious premium programming or pay-per-view events (or both?).
• And over $1,700 in retail purchases, including: Best Buy, Baby Gap, Brookstone, Old Navy, Bed, Bath & Beyond, Home Depot, Macy’s, Pac Sun, Urban Behavior, Sears, Staples, and Footlocker.
And that was just in one month! They were seeking to reduce a $1,880 mortgage payment that had just gotten to be a real cramp to their ability to keep a roof over their heads.
I’d like to say this is the exception, but it’s much closer to the norm. Many people who request HAMP modifications submit bank statements that demonstrate little if any “belt-tightening” going on.
Somehow, we now expect the same people who asked for ‘liar’s loans’ to be truthful on when it comes to ‘hardship affidavits’?
More on Existing Home Sales and Inventory
by Calculated Risk on 3/23/2010 11:22:00 AM
Earlier the NAR released the existing home sales data for February; here are a couple more graphs ...  Click on graph for larger image in new window.
This graph shows NSA monthly existing home sales for 2005 through 2010 (see Red columns for 2010).
Sales (NSA) in February 2010 were 7.9% higher than in February 2009, and 3.2% lower than in February 2008.
We will probably see an increase in sales in May and June because of the tax credit, however I expect to see existing home sales below last year later this year.
The second graph shows the Year-over-year change in reported existing home inventory. There was a rapid increase in inventory in the 2nd half of 2005 (that helped me call the peak of the bubble), and the YoY inventory has been decreasing for the last 19 months. However the YoY decline is getting smaller - even with a large reported inventory (and probably more shadow inventory). This is something to watch.
This slow decline in the inventory is especially concerning with 8.6 months of supply in February - well above normal.


