 RSS Feed
 by Calculated Risk on 3/13/2025 03:55:00 PM
Thursday, March 13, 2025
Hotels: Occupancy Rate Decreased 1.4% Year-over-year
This will be something to watch. The Top 3 countries for tourist visits to the US in 2023 were:
1) Canada 31% in 2023
2) Mexico 22% in 2023
3) UK 6% in 2023
And it appears there has been a sharp decline in Canadians traveling to the U.S. United Airlines CEO noted that their weaker outlook is due to a drop in traffic:
“We've already started the process of where that capacity is coming out. A lot of it transborder, big drop in Canadian traffic to go into the U.S.”.This could impact hotel occupancy in the U.S.
The U.S. hotel industry reported mixed year-over-year comparisons, according to CoStar’s latest data through 8 March. ...The following graph shows the seasonal pattern for the hotel occupancy rate using the four-week average.
2-8 March 2025 (percentage change from comparable week in 2024):
• Occupancy: 62.4% (-1.4%)
• Average daily rate (ADR): US$160.53 (+2.1%)
• Revenue per available room (RevPAR): US$100.11 (+0.6%)
emphasis added
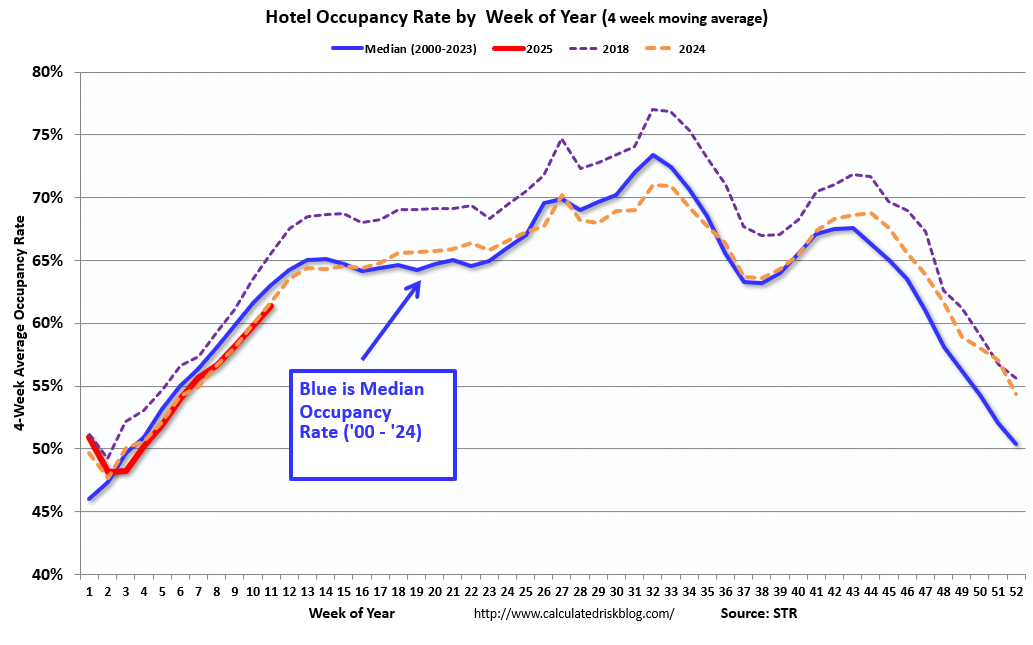 Click on graph for larger image.
The red line is for 2025, blue is the median, and dashed light blue is for 2024. Dashed purple is for 2018, the record year for hotel occupancy.
The 4-week average of the occupancy rate is tracking last year and is lower than the median rate for the period 2000 through 2024 (Blue).
Note: Y-axis doesn't start at zero to better show the seasonal change.
The 4-week average will increase seasonally for the next several weeks.
The "Home ATM" Mostly Closed in Q4
by Calculated Risk on 3/13/2025 12:55:00 PM
Today, in the Calculated Risk Real Estate Newsletter: The "Home ATM" Mostly Closed in Q4
A brief excerpt:
During the housing bubble, many homeowners borrowed heavily against their perceived home equity - jokingly calling it the “Home ATM” - and this contributed to the subsequent housing bust, since so many homeowners had negative equity in their homes when house prices declined.
...
Here is the quarterly increase in mortgage debt from the Federal Reserve’s Financial Accounts of the United States - Z.1 (sometimes called the Flow of Funds report) released today. In the mid ‘00s, there was a large increase in mortgage debt associated with the housing bubble.
In Q4 2024, mortgage debt increased $100 billion, down from $105 billion in Q3, and down from the cycle peak of $459 billion in Q2 2021. Note the almost 7 years of declining mortgage debt as distressed sales (foreclosures and short sales) wiped out a significant amount of debt.
However, some of this debt is being used to increase the housing stock (purchase new homes), so this isn’t all Mortgage Equity Withdrawal (MEW).

Fed's Flow of Funds: Household Net Worth Increased $0.2 Trillion in Q4
by Calculated Risk on 3/13/2025 12:00:00 PM
The Federal Reserve released the Q4 2024 Flow of Funds report today: Financial Accounts of the United States.
The net worth of households and nonprofits rose to $169.4 trillion during the fourth quarter of 2024. The value of directly and indirectly held corporate equities increased $0.3 trillion and the value of real estate decreased $0.4 trillion.
...
Household debt increased 3.1 percent at an annual rate in the fourth quarter of 2024. Consumer credit grew at an annual rate of 2.6 percent, while mortgage debt (excluding charge-offs) grew at an annual rate of 2.2 percent.
 Click on graph for larger image.
The first graph shows Households and Nonprofit net worth as a percent of GDP.
Net worth increased $0.2 trillion in Q4 to an all-time high. As a percent of GDP, net worth decreased in Q4 and is below the peak in 2021.
This includes real estate and financial assets (stocks, bonds, pension reserves, deposits, etc.) net of liabilities (mostly mortgages). Note that this does NOT include public debt obligations.
 The second graph shows homeowner percent equity since 1952.
Household percent equity (as measured by the Fed) collapsed when house prices fell sharply in 2007 and 2008.
In Q4 2024, household percent equity (of household real estate) was at 74.4% - down from 74.7% in Q3, 2024. This is close to the highest percent equity since the 1960s.
Note: This includes households with no mortgage debt.
 The third graph shows household real estate assets and mortgage debt as a percent of GDP.
Mortgage debt increased by $100 billion in Q4.
Mortgage debt is up $2.57 trillion from the peak during the housing bubble, but, as a percent of GDP is at 44.9% - down from Q3 - and down from a peak of 73.1% of GDP during the housing bust.
The value of real estate, as a percent of GDP, decreased in Q4 and is below the recent peak in Q2 2022, but is well above the median of the last 30 years.
 The second graph shows homeowner percent equity since 1952.
 Household percent equity (as measured by the Fed) collapsed when house prices fell sharply in 2007 and 2008.
In Q4 2024, household percent equity (of household real estate) was at 74.4% - down from 74.7% in Q3, 2024. This is close to the highest percent equity since the 1960s.
Note: This includes households with no mortgage debt.
 The third graph shows household real estate assets and mortgage debt as a percent of GDP.
 Mortgage debt increased by $100 billion in Q4.
Mortgage debt is up $2.57 trillion from the peak during the housing bubble, but, as a percent of GDP is at 44.9% - down from Q3 - and down from a peak of 73.1% of GDP during the housing bust.
The value of real estate, as a percent of GDP, decreased in Q4 and is below the recent peak in Q2 2022, but is well above the median of the last 30 years.
CoreLogic: 1.1 million Homeowners with Negative Equity in Q4 2024
by Calculated Risk on 3/13/2025 10:18:00 AM
From CoreLogic: CoreLogic: Borrowers Gained Over $280B in Home Equity in 2024
CoreLogic® ... today released the Homeowner Equity Report (HER) for the fourth quarter of 2024. Nationwide, borrower equity increased by $281.9 billion, or 1.7% year-over-year. The report shows that U.S. homeowners with mortgages (which account for roughly 61% of all properties) saw home equity increase by about $4,100 between Q4 2023 and Q4 2024, which is less than the gain of $6,000 in Q3 2023. The states that saw the largest gains were New Jersey ($39,400), Connecticut ($36,300), and Massachusetts ($34,400), while the largest losses were in Hawaii ($-28,700), Florida ($-18,100), and the District of Columbia ($-14,700).
Quarter-over-quarter, the total number of mortgage residential properties with negative equity increased by 9.3% to 1.1 million homes or 2% of all mortgaged properties. While year-over-year, negative equity increased by 7% from 1 million homes, or 1.8% of all mortgage properties.
“Housing equity growth slowed in 2024 versus 2020-2023 due to moderating price appreciation, but homeowners maintain substantial equity gains from prior years, preserving their strong financial position,” said Dr. Selma Hepp, chief economist for CoreLogic.
 From the press release:
 Home prices continued to be the major driver of equity shifts and markets with declining prices generally saw fallen equity in 2024. In particular, a number of Florida’s markets, including Cape Coral, Sarasota, Lakeland and Tampa have experienced weakening prices over the past year, which led to Florida’s average equity declining by about $18,000 at the end of 2024. Thinking ahead, in light of mass government layoffs in Washington metro region, it is important to note that borrowers in the tri-state area have accumulated between $261,000 (in Maryland), $287,000 (in Virginia) and $353,000 (in Washington DC), in average home equity which will help as a financial buffer but also provide a downpayment in case of a move.This map from CoreLogic shows the average year-over-year change in equity by state. States with surging inventory - like Florida and Texas - saw declines in equity.
Weekly Initial Unemployment Claims Decrease to 220,000
by Calculated Risk on 3/13/2025 08:30:00 AM
The DOL reported:
In the week ending March 8, the advance figure for seasonally adjusted initial claims was 220,000, a decrease of 2,000 from the previous week's revised level. The previous week's level was revised up by 1,000 from 221,000 to 222,000. The 4-week moving average was 226,000, an increase of 1,500 from the previous week's revised average. The previous week's average was revised up by 250 from 224,250 to 224,500.The following graph shows the 4-week moving average of weekly claims since 1971.
emphasis added
 Click on graph for larger image.
The dashed line on the graph is the current 4-week average. The four-week average of weekly unemployment claims increased to 226,000.
The previous week was revised up.
Weekly claims were lower than the consensus forecast.
Wednesday, March 12, 2025
Thursday: Unemployment Claims, PPI, Q4 Flow of Funds
by Calculated Risk on 3/12/2025 07:51:00 PM
 Note: Mortgage rates are from MortgageNewsDaily.com and are for top tier scenarios.
Thursday:
• At 8:30 AM ET, The initial weekly unemployment claims report will be released. The consensus is for 225 initial claims up from 221 thousand last week.
• Also at 8:30 AM, The Producer Price Index for February from the BLS. The consensus is for a 0.3% increase in PPI, and a 0.3% increase in core PPI.
• At 12:00 PM, Q4 Flow of Funds Accounts of the United States from the Federal Reserve.
Part 2: Current State of the Housing Market; Overview for mid-March 2025
by Calculated Risk on 3/12/2025 12:53:00 PM
Today, in the Calculated Risk Real Estate Newsletter: Part 2: Current State of the Housing Market; Overview for mid-March 2025
A brief excerpt:
Earlier this week, in Part 1: Current State of the Housing Market; Overview for mid-March 2025 I reviewed home inventory, housing starts and sales.There is much more in the article.
In Part 2, I will look at house prices, mortgage rates, rents and more.
These “Current State” summaries show us where we came from, where we are, and hopefully give us clues as to where we are going!
NOTE: I started the year adopting the position of Fed Chair Powell, taking a “wait and see” approach on what policies would actually be enacted. Now I’m trying to understand the impact of policy changes on housing. It appears building costs will increase significantly, and demand for housing will likely decline. I’ll have more soon.
...
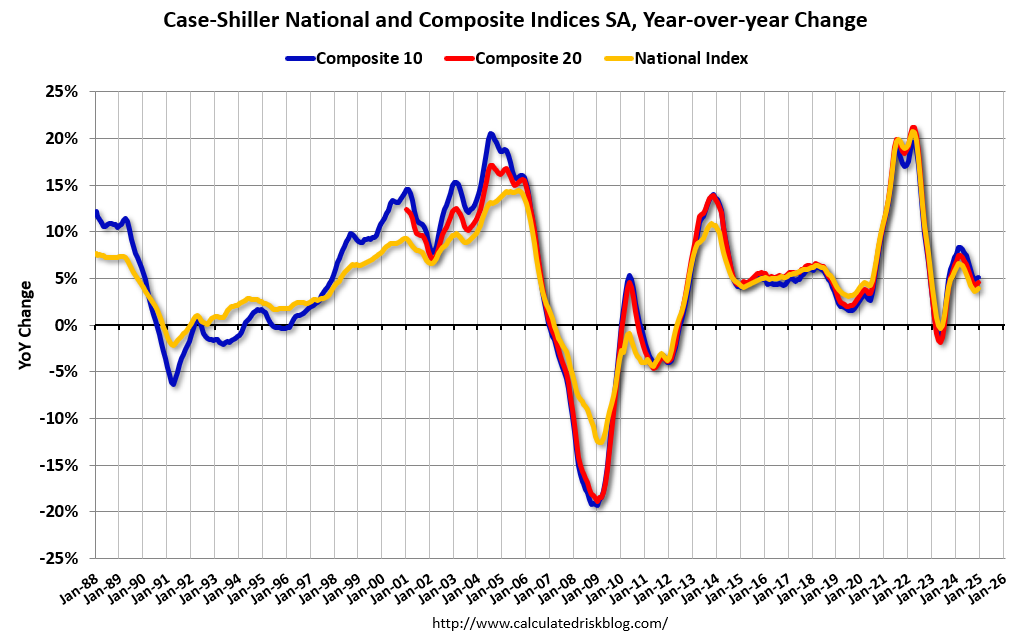
The Case-Shiller National Index increased 3.9% year-over-year (YoY) in December and will be about the same YoY - or slightly higher - in the January report (based on other data).
The MoM increase in the seasonally adjusted (SA) Case-Shiller National Index was at 0.46% (a 5.7% annual rate), This was the 23rd consecutive MoM increase in the seasonally adjusted index.
Cleveland Fed: Median CPI increased 0.3% and Trimmed-mean CPI increased 0.3% in February
by Calculated Risk on 3/12/2025 11:23:00 AM
The Cleveland Fed released the median CPI and the trimmed-mean CPI.
According to the Federal Reserve Bank of Cleveland, the median Consumer Price Index rose 0.3% in February. The 16% trimmed-mean Consumer Price Index increased 0.3%. "The median CPI and 16% trimmed-mean CPI are measures of core inflation calculated by the Federal Reserve Bank of Cleveland based on data released in the Bureau of Labor Statistics’ (BLS) monthly CPI report".
 Click on graph for larger image.
This graph shows the year-over-year change for these four key measures of inflation.
On a year-over-year basis, the median CPI rose 3.5% (down from 3.6% YoY in January), the trimmed-mean CPI rose 3.1% (unchanged from 3.1%), and the CPI less food and energy rose 3.3% (down from 3.1%).
Core PCE is for January was up 2.7% YoY, down from 2.9% in December.
YoY Measures of Inflation: Services, Goods and Shelter
by Calculated Risk on 3/12/2025 08:48:00 AM
Here are a few measures of inflation:
The first graph is the one Fed Chair Powell had mentioned two years ago when services less rent of shelter was up around 8% year-over-year. This declined, but is still elevated, and is now up 3.8% YoY.
 Click on graph for larger image.
This graph shows the YoY price change for Services and Services less rent of shelter through February 2025.
Services were up 4.1% YoY as of February 2025, down from 4.2% YoY in January.
Services less rent of shelter was up 3.8% YoY in February, down from 3.9% YoY in January.
Services less rent of shelter was up 3.8% YoY in February, down from 3.9% YoY in January.
 The second graph shows that goods prices started to increase year-over-year (YoY) in 2020 and accelerated in 2021 due to both strong demand and supply chain disruptions.
Durables were at -1.2% YoY as of February 2025, unchanged from -1.2% YoY in January.
Commodities less food and energy commodities were at -0.0% YoY in February, up from -0.1% YoY in January.
Commodities less food and energy commodities were at -0.0% YoY in February, up from -0.1% YoY in January.
 Here is a graph of the year-over-year change in shelter from the CPI report (through February) and housing from the PCE report (through January)
Shelter was up 4.2% year-over-year in February, down from 4.4% in January. Housing (PCE) was up 4.5% YoY in January, down from 4.7% in December.
This is still catching up with private new lease data.
Core CPI ex-shelter was up 2.2% YoY in February.
BLS: CPI Increased 0.2% in February; Core CPI increased 0.2%
by Calculated Risk on 3/12/2025 08:30:00 AM
The Consumer Price Index for All Urban Consumers (CPI-U) increased 0.2 percent on a seasonally adjusted basis in February, after rising 0.5 percent in January, the U.S. Bureau of Labor Statistics reported today. Over the last 12 months, the all items index increased 2.8 percent before seasonal adjustment.The change in CPI was below expectations. I'll post a graph later today after the Cleveland Fed releases the median and trimmed-mean CPI.
The index for shelter rose 0.3 percent in February, accounting for nearly half of the monthly all items increase. The shelter increase was partially offset by a 4.0-percent decrease in the index for airline fares and a 1.0-percent decline in the index for gasoline. Despite the decrease in the gasoline index, the energy index rose 0.2 percent over the month as the indexes for electricity and natural gas increased. The index for food also increased in February, rising 0.2 percent as the index for food away from home increased 0.4 percent. The food at home index was unchanged over the month.
The index for all items less food and energy rose 0.2 percent in February, following a 0.4-percent increase in January. Indexes that increased over the month include medical care, used cars and trucks, household furnishings and operations, recreation, apparel, and personal care. The indexes for airline fares and new vehicles were among the few major indexes that decreased in February.
The all items index rose 2.8 percent for the 12 months ending February, after rising 3.0 percent over the 12 months ending January. The all items less food and energy index rose 3.1 percent over the last 12 months. The energy index decreased 0.2 percent for the 12 months ending February. The food index increased 2.6 percent over the last year.
emphasis added


