 RSS Feed
 by Calculated Risk on 1/14/2025 07:49:00 PM
Tuesday, January 14, 2025
Wednesday: CPI, NY Fed Mfg, Beige Book
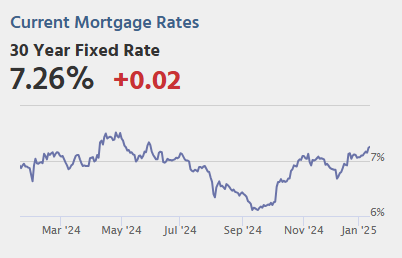
 Note: Mortgage rates are from MortgageNewsDaily.com and are for top tier scenarios.
Wednesday:
• At 7:00 AM ET, The Mortgage Bankers Association (MBA) will release the results for the mortgage purchase applications index.
• At 8:30 AM, The Consumer Price Index for December from the BLS. The consensus is for 0.3% increase in CPI, and a 0.2% increase in core CPI. The consensus is for CPI to be up 2.9% year-over-year and core CPI to be up 3.3% YoY.
• At 8:30 AM, The New York Fed Empire State manufacturing survey for January. The consensus is for a reading of -2.0, down from 0.2.
• At 2:00 PM, the Federal Reserve Beige Book, an informal review by the Federal Reserve Banks of current economic conditions in their Districts.
Two Bank Failures in 2024
by Calculated Risk on 1/14/2025 01:31:00 PM
There were four bank failures in 2024. The median number of failures since the FDIC was established in 1933 was 7 - so 2 failures in 2024 was below the median.
There were five bank failures in 2023, however 3 of the failures were larger banks: First Republic Bank, San Francisco, CA, Signature Bank, New York, NY, Silicon Valley Bank, Santa Clara, CA.
The first graph shows the number of bank failures per year since the FDIC was founded in 1933.
 Click on graph for larger image.
Typically about 7 banks fail per year.
Note: There were a large number of failures in the '80s and early '90s. Many of these failures were related to loose lending, especially for commercial real estate. Also, a large number of the failures in the '80s and '90s were in Texas with loose regulation.
Even though there were more failures in the '80s and early '90s than during the financial crisis, the financial crisis was much worse (larger banks failed and were bailed out).
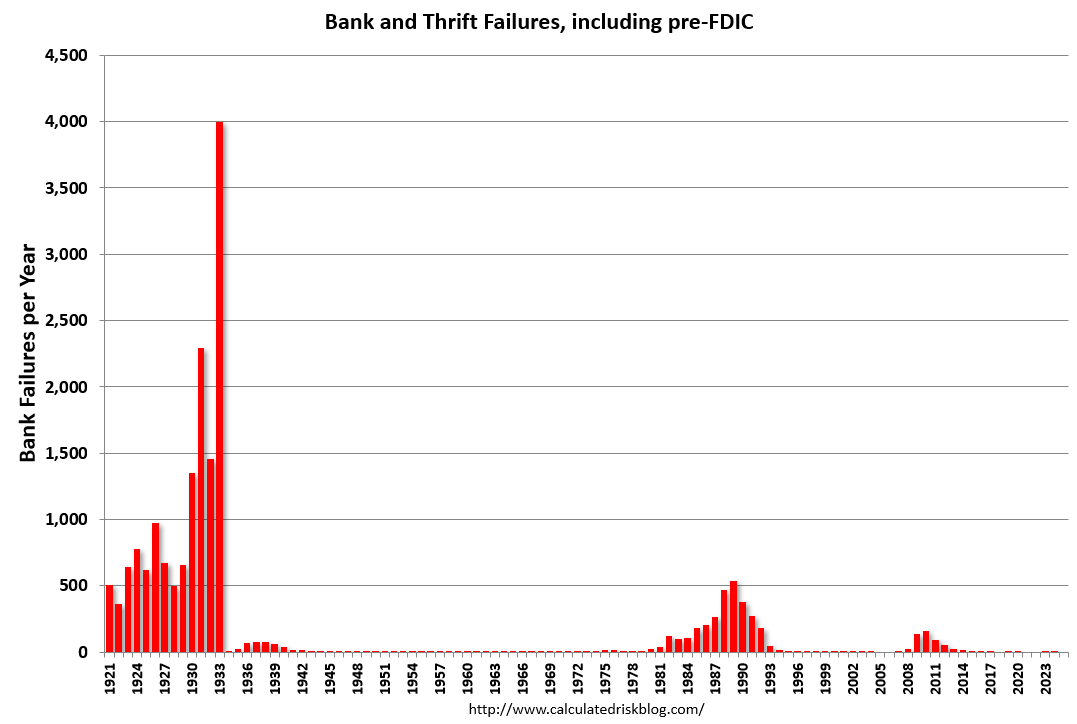 The second graph includes pre-FDIC failures. In a typical year - before the Depression - 500 banks would fail and the depositors would lose a large portion of their savings.
Then, during the Depression, thousands of banks failed. Note that the S&L crisis and recent financial crisis look small on this graph.
Part 1: Current State of the Housing Market; Overview for mid-January 2025
by Calculated Risk on 1/14/2025 10:08:00 AM
Today, in the Calculated Risk Real Estate Newsletter: Part 1: Current State of the Housing Market; Overview for mid-January 2025
A brief excerpt:
This 2-part overview for mid-January provides a snapshot of the current housing market.There is much more in the article.
I always focus first on inventory, since inventory usually tells the tale! I’m watching months-of-supply closely.
...
New home inventory, as a percentage of total inventory, is still very high. The following graph uses Not Seasonally Adjusted (NSA) existing home inventory from the National Association of Realtors® (NAR) and new home inventory from the Census Bureau (only completed and under construction inventory).
t took a number of years following the housing bust for new home inventory to return to the pre-bubble percent of total inventory. Then, with the pandemic, existing home inventory collapsed and now the percent of new homes is 22.4% of the total for sale inventory, down from a peak of 27.2% in December 2022.
The percent of new homes of total inventory should continue to decline as existing home inventory increases. However, the percent of new home inventory will increase seasonally over the Winter as existing homes are withdrawn from the market.

CPI Preview
by Calculated Risk on 1/14/2025 08:12:00 AM
The Consumer Price Index for December is scheduled to be released tomorrow. The consensus is for 0.3% increase in CPI, and a 0.2% increase in core CPI. The consensus is for CPI to be up 2.9% year-over-year and core CPI to be up 3.3% YoY.
From Goldman Sachs economists:
We expect a 0.25% increase in December core CPI (vs. 0.2% consensus), corresponding to a year-over-year rate of 3.27% (vs. 3.3% consensus). We expect a 0.40% increase in December headline CPI (vs. 0.3% consensus), reflecting 0.35% higher food prices and 2.3% higher energy prices. Our forecast is consistent with a 0.21% increase in CPI core services excluding rent and owners’ equivalent rent and with a 0.18% increase in core PCE in December.From BofA:
We forecast both headline and core CPI inflation to remain at 0.3% m/m in December, although there is a risk that the core could round down to 0.2%. The y/y rate should tick up a tenth to 2.8% for headline and remain unchanged at 3.3% for core.
Monday, January 13, 2025
Tuesday: PPI
by Calculated Risk on 1/13/2025 08:17:00 PM
 From Matthew Graham at Mortgage News Daily: Mortgage Rates Slightly Higher to Start New Week
The more important consideration is the new round of potential volatility on the horizon. Whereas it was the jobs report last week, this week's critical data will be Wednesday's Consumer Price Index (CPI). Tomorrow's inflation data (the Producer Price Index) is not quite as important, but a nonetheless capable of causing a reaction.Tuesday:
If inflation comes in higher than expected, it could easily push rates even higher. [30 year fixed 7.26%]
emphasis added
• At 6:00 AM ET, NFIB Small Business Optimism Index for December.
• At 8:30 AM, The Producer Price Index for December from the BLS. The consensus is for a 0.4% increase in PPI, and a 0.3% increase in core PPI.
Las Vegas November 2024: Visitor Traffic Up 0.6% YoY; Convention Traffic Down 8.4%
by Calculated Risk on 1/13/2025 02:16:00 PM
From the Las Vegas Visitor Authority: November 2024 Las Vegas Visitor Statistics
Punctuated by the second annual F1 Las Vegas Grand Prix and the SEMA tradeshow, Las Vegas hosted more than 3.3M visitors in November, slightly up over last year (+0.6% YoY).
With a net decrease in churn of mid‐size and smaller meetings vs. last year, convention attendance was 548k for the month, down ‐8.4% YoY.
November saw higher Weekend occupancy vs. last year (89.1%, up 0.4 pts) but lower Midweek occupancy (76.9%, down ‐2.0 pts) as overall Hotel occupancy for the month reached 81.4%, down ‐0.5 pts. While down compared to the record‐shattering levels tied to last year's inaugural F1 race, monthly ADR this year saw the second highest on record for the month of November, reaching $199 (‐20.3% YoY) while RevPAR came in at approx. $162 (‐20.8% YoY).
emphasis added
 Click on graph for larger image.
 The first graph shows visitor traffic for 2019 (Black), 2020 (dark blue), 2021 (light blue), 2022 (light orange), 2023 (dark orange) and 2024 (red).
Visitor traffic was up 0.6% compared to last November. Visitor traffic was down 3.2% compared to November 2019.
Year-to-date visitor traffic is down 5.6% compared to 2019.
The second graph shows convention traffic.

Convention traffic was down 8.4% compared to November 2023, and down 9.1% compared to November 2019. 
Year-to-date convention traffic is down 9.2% compared to 2019.
2nd Look at Local Housing Markets in December
by Calculated Risk on 1/13/2025 10:09:00 AM
Today, in the Calculated Risk Real Estate Newsletter: 2nd Look at Local Housing Markets in December
A brief excerpt:
NOTE: The tables for active listings, new listings and closed sales all include a comparison to December 2019 for each local market (some 2019 data is not available).There is much more in the article.
This is the second look at several early reporting local markets in December. I’m tracking over 40 local housing markets in the US. Some of the 40 markets are states, and some are metropolitan areas. I’ll update these tables throughout the month as additional data is released.
Closed sales in December were mostly for contracts signed in October and November when 30-year mortgage rates averaged 6.43% and 6.81%, respectively (Freddie Mac PMMS). This was an increase from the average rate for homes that closed in November, but down from the average rate of 7.5% in October and November 2023.
...
Here is a look at months-of-supply using NSA sales. Since this is NSA data, it is likely this will be the seasonal low for months-of-supply.
Note the regional differences with more months-of-supply in the South, especially in Florida and Texas.
...
Many more local markets to come!

Housing Jan 13th Weekly Update: Inventory down 1.7% Week-over-week, Up 23.6% Year-over-year
by Calculated Risk on 1/13/2025 08:11:00 AM
Altos reports that active single-family inventory was down 1.7% week-over-week.
Inventory will continue to decline seasonally and probably bottom in late January or February.
The first graph shows the seasonal pattern for active single-family inventory since 2015.
 Click on graph for larger image.
The red line is for 2024. The black line is for 2019.
Inventory was up 23.6% compared to the same week in 2024 (last week it was up 27.3%), and down 23.3% compared to the same week in 2019 (last week it was down 22.2%).
Back in June 2023, inventory was down almost 54% compared to 2019, so the gap to more normal inventory levels has closed significantly!
 This second inventory graph is courtesy of Altos Research.
As of Jan 10th, inventory was at 624 thousand (7-day average), compared to 635 thousand the prior week.
Mike Simonsen discusses this data regularly on Youtube.
Sunday, January 12, 2025
Sunday Night Futures
by Calculated Risk on 1/12/2025 06:45:00 PM
Weekend:
• Schedule for Week of January 12, 2025
Monday:
• No major economic releases scheduled.
From CNBC: Pre-Market Data and Bloomberg futures S&P 500 are unchanged and DOW futures are up 68 (fair value).
Oil prices were up over the last week with WTI futures at $76.57 per barrel and Brent at $79.76 per barrel. A year ago, WTI was at $73, and Brent was at $80 - so WTI oil prices are up about 5% year-over-year.
Here is a graph from Gasbuddy.com for nationwide gasoline prices. Nationally prices are at $3.06 per gallon. A year ago, prices were at $3.06 per gallon, so gasoline prices are unchanged year-over-year.
January 12th COVID Update: COVID in Wastewater Increasing
by Calculated Risk on 1/12/2025 10:17:00 AM
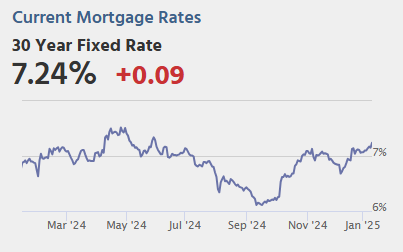 Note: Mortgage rates are from MortgageNewsDaily.com and are for top tier scenarios.
For deaths, I'm currently using 4 weeks ago for "now", since the most recent three weeks will be revised significantly.
Note: "Effective May 1, 2024, hospitals are no longer required to report COVID-19 hospital admissions, hospital capacity, or hospital occupancy data." So I'm no longer tracking hospitalizations.
| COVID Metrics | ||||
|---|---|---|---|---|
| Now | Week Ago | Goal | ||
| Deaths per Week🚩 | 500 | 450 | ≤3501 | |
| 1my goals to stop weekly posts. 🚩 Increasing number weekly for Deaths. ✅ Goal met. | ||||
 Click on graph for larger image.
This graph shows the weekly (columns) number of deaths reported for the last 2 years.
Although weekly deaths met the original goal to stop posting, I'm continuing to post now that deaths are above the goal again - and at a minimum, I'll continue to post through the Winter.
Weekly deaths have mostly been declining, however weekly deaths are still above the low of 313 in early June 2024.
 This appears to be a leading indicator for COVID hospitalizations and deaths.
Natinally COVID in wastewater is "HIGH" according to the CDC - especially in the Midwest where it is "Very High" - and more than triple the lows of last May - and increasing. Something to watch.


